Catching a trend reversal at the exact turning point is the most profitable trade in crypto — and also the most dangerous. For every trader who nailed the BTC bottom at $74,000 in early 2025, dozens got liquidated trying to "call the bottom" on the way down. The difference between those who survive reversal trading and those who blow up isn't talent or luck — it's process.
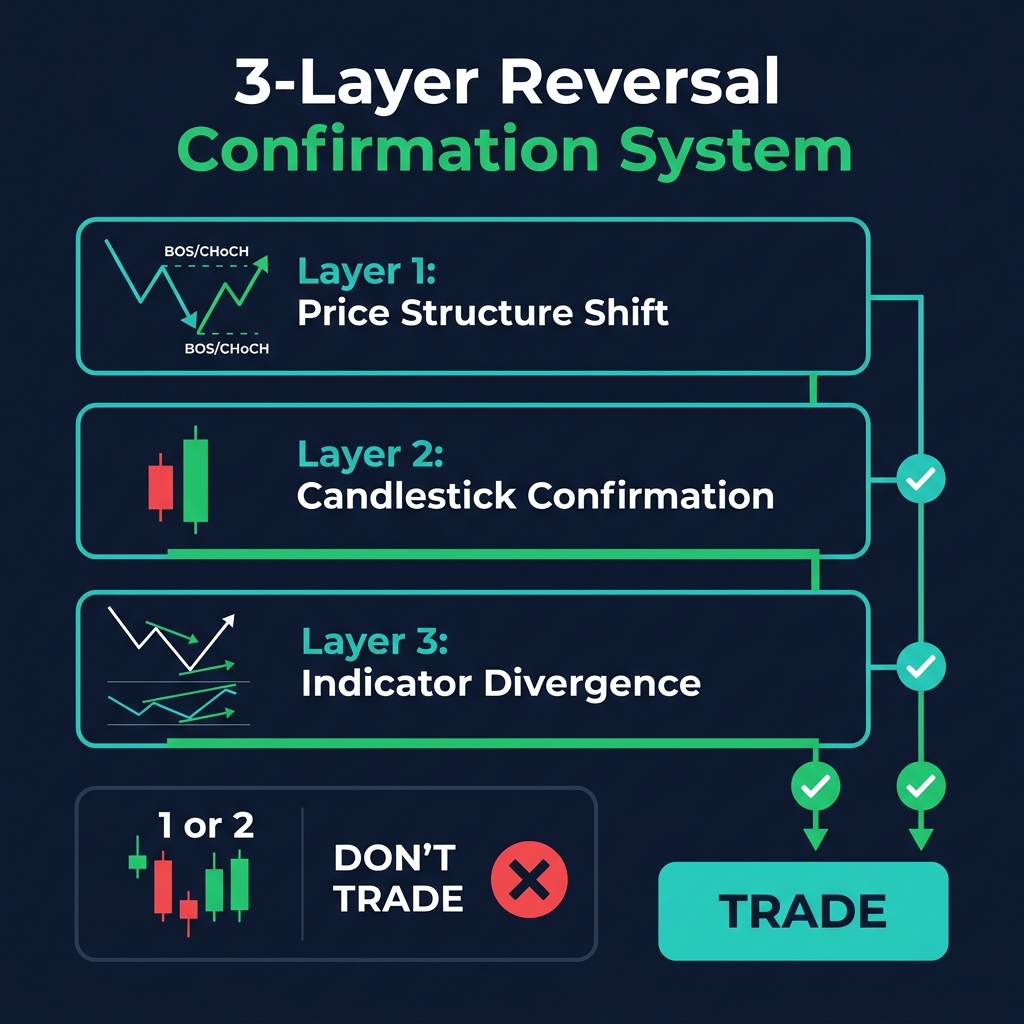
This guide gives you that process. Instead of gambling on a single candle or one oversold RSI reading, you'll learn a 3-layer confirmation system that requires structural, candlestick, and indicator evidence to align before you risk capital. If all three layers confirm, you have a high-probability reversal setup. If only one or two layers fire — you stay out.
This isn't theory. Every concept here connects to existing CoinXSight Academy guides on market structure, candlestick patterns, and divergence trading. This article unifies them into a single, actionable reversal trading strategy.
What Is a Reversal — And What It Is Not
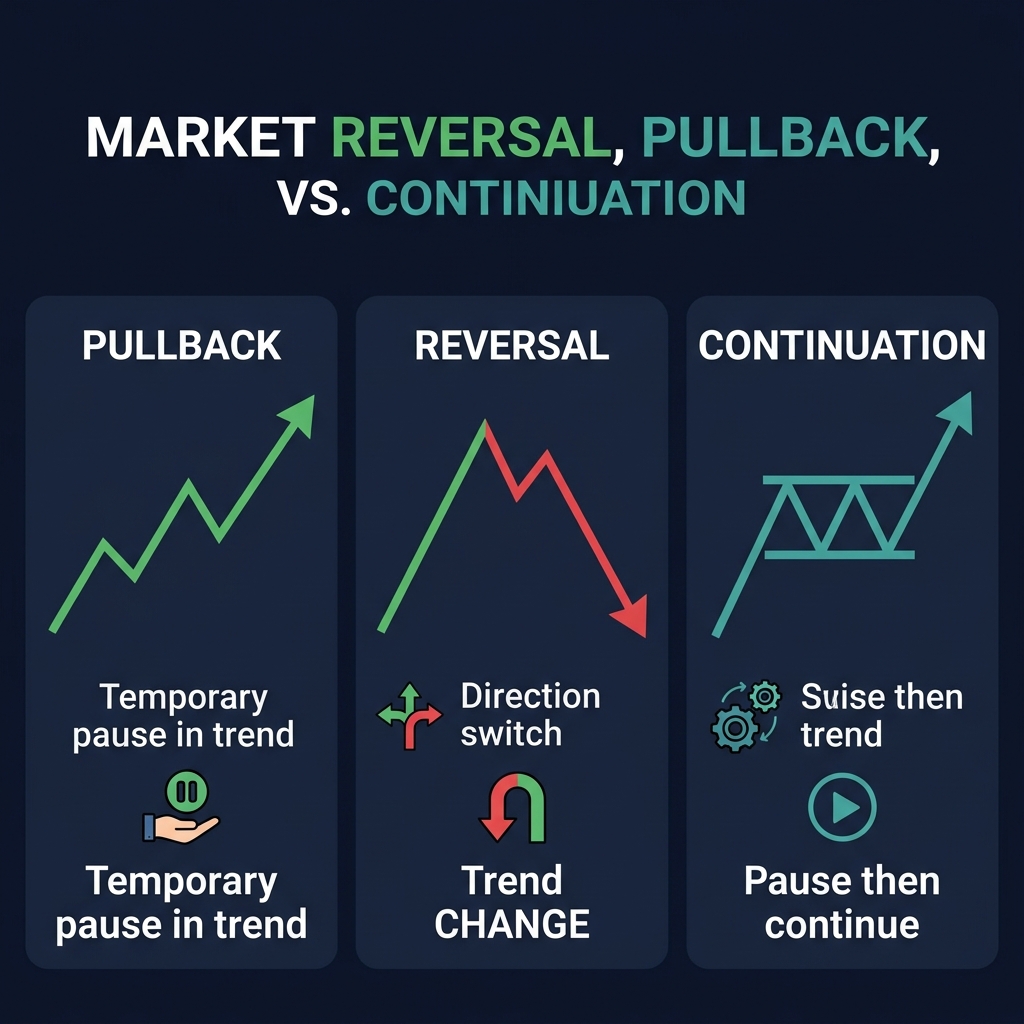
Before you trade a single reversal, you need to distinguish between three types of price movement that traders constantly confuse:
New trend establishes with new HH/HL or LH/LL sequence
✅ Yes — this is the target
Pullback
Temporary counter-trend move within an intact trend
Trend resumes in original direction
❌ No — you'll get stopped out
Continuation
Brief pause (consolidation) before trend resumes
Price breaks out in the original trend direction
❌ No — this is the opposite of a reversal
The costly mistake: Most failed reversal trades are actually pullbacks mistaken for reversals. BTC drops from $108,000 to $103,000 in a strong uptrend — a trader shorts, calling it a "reversal." BTC bounces to $110,000 and the short is liquidated. That $5,000 drop was a pullback, not a reversal. The trend structure (higher highs, higher lows on the daily chart) was never broken.
The critical filter: A real reversal requires a structural shift — the pattern of highs and lows must change. Until that happens, every counter-trend move is a pullback until proven otherwise. This single mindset shift saves more money than any indicator.
The 3 Categories of Crypto Reversal Patterns
Reversal signals don't come from one source — they come from three independent categories that each tell you something different. Understanding what each category measures (and its limitations) is the foundation of the 3-layer system.
Category A: Price Structure Reversals — The Most Reliable Signal
Price structure is the primary reversal signal because it directly measures what matters: are buyers or sellers making progress? Everything else — candles, indicators — is secondary confirmation.
How Market Structure Defines Trend Direction
At any moment, a market is in one of two structural states:
Uptrend: Higher Highs (HH) + Higher Lows (HL) — buyers are making progress
Downtrend: Lower Highs (LH) + Lower Lows (LL) — sellers are making progress
A reversal occurs when this sequence breaks. For a detailed breakdown of swing points and structure analysis, see the full market structure guide.
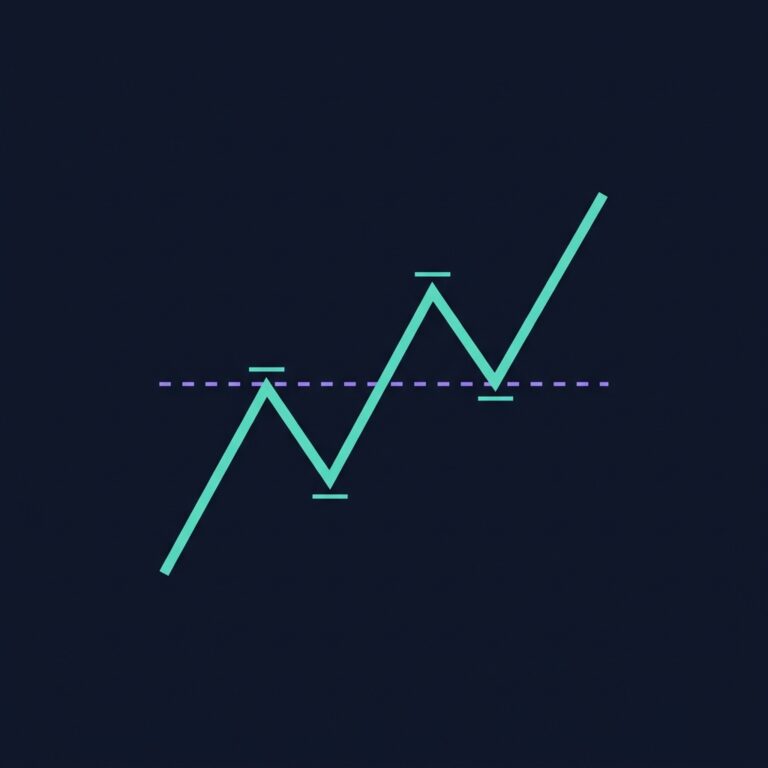
Break of Structure (BOS) vs Change of Character (CHoCH)
These two terms describe different structural events, and confusing them is one of the most common mistakes in reversal trading:
Event
What Happens
What It Means
Trading Action
BOS (Break of Structure)
Price breaks the most recent swing point in the trend direction
Trend continues — this is NOT a reversal
Trade with the trend
CHoCH (Change of Character)
Price breaks a swing point against the trend direction
First warning of potential reversal
Watch for confirmation — do NOT enter yet
CHoCH + confirming BOS
After CHoCH, price makes a new BOS in the new direction
Reversal confirmed
This is your structural entry signal
⚠️ Critical: A CHoCH alone is a warning, not a confirmed reversal. Approximately 40% of CHoCH events are false alarms — price briefly breaks the swing point, then the original trend resumes. Always wait for a confirming BOS in the new direction. CoinXSight's Deep Alpha module flags both CHoCH and BOS events automatically, and the Confluence Score helps filter false signals.
2026 Example: BTC Bearish Reversal at $109,000
Setup — BTC/USDT, Daily chart, February 2026:
From January 10 to February 18, BTC was in a strong uptrend — producing higher highs ($100,500 → $104,200 → $109,000) and higher lows ($97,800 → $101,500 → $105,300).
BTC Daily Structure — January-March 2026:

Uptrend phase:
  HL: $97,800 → HH: $100,500
  HL: $101,500 → HH: $104,200
  HL: $105,300 → HH: $109,000 ← Final higher high

CHoCH event (February 22):
  Price broke below $105,300 (the last Higher Low)
  ← First time a Higher Low was broken since January
  ← Bearish CHoCH — warning signal

Confirming Bearish BOS (March 1):
  Price continued lower and broke below $101,500
  ← New Lower Low confirmed
  ← Reversal confirmed: uptrend → downtrend

BTC fell to $94,800 over the following 2 weeks.
Key lesson: The reversal wasn't the $109,000 high itself — it was the break below $105,300 (CHoCH) and then $101,500 (confirming BOS). Traders who shorted at $109,000 "because it looked toppy" were guessing. Traders who waited for the structural shift had evidence.
Candlestick patterns are the second layer of reversal confirmation. They tell you how price is reacting at a potential turning point — but they should never be your primary signal. A hammer candle in the middle of a strong downtrend with no structural shift is just a bounce, not a reversal.
For the complete candlestick pattern library with anatomy breakdowns, see the candlestick patterns guide.
Top 5 Candlestick Reversal Patterns for Crypto
Pattern
Type
Formation
Crypto Reliability (at S/R + volume)
Best Timeframe
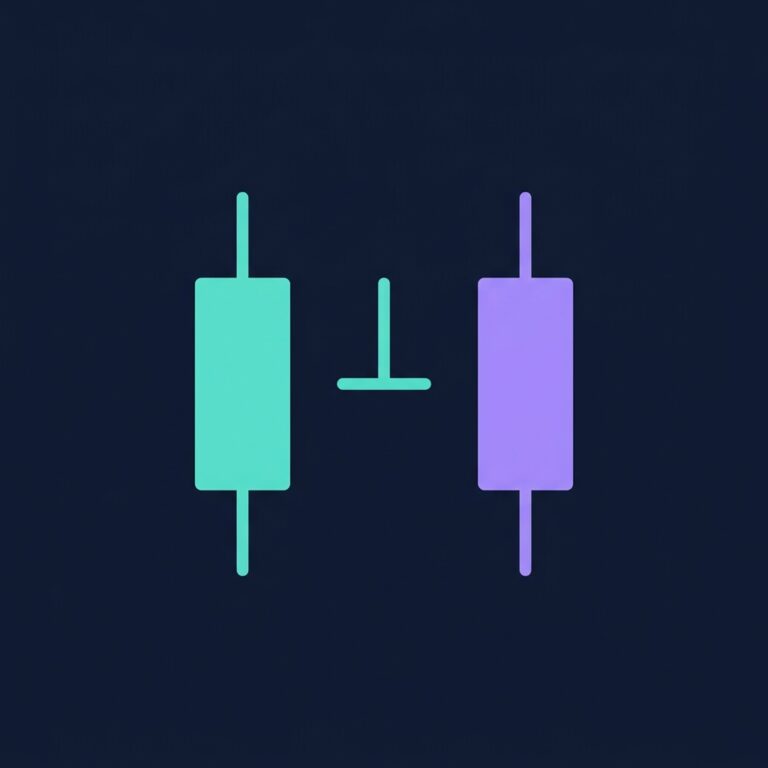
Bullish/Bearish Engulfing
2-candle
Large candle completely engulfs prior candle's body
59-61%
4H, Daily
Hammer / Shooting Star
1-candle
Small body, long wick ≥2x body length
62-64%
4H, Daily
Morning Star / Evening Star
3-candle
Large candle → small body → large candle (opposite direction)
66-68%
Daily
Three White Soldiers / Three Black Crows
3-candle
Three consecutive strong candles in one direction
57-60%
Daily
Tweezer Top / Tweezer Bottom
2-candle
Two candles with matching highs (top) or matching lows (bottom)
55-58%
4H, Daily
Reliability notes from 2026 data (BTC, ETH, SOL, 4H chart, Jan-May 2026):
Raw win rates (pattern alone, no context): 38-52% — barely better than a coin flip
Win rates at key S/R with volume confirmation: 55-68% — meaningfully profitable
Win rates when combined with structural shift: 70-78% — now we're talking
The data is clear: candlestick patterns only work in context. A morning star at a major support level where market structure is shifting is a powerful signal. The same morning star in the middle of a range with average volume is noise.
When to Trust vs When to Ignore Candlestick Patterns
Trust the pattern when:
✅ It forms at a key support/resistance level (multiple prior touches)
✅ Volume on the pattern candle is ≥1.5x the 20-period average
✅ Market structure supports the reversal direction (CHoCH has occurred)
❌ It forms at a random price level with no structural significance
❌ Volume is below average (weak conviction)
❌ The prevailing trend is strong with no structural deterioration
❌ Multiple prior pattern signals at this level have already failed
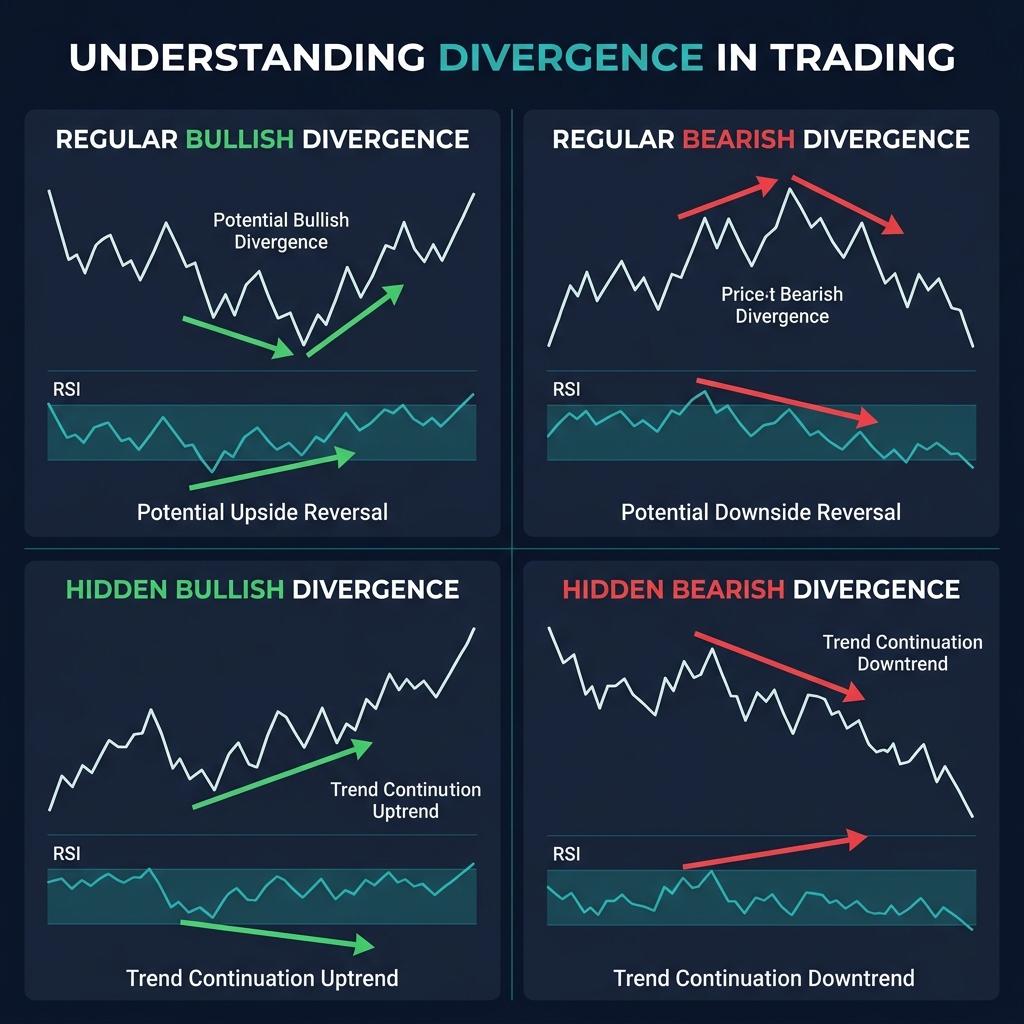
Category C: Indicator Divergence — Early Warning System
Indicator divergence is the third layer — the early warning system. Divergence tells you that momentum is weakening before price structure breaks, giving you advance notice that a reversal is developing.
Price making new highs but OBV making lower highs = distribution (smart money selling into strength)
Price making new lows but OBV making higher lows = accumulation (smart money buying into weakness)
OBV divergence is especially valuable in crypto because it detects institutional distribution before price reacts — a pattern that shows up clearly on CoinXSight's on-chain exchange flow data.
The rule: Single-indicator divergence is a heads-up. Multi-indicator divergence is a signal. When RSI, MACD, and OBV all diverge from price simultaneously, the momentum-to-price disconnect is real and a structural shift usually follows within 3-8 candles.
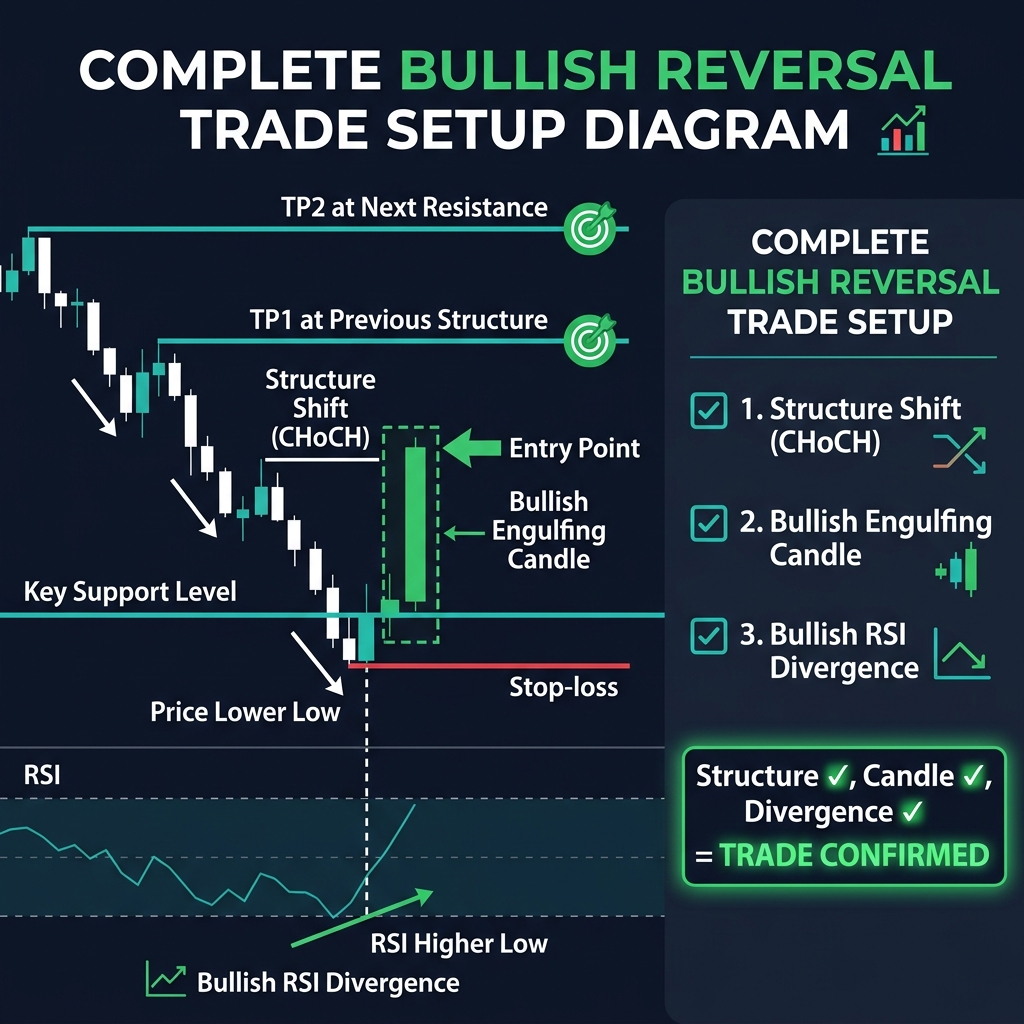
The 3-Layer Reversal Confirmation System
This is the core framework. It unifies everything above into a single decision system that protects you from false reversals while capturing genuine turning points.
The Rule: All 3 Layers Must Confirm
Layer
Signal
What It Tells You
Status
Layer 1: Price Structure
CHoCH + confirming BOS
The trend has actually shifted — not just pulling back
✔ Required
Layer 2: Candlestick Pattern
Reversal candle at the turning point
Buyers/sellers are fighting and one side is winning
✔ Required
Layer 3: Indicator Divergence
RSI/MACD/OBV divergence
Momentum was weakening before the shift — it's not random
✔ Required
Decision Matrix: How Many Layers = What Action
Layers Confirmed
Probability
Action
3 of 3
High (~70-78%)
✅ Enter the reversal trade with standard position size
2 of 3
Moderate (~55-62%)
⚠️ Add to watchlist — wait for the third layer, or trade with 25% size
1 of 3
Low (~40-48%)
❌ Do NOT trade — it's probably a pullback
0 of 3
Very Low
❌ There is no reversal. You're seeing what you want to see
💡 CoinXSight integration: Deep Alpha's Confluence Score naturally captures this multi-layer approach. When the SMC Layer shows a CHoCH, the Momentum Layer shows divergence, and the Candlestick Layer shows a reversal pattern, the Confluence Score rises to 7-8+/10 — confirming all three layers are in agreement. A Confluence Score below 6/10 usually means one or more layers are missing.
Checklist: Before Every Reversal Trade
Use this checklist before entering any reversal position:
[ ] Layer 1 — Structure: Has a CHoCH occurred on the 4H or Daily? Has a confirming BOS in the new direction followed?
[ ] Layer 2 — Candles: Is there a reversal candlestick pattern (engulfing, hammer, morning star) at the turning point with ≥1.5x average volume?
[ ] Layer 3 — Divergence: Is there RSI, MACD, or OBV divergence on the same or higher timeframe? (Bonus: multi-indicator divergence)
[ ] Context: Is the reversal occurring at a key S/R level, Order Block, or Fibonacci level?
[ ] Risk: Is my stop-loss placed beyond the structure invalidation point? Is my position size ≤ 50% of my standard size?
[ ] Trend strength: Is ADX below 40? (If ADX > 40, the trend is too strong for reversal trading)
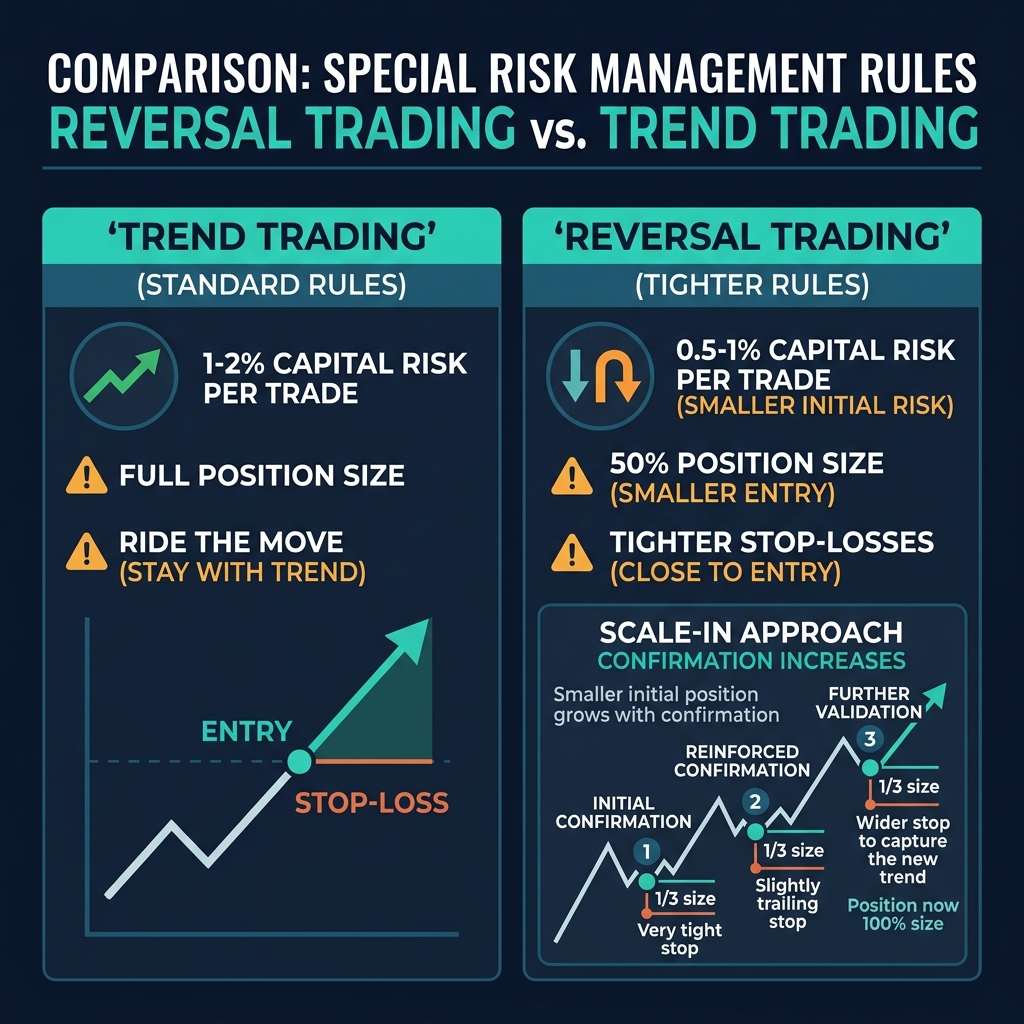
Reversal Trading Risk Management — Different From Trend Trading
Reversal trading carries higher risk than trend-following because you're positioning against the prevailing momentum. Your risk management must reflect this reality. For the complete risk management framework, see the crypto risk management guide.
4 Rules for Reversal-Specific Risk
Rule 1: Cut Your Position Size in Half
Standard trend-following trades: risk 1-2% of account per trade. Reversal trades: risk 0.5-1% maximum.
Standard trend trade position sizing:
  Account: $10,000 | Risk: 1% = $100

Reversal trade position sizing:
  Account: $10,000 | Risk: 0.5% = $50

With BTC entry at $105,000 and SL at $107,000:
  Risk per unit: $2,000
  Standard size: $100 / $2,000 = 0.05 BTC
  Reversal size: $50 / $2,000 = 0.025 BTC ← Half the exposure
Why: Reversal trades have a higher failure rate than trend trades. Even with all 3 layers confirmed, you're fighting inertia. Smaller position sizes ensure a failed reversal doesn't damage your account disproportionately.
Rule 2: Use Tighter Stops
Place your stop-loss just beyond the structural invalidation point — typically the swing high (for bearish reversals) or swing low (for bullish reversals) that defined the CHoCH.
For a bearish reversal: Stop above the most recent Lower High (the one that confirmed the CHoCH). If price reclaims that level, the bearish reversal thesis is invalid.
For a bullish reversal: Stop below the most recent Higher Low. If price breaks that level, the bullish reversal hasn't confirmed.
Use ATR to add a buffer: stop = invalidation level + (0.5 × ATR) to avoid getting stopped by normal volatility wicks.
Rule 3: Scale In, Don't Go All-In
Instead of entering your full position at one price, split it into 2-3 entries:
Entry
When
Size
Entry 1 (scout)
At CHoCH confirmation
30% of total position
Entry 2 (confirmation)
At confirming BOS + candlestick pattern
40% of total position
Entry 3 (momentum)
At first pullback after reversal confirms
30% of total position
Advantage: If the CHoCH fails (40% of the time), you only lose 30% of your intended position, not 100%. If it confirms, you build into the trade with increasing conviction.
Rule 4: Wait for Confirmation — Never Predict
The most expensive word in reversal trading is "looks like." It looks like BTC is topping. It looks like ETH is bottoming. Looking is not the same as confirming.
The discipline: Enter only after your checklist is complete. If Layer 1 fires but Layers 2 and 3 haven't, wait. If all three layers never confirm, there's no trade — and that's a good outcome. The trade you don't take can't lose money.
2 Complete Reversal Trade Setups — 2026 Examples
Setup 1: Bullish Reversal at Market Bottom — ETH at $2,380
Date: April 8-12, 2026
Asset: ETH/USDT
Timeframe: 4H chart (Daily for structure context)
Layer 1: Price Structure Shift ✔
ETH had been in a downtrend from March 20 to April 8, producing lower highs ($2,850 → $2,720 → $2,580) and lower lows ($2,650 → $2,520 → $2,380). On April 9, ETH rallied from $2,380 and broke above $2,580 — the most recent lower high.
Verdict: Bullish CHoCH confirmed at $2,580. The sequence of lower highs was broken.
Layer 2: Candlestick Confirmation ✔
At the $2,380 low, ETH printed a bullish engulfing on the 4H chart. The prior red candle had a body of $28 ($2,408 → $2,380). The engulfing green candle had a body of $72 ($2,380 → $2,452) — 2.6x larger. Volume on the engulfing candle was 1.8x the 20-period average.
Verdict: High-conviction reversal candle at the structural turning point.
Layer 3: Indicator Divergence ✔
RSI(14): At the $2,520 low, RSI was 24. At the $2,380 low (lower price), RSI was 29 — Higher Low. Bullish regular divergence confirmed.
MACD histogram: Histogram bars were shrinking on each new low — momentum was decelerating.
OBV: OBV made a higher low at $2,380 vs $2,520 — accumulation into weakness.
All 3 layers confirmed — entering the bullish reversal:

Entry 1 (scout): $2,460 after the bullish engulfing closed
  Size: 30% → 3.0 ETH

Entry 2 (confirmation): $2,500 after CHoCH break above $2,580 retested
  Size: 40% → 4.0 ETH

Entry 3 (momentum): $2,520 on first 4H pullback after reversal confirmed
  Size: 30% → 3.0 ETH

Average entry: $2,496
Total position: 10.0 ETH

Stop-loss: $2,350 (below the $2,380 swing low + ATR buffer)
Risk per unit: $2,496 - $2,350 = $146
Total risk: 10.0 × $146 = $1,460

Target 1: $2,720 (previous lower high — now resistance)
Target 2: $2,850 (prior structure high)

R:R to Target 1: ($2,720 - $2,496) / ($2,496 - $2,350) = 1.53:1
R:R to Target 2: ($2,850 - $2,496) / ($2,496 - $2,350) = 2.42:1
Result: ETH rallied to $2,780 over the following 10 days. Target 1 hit (+$224/ETH). Partial profit taken, stop moved to breakeven. The structural reversal from downtrend to uptrend played out as confirmed by all three layers.
Setup 2: Bearish Reversal at Market Top — SOL at $192
Date: May 1-5, 2026
Asset: SOL/USDT
Timeframe: 4H chart (Daily for structure context)
Layer 1: Price Structure Shift ✔
SOL had been in an uptrend from April 10, producing higher highs ($162 → $175 → $192) and higher lows ($155 → $168 → $180). On May 3, SOL dropped from $192 and broke below $180 — the most recent higher low.
Verdict: Bearish CHoCH confirmed at $180. The sequence of higher lows was broken for the first time since April 10.
Layer 2: Candlestick Confirmation ✔
At the $192 high, SOL printed a shooting star on the 4H chart — small body at $191, upper wick reaching $198, minimal lower wick. This was followed by an evening star pattern on the next 3 candles. Volume on the shooting star was 1.6x average.
Verdict: Multiple bearish reversal candles at the structural top.
Layer 3: Indicator Divergence ✔
RSI(14): At the $175 high, RSI was 76. At the $192 high (higher price), RSI was 68 — Lower High. Bearish regular divergence confirmed.
MACD histogram: Histogram peaked at $175 and printed lower bars at $192 — momentum was fading despite higher prices.
OBV: OBV flattened between $175 and $192 — volume was not supporting the rally. Classic distribution signal.
Verdict: Triple-indicator divergence at the top. Smart money was distributing.
Trade Execution
All 3 layers confirmed — entering the bearish reversal:

Entry (short): $179 after CHoCH break below $180 confirmed
  Total position: 55 SOL

Stop-loss: $194 (above the $192 swing high + ATR buffer)
Risk per unit: $194 - $179 = $15
Total risk: 55 × $15 = $825

Target 1: $168 (previous higher low — now support-turned-target)
Target 2: $155 (prior structure low)

R:R to Target 1: ($179 - $168) / ($194 - $179) = 0.73:1 ← Too low as solo target
R:R to Target 2: ($179 - $155) / ($194 - $179) = 1.60:1
Combined (50/50 split): ~1.17:1
Adjustment: With a marginal R:R, this trade required strict management. Moved stop to breakeven after Target 1 was hit.
Result: SOL dropped to $165 over the next 6 days. Target 1 hit at $168 (partial close). Target 2 reached at $165 before a bounce. The bearish reversal played out, but the compressed R:R reinforced that reversal shorts at tops require careful sizing.
When NOT to Trade Reversals
Knowing when to skip a reversal is as important as knowing when to enter. These four scenarios consistently destroy reversal traders:
1. During Strong Trends (ADX > 40)
The Average Directional Index (ADX) measures trend strength. When ADX is above 40, the trend is powerfully directional — and reversal trades get steamrolled.
The data: Reversal setups taken when ADX > 40 have a win rate of approximately 32% — worse than random. The trend is simply too strong for counter-trend trades to work. Wait for ADX to decline below 30 before considering reversals.
Fed announcements, CPI releases, regulatory decisions, ETF rulings — these inject unpredictable volatility that overwhelms technical signals. A perfectly set up 3-layer reversal can get invalidated in minutes by a single headline.
Rule: No reversal entries within 4 hours before or 2 hours after major scheduled events. Check the economic calendar before every trade.
3. In Low-Liquidity Pairs
Altcoins outside the top 50 by market cap often lack the liquidity for reliable reversal patterns. Wide spreads, thin order books, and whale-dominated price action mean candle patterns and divergence readings are unreliable.
Safe list for reversal trading: BTC, ETH, SOL, BNB, XRP, ADA, AVAX, DOGE, LINK, DOT. Beyond this list, reversal signals need extra scrutiny. CoinXSight's Discovery scanner filters by volume and liquidity to help you stay in tradeable territory.
4. Without a Stop-Loss
This is the #1 account killer in reversal trading — and it deserves its own section.
The psychology: You enter a reversal trade. Price moves against you. Instead of taking the stop, you think "it'll come back" — because you believed the reversal was real. You add to the position ("averaging down"). Price keeps going. You're now fighting both the trend AND your own increasing losses. Eventually, you're forced out at the worst possible price — or your account is liquidated.
The fix: Every reversal trade has a predefined stop-loss set before entry. If the stop hits, the thesis was wrong. Accept it. The market doesn't owe you a reversal just because three indicators agreed. Even 70-78% win rate means 22-30% of trades fail. Those failures must be controlled.
Frequently Asked Questions
How do I know if a crypto reversal pattern is real or a fake-out?
Use the 3-layer confirmation system. A real reversal shows (1) a structural shift — CHoCH followed by a confirming BOS, (2) a candlestick reversal pattern at the turning point with above-average volume, and (3) indicator divergence (RSI, MACD, or OBV) confirming momentum exhaustion. If only 1-2 layers are present, the "reversal" is more likely a pullback. CoinXSight's Confluence Score captures this — look for 7+/10 before entering reversal trades.
What is the best timeframe for spotting trend reversals in crypto?
The 4H and Daily charts are the most reliable for crypto reversal patterns. The 4H chart offers enough detail for swing trade entries while filtering out noise. The Daily chart provides the structural context — always check Daily structure before executing a 4H reversal trade. Below 1H, reversal signals are unreliable because market structure breaks and reforms too frequently to be meaningful.
How is reversal trading different from trend following?
Trend following enters in the direction of the prevailing trend and benefits from momentum. Reversal trading enters against the current trend, betting that momentum is exhausting. This means reversal trades carry higher risk: smaller position sizes (50% of normal), tighter stops, and a higher bar for entry confirmation. Trend trades need 1-2 confirmations; reversal trades need all 3 layers to align.
Can I use crypto reversal patterns with leverage?
You can, but with extreme caution. If you use leverage on reversal trades, calculate position size based on the leveraged exposure and halve it again from your standard reversal size. Example: if your standard reversal risk is 0.5% of account, a leveraged reversal trade should risk 0.25%. Leverage amplifies the already-elevated risk of fighting the trend — many blown accounts start with a leveraged reversal trade that "should have worked." For the full framework on leverage, see the leverage trading guide.
Which crypto reversal patterns are most reliable in 2026?
Based on 2026 data across BTC, ETH, and SOL: the combination of a structural CHoCH + bullish/bearish engulfing candle + multi-indicator RSI/MACD divergence produces the highest win rate (72-78% on 4H charts). Among individual candlestick patterns, the morning star/evening star at key support/resistance has the highest standalone reliability (66-68%). Among indicators, triple divergence (RSI + MACD + OBV) outperforms single-indicator divergence by 12-16 percentage points.
Summary
Crypto reversal patterns are among the most profitable — and most dangerous — setups in trading. The difference between consistently profiting from reversals and consistently getting destroyed by them comes down to one word: confirmation.
The 3-layer system in brief:
Layer 1 — Price Structure: Wait for a CHoCH + confirming BOS. Until market structure shifts, it's a pullback, not a reversal.
Layer 2 — Candlestick Pattern: Look for engulfing, hammer/shooting star, or morning/evening star formations at the turning point with above-average volume.
Layer 3 — Indicator Divergence: Confirm with RSI, MACD, or OBV divergence. Multi-indicator divergence provides the highest conviction.
If all 3 layers align → trade it. If only 1-2 layers fire → wait or skip. This single rule eliminates the majority of failed reversal trades.
Reversal-specific risk management is non-negotiable: half your normal position size, tight stops at structural invalidation, scale in rather than going all-in, and never — ever — trade a reversal without a stop-loss.
Master risk management for crypto trading. Learn position sizing formulas, stop-loss strategies, and how CoinXSight's Portfolio module tracks your risk…