AI Crypto Technical Analysis: How Machine Learning Is Changing Trading in 2026
Discover how AI and machine learning are transforming crypto technical analysis — from automated pattern recognition to multi-layer confluence scoring. The complete guide to AI-powered trading in 2026.
MC
Marcus ChenSenior Quantitative Strategist·Jun 2, 2026 · 18 min read · Updated Oct 6
Technical analysis has been the backbone of crypto trading since the earliest Bitcoin charts appeared on forums in 2011. Traders learned to read candlestick patterns, draw trendlines, and interpret indicators like RSI and MACD to find an edge in volatile markets. For years, the process was entirely manual — and it worked, at least for the disciplined few who could spend hours scanning charts and managing their emotions.
But crypto markets in 2026 look nothing like 2011. There are over 20,000 tradable tokens across dozens of exchanges. Markets run 24/7/365. A single whale wallet can move prices 8% in minutes, and a regulatory headline can wipe out a rally before you finish your morning coffee.
The sheer volume of data, the speed of price action, and the complexity of cross-market signals have pushed traditional technical analysis to its breaking point. That's where AI crypto technical analysis comes in — not as a replacement for the human trader, but as an entirely new layer of capability that was simply impossible five years ago.
This guide breaks down exactly how AI-powered crypto analysis works, where it excels, where it falls short, and how you can integrate it into your own trading workflow. Whether you're already using traditional technical analysis or just getting started with the basics, understanding the AI layer is no longer optional — it's becoming the dividing line between traders who keep up and those who fall behind.
What Is AI Technical Analysis?
AI technical analysis is the application of machine learning algorithms and artificial intelligence to the process of reading charts, recognizing patterns, generating trading signals, and managing risk. Instead of a human manually inspecting a candlestick chart and deciding whether an ascending triangle is forming, an AI model can analyze the same chart mathematically — along with thousands of other charts simultaneously — and output a probability-weighted assessment in milliseconds.
At its core, AI-powered crypto analysis does three things that traditional TA cannot:
Process at scale. A human trader can realistically monitor 10–20 charts in a day. An AI system can scan every token on every major exchange across multiple timeframes — continuously.
Eliminate emotional bias. When your portfolio is down 30%, your brain starts seeing bullish patterns that aren't there. AI doesn't have a portfolio. It doesn't have fear or hope. It evaluates data against statistical models, period.
Learn from outcomes. Traditional indicators are static — the RSI formula hasn't changed since J. Welles Wilder published it in 1978. Machine learning models can be retrained on new data, adapting to shifting market conditions and evolving their signal accuracy over time.
But here's the nuance that many AI trading articles miss: AI technical analysis is not a crystal ball. It doesn't predict the future. It quantifies probabilities based on historical patterns and real-time data. The best AI systems don't tell you "BTC will hit $120K next week." They tell you "Based on 47 converging signals, there is a 73% probability of upward continuation over the next 5 days, with a risk/reward ratio of 2.4:1."
That distinction matters enormously. AI augments your judgment — it doesn't replace it.
The 5 Ways AI Changes Technical Analysis
To understand the real impact of automated technical analysis in crypto, let's break down the five specific capabilities that AI brings to the table — and why each one represents a genuine leap beyond what manual analysis can achieve.
1. Automated Pattern Recognition
Chart patterns are the bread and butter of technical analysis. Head and shoulders, double bottoms, ascending triangles, bull flags — these formations have been documented for decades, and they work because they reflect the collective psychology of market participants.
The problem? Finding them is tedious, subjective, and slow.
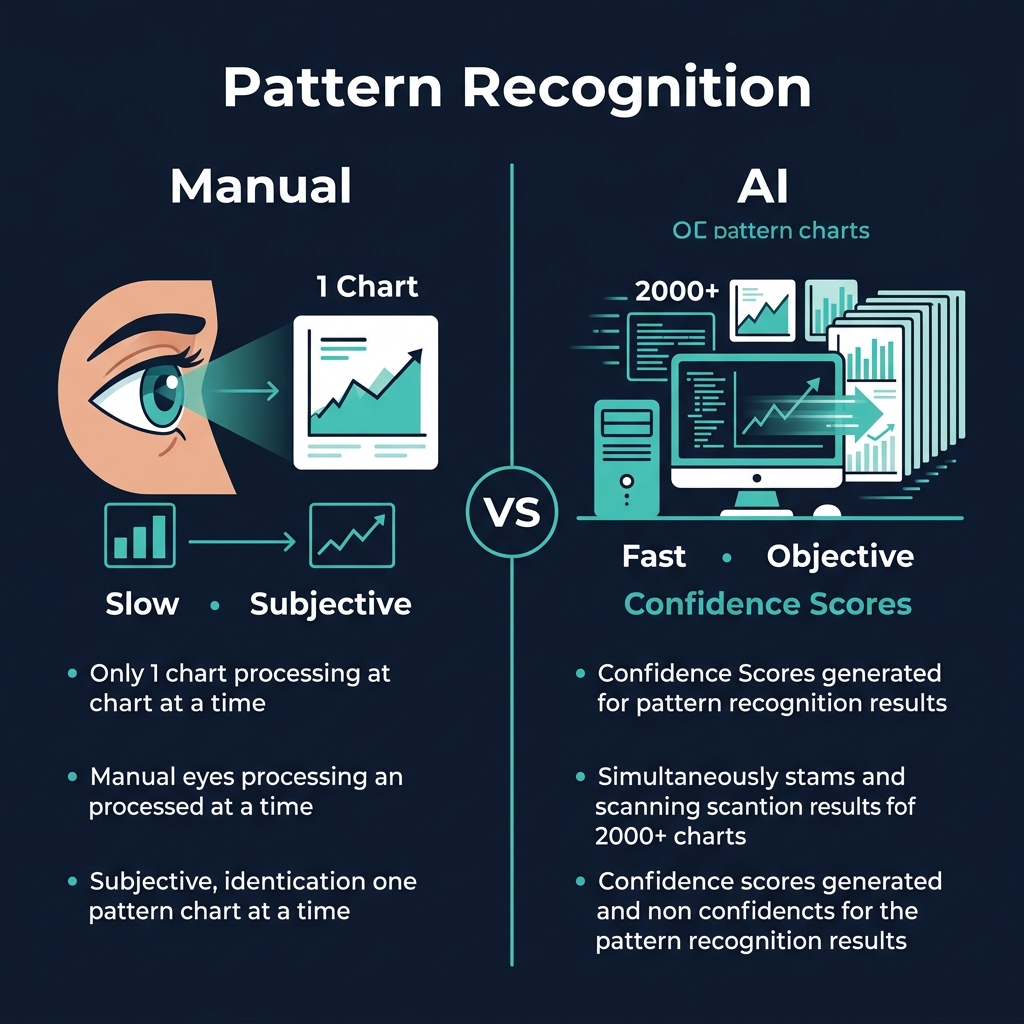
The traditional approach: You open TradingView, load up a chart, zoom to the 4-hour timeframe, and squint at the last 200 candles looking for a recognizable shape. You might find a pattern. You might not. You might see a pattern that isn't really there because you want to find a trade. Then you repeat this process for the next coin, and the next, for as many hours as you can stay focused.
The AI approach: A convolutional neural network trained on hundreds of thousands of labeled chart patterns scans every tradable pair across multiple timeframes simultaneously. When it detects a pattern, it outputs a confidence score (e.g., "Bull flag detected on SOL/USDT 4H — 84% match confidence") along with historical performance data for that pattern in similar market conditions.
The difference isn't just speed — it's coverage. While you're analyzing ETH on the daily chart, an AI pattern scanner might flag a high-probability setup on an altcoin you've never heard of. That's how edge is created.
Every experienced trader knows that a single indicator is unreliable. RSI can stay overbought for weeks in a strong trend. A MACD crossover can generate false signals in choppy markets. Moving average crossovers lag, oscillators oscillate, and volume indicators can be gamed.
That's why professional traders use confluence — the practice of combining multiple indicators and only taking a trade when several signals align. The logic is sound: if RSI, MACD, volume profile, and key support/resistance levels all agree on a direction, the probability of a successful trade increases significantly.
The problem with manual confluence analysis is that it's inherently limited. A human can realistically track 3–5 indicators at once and make a qualitative judgment. An AI system can combine 12 or more indicators into a single, algorithmically weighted composite score — and it can do it for thousands of assets simultaneously.
Here's how a multi-indicator confluence system typically works:
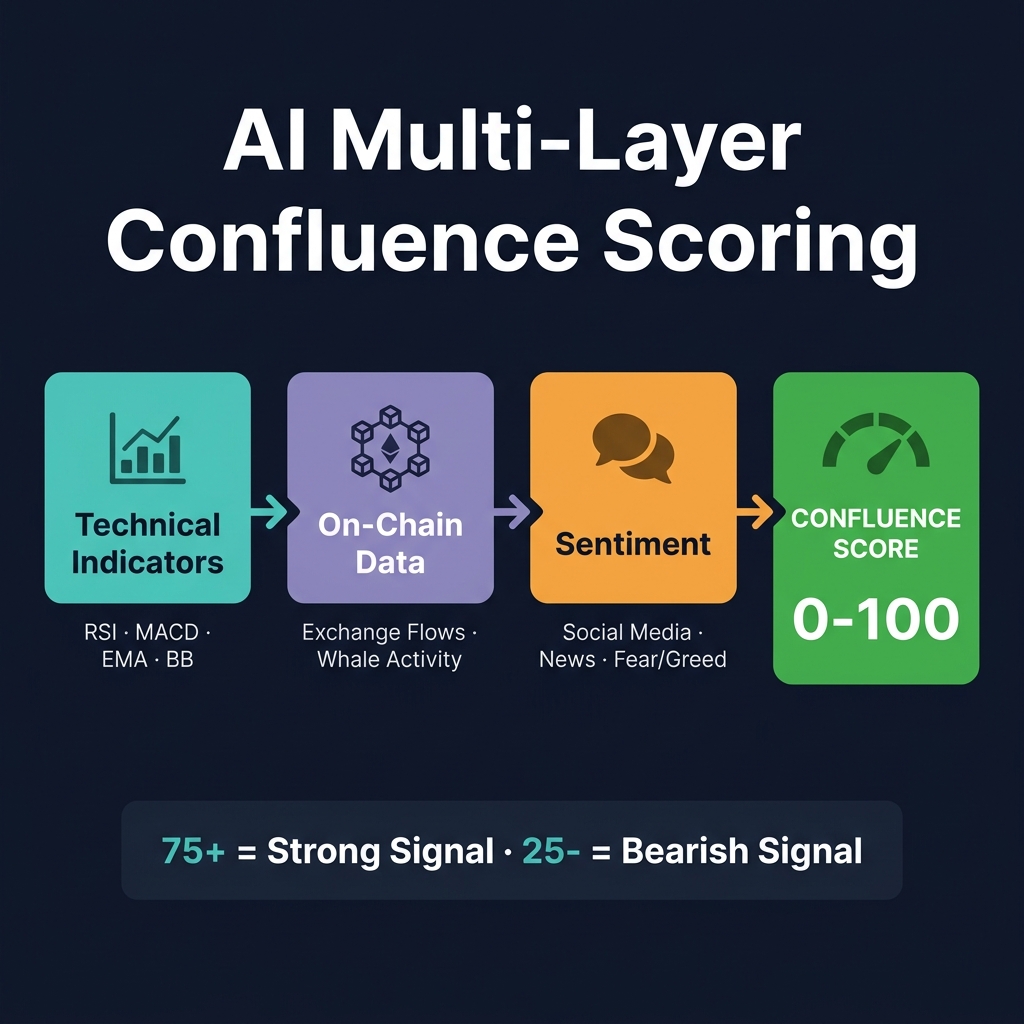
Input layer: The system ingests raw data for each indicator — RSI values, MACD histogram readings, Bollinger Band position, EMA crossovers, volume trends, ADX strength, Stochastic readings, and more. (For a comprehensive overview of these indicators, see our technical analysis indicators guide.)
Weighting layer: Each indicator is assigned a weight based on its historical reliability for the specific asset and timeframe. These weights aren't fixed — they're adjusted dynamically based on current market conditions.
Scoring layer: The weighted signals are combined into a single composite score, typically on a 0–100 scale. A score above 75 might indicate strong bullish confluence; below 25, strong bearish confluence.
Threshold layer: The system applies configurable thresholds to determine when a score is actionable versus noise.
This is the core concept behind CoinXSight's Confluence Scoring System, which combines technical indicators, on-chain data, and sentiment signals into a single actionable score. The idea is simple — the more signals that agree, the higher the probability — but the execution requires computational power that manual analysis can't match.
3. On-Chain + Technical Fusion
This is where AI-powered crypto analysis truly separates itself from anything possible in traditional markets.
Traditional technical analysis uses exactly two data sources: price and volume. That's it. Every candlestick chart, every indicator, every pattern — they all derive from those two inputs. And for stocks, that's mostly fine, because price and volume capture most of the meaningful market activity.
But crypto has an entirely unique data layer that doesn't exist in traditional finance: the blockchain itself. Every transaction, every wallet movement, every exchange deposit and withdrawal is publicly recorded on-chain. This creates a rich dataset that can dramatically improve trading signals when combined with traditional TA.
Here's what on-chain + technical fusion looks like in practice:
Exchange flow analysis: When large amounts of BTC are moved to exchanges, it often signals upcoming selling pressure. An AI system can integrate exchange flow data with technical resistance levels to identify high-probability reversal zones.
Whale tracking: A whale accumulating during a period of low volume and declining prices creates a divergence between surface-level bearish TA signals and bullish on-chain activity. AI can detect and quantify these divergences automatically.
Funding rate integration: In perpetual futures markets, extreme funding rates signal overleveraged positioning. When combined with overbought RSI readings and bearish divergences, the probability of a correction increases substantially.
No human trader can monitor exchange flows for 2,000 tokens, track whale wallet activity across five blockchains, analyze funding rates on three derivatives exchanges, and run technical analysis across multiple timeframes — all at the same time. An AI system can.
This multi-dimensional, multi-source approach is what makes modern AI crypto technical analysis fundamentally different from traditional TA. It's not just faster chart reading — it's an entirely different category of analysis.
4. Adaptive Parameter Optimization
Here's a dirty secret about technical indicators: their default settings are arbitrary.
The RSI uses a 14-period lookback. Why 14? Because Wilder chose it in 1978 and it stuck. The standard MACD uses 12/26/9 settings. The 200-day moving average is considered "the" long-term trend indicator. These parameters work reasonably well across many conditions, but they're static compromises — averages that aren't optimal for any specific situation.
Different market regimes call for different parameters:
In a high-volatility breakout: A shorter RSI period (7–10) captures momentum shifts faster, but generates more noise in ranging markets.
In a low-volatility accumulation phase: Longer periods smooth out the chop and prevent false signals, but miss the initial breakout move.
In a trending market: The 50 EMA might act as dynamic support. In a ranging market, that same EMA is meaningless noise.
AI models can solve this through adaptive parameter optimization — automatically adjusting indicator settings based on the current volatility regime, trend strength, and historical performance. Instead of using RSI-14 for every market condition, an AI system might use RSI-9 during high-volatility periods and RSI-21 during consolidation, switching dynamically based on real-time ATR (Average True Range) readings.
This isn't just theoretical. Backtesting consistently shows that adaptive parameters outperform static defaults by 15–30% in risk-adjusted returns, depending on the asset and timeframe. The challenge is that optimizing parameters manually is impractical — you'd need to backtest thousands of parameter combinations across multiple market regimes. That's precisely what machine learning excels at.
5. Real-Time Anomaly Detection
Markets give off signals before major moves — but these signals are often subtle and easily missed by human observers.
Anomaly detection is the AI capability of identifying data points that deviate significantly from expected patterns. In crypto trading, this might include:
Volume anomalies: A sudden 500% spike in trading volume on a mid-cap token with no news catalyst. This often precedes major price movement — either a breakout or a dump.
Order book anomalies: Large hidden orders (icebergs) appearing at specific price levels, suggesting institutional accumulation or distribution.
Cross-market anomalies: One exchange showing significantly different pricing than others, indicating potential manipulation or imminent arbitrage-driven moves.
Divergence anomalies: Price making new highs while multiple internal indicators (RSI, OBV, CMF) simultaneously diverge — a pattern that frequently precedes reversals but is easy to miss when monitoring manually.
AI anomaly detection systems use statistical models to establish a "normal" baseline for each metric, then flag deviations that exceed configurable thresholds. The key advantage is speed: an AI system can detect an anomaly within seconds of it occurring, while a human trader might not notice until the move is already underway.
CoinXSight's Alpha Hunter Signals leverage this type of anomaly detection to surface unusual market activity across thousands of tokens in real time, giving traders early awareness of developing opportunities.
AI TA vs Traditional TA: Side-by-Side Comparison
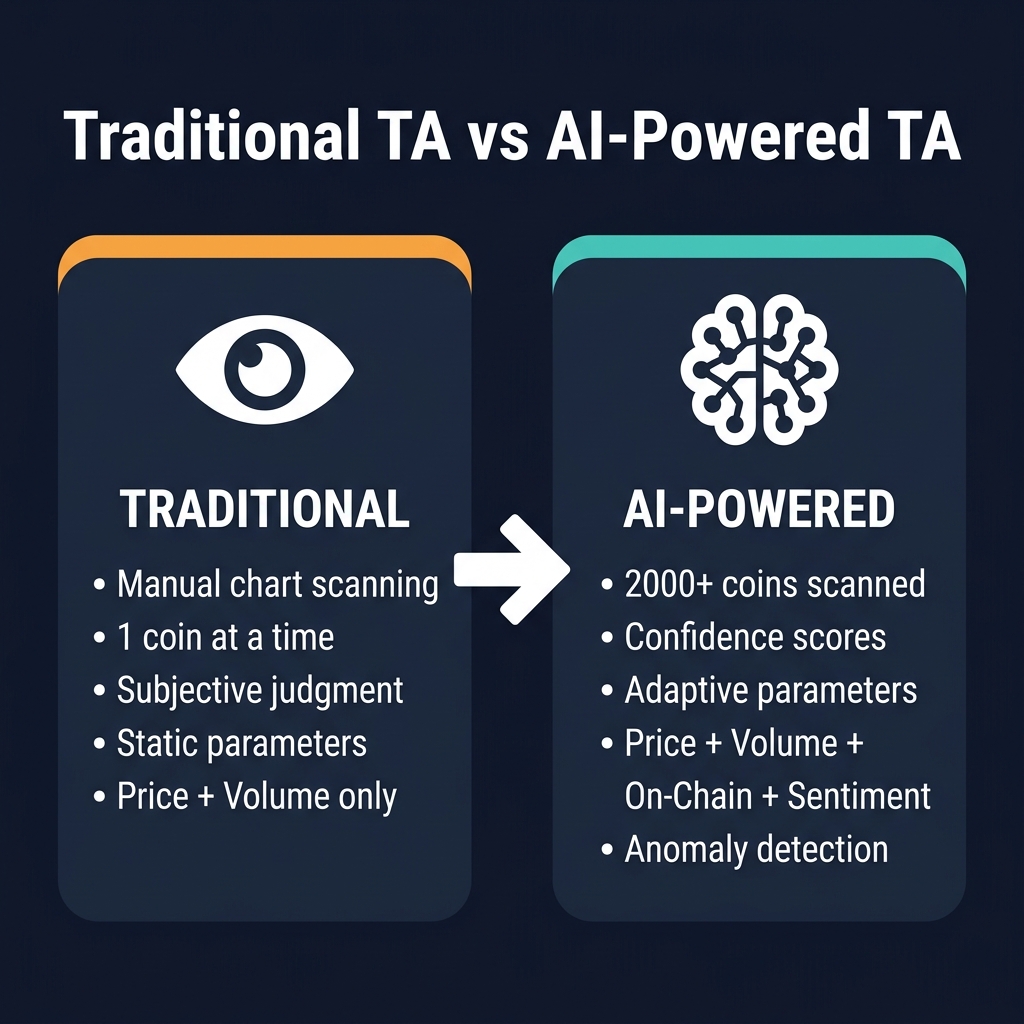
To make the differences concrete, here's an honest side-by-side comparison of AI-powered crypto analysis versus traditional manual technical analysis:
Dimension
Traditional TA
AI-Powered TA
Speed
Minutes to hours per chart
Milliseconds per chart
Scale
10–20 assets realistically
2,000+ assets simultaneously
Objectivity
Subject to cognitive biases (confirmation bias, anchoring, loss aversion)
Statistically objective, bias-free
Adaptability
Fixed parameters, manual adjustment
Dynamic parameter optimization based on regime
Explainability
High — you know exactly why you took a trade
Varies — some models are black boxes
Data Sources
Price + volume only
Price, volume, on-chain, sentiment, funding rates
Cost
Free (your time)
Subscription/infrastructure costs
Edge in Trending Markets
Strong — traditional patterns work well
Strong — AI adds speed and scale
Edge in Choppy Markets
Weak — many false signals
Moderate — better filtering but not immune
Black Swan Protection
None
None — AI can't predict unpredictable events
The honest assessment: AI dominates on speed, scale, and objectivity. Traditional TA wins on explainability and cost. Neither can predict black swan events. The optimal approach — which we'll discuss later — combines both.
Types of AI Models Used in Crypto TA
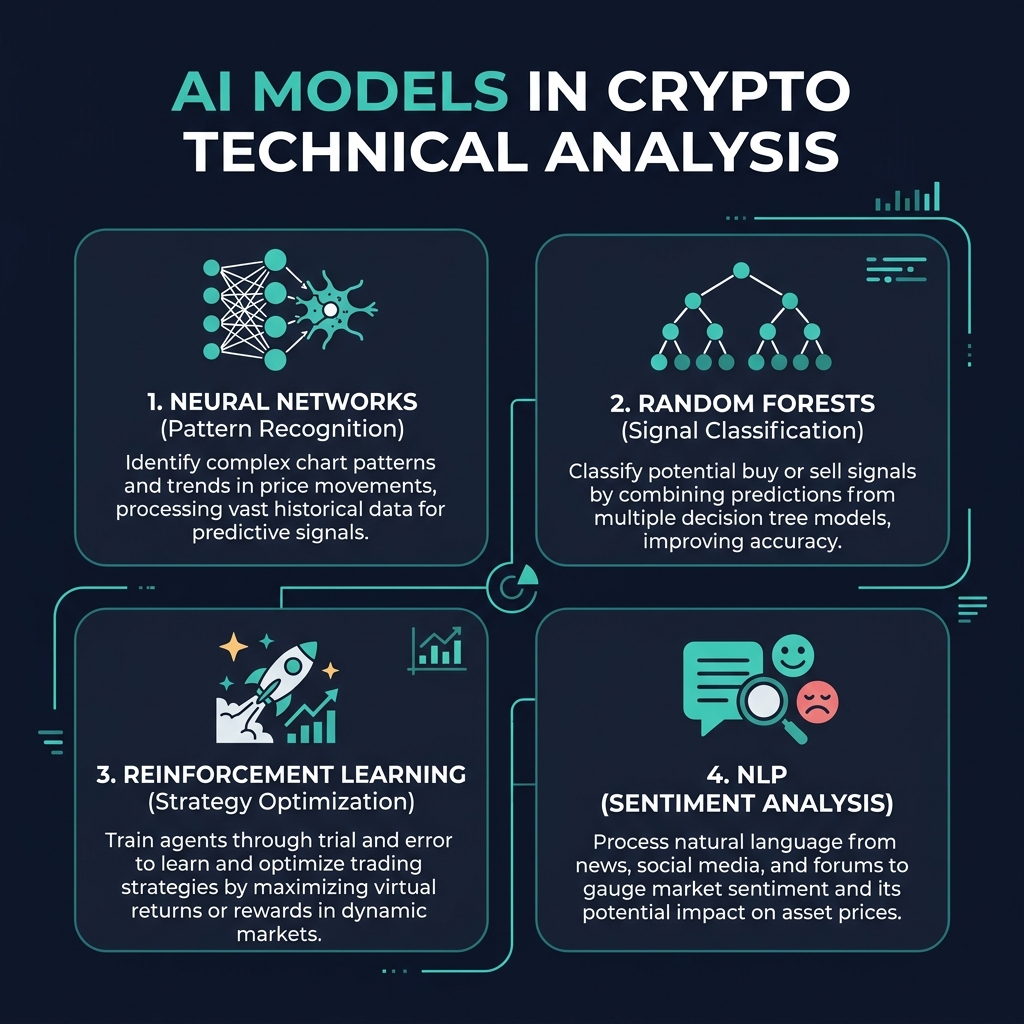
Not all AI is created equal. Different machine learning architectures excel at different aspects of technical analysis. Here's a practical overview of the four main model types you'll encounter in AI crypto trading indicators and platforms.
Neural Networks for Pattern Recognition
What they do: Neural networks, particularly Convolutional Neural Networks (CNNs) and Recurrent Neural Networks (RNNs/LSTMs), are the workhorses of AI pattern recognition. CNNs — originally designed for image recognition — can be trained on candlestick chart images to identify visual patterns with remarkable accuracy. LSTMs, designed for sequential data, excel at learning temporal patterns in price series.
Where they shine: Detecting complex chart patterns (head and shoulders, wedges, flags), identifying support/resistance zones from historical price action, and generating price predictions based on sequential pattern matching.
Limitation: Neural networks are notoriously opaque. A CNN might correctly identify a head and shoulders pattern with 89% accuracy, but it can't explain why in human-readable terms. This "black box" problem is a real concern for traders who want to understand the reasoning behind their signals.
What they do: Random forests are ensemble models that combine hundreds of decision trees to classify market conditions. Each tree makes a prediction based on a different subset of features, and the forest aggregates their votes. The result is a robust, noise-resistant classification system.
Where they shine: Classifying market regime (trending vs. ranging vs. breakout), determining signal quality (high-confidence vs. low-confidence setups), and filtering false signals from multiple indicators. Random forests handle noisy data well, which makes them particularly suited for crypto's volatile price action.
Limitation: Random forests are less effective at capturing complex temporal dependencies. They work with features at a single point in time rather than learning from sequences, so they're typically used as classifiers layered on top of other feature-extraction systems.
Reinforcement Learning for Strategy Optimization
What they do: Reinforcement learning (RL) agents learn to trade by interacting with a simulated market environment, receiving rewards for profitable decisions and penalties for losses. Over millions of simulated trades, they develop strategies that optimize for a defined objective function (e.g., maximizing Sharpe ratio, minimizing drawdown).
Where they shine: Developing position sizing strategies, optimizing entry/exit timing, and adapting to changing market conditions. RL is particularly powerful for backtesting and optimizing complete trading strategies rather than individual signals.
Limitation: RL agents are prone to overfitting on historical data. A strategy that performs brilliantly in backtesting may fail in live markets because the agent learned to exploit specific historical patterns that don't repeat. Robust out-of-sample testing and walk-forward analysis are essential.
NLP for Sentiment Analysis Integration
What they do: Natural Language Processing models analyze text data — news articles, social media posts, forum discussions, regulatory announcements — and extract sentiment scores that can be integrated with technical signals. Modern transformer-based models (like those in the GPT and BERT families) can understand context, sarcasm, and nuance far better than older keyword-based approaches.
Where they shine: Providing early warning of sentiment shifts that precede price movements, identifying narrative-driven momentum (meme coins, hype cycles), and quantifying the "fear and greed" dimension that technical indicators alone can't capture.
Limitation: Crypto social media is heavily manipulated. Bots, paid shills, and coordinated FUD campaigns can distort sentiment signals. Effective NLP systems need robust spam filtering and source credibility weighting to avoid being gamed.
How to Evaluate an AI Trading Tool (Buyer's Guide)
The AI crypto trading space is flooded with platforms making bold claims. "95% win rate!" "AI-powered alpha!" "Never lose again!" Most of these claims don't survive contact with reality. Here's how to separate legitimate AI trading tools from marketing hype.
1. Backtested Performance vs. Live Performance
Red flag: A platform shows stunning backtested returns but no live track record.
What to look for: Live, auditable performance data over at least 6–12 months, covering both bull and bear market conditions. Any system can be curve-fitted to look incredible on historical data. The question is whether it performs in real-time, on unseen data. If you want to understand why this distinction matters, our backtesting methodology guide explains the common pitfalls in detail.
2. Transparency and Explainability
Red flag: "Our proprietary AI algorithm" with no explanation of methodology.
What to look for: Can you see why the system generates a specific signal? Does it show which indicators are contributing to the score? Transparency isn't just about trust — it's about utility. If you don't understand why a signal was generated, you can't assess whether to follow it or override it.
CoinXSight's ASI Score, for example, breaks down its composite assessment into contributing factors, so traders can see exactly which technical, on-chain, and sentiment signals are driving the overall score.
3. Data Sources
Red flag: An AI system that only uses price and volume data.
What to look for: Multi-layer data integration — technical indicators, on-chain metrics, sentiment data, funding rates, and exchange flows. As we discussed earlier, the fusion of on-chain and technical data is one of the most powerful advantages of AI-powered analysis. A system that ignores this is leaving significant alpha on the table.
4. False Positive Rate
Red flag: No mention of false positive rates or signal accuracy metrics.
What to look for: Every signal system generates false positives. The question is how many, and how the system handles them. A system that generates 100 signals a day with a 30% accuracy rate is worse than useless — it's expensive noise. Look for platforms that prioritize signal quality over signal quantity and publish their accuracy metrics honestly.
5. Customizability
Red flag: One-size-fits-all signals with no ability to adjust parameters.
What to look for: Can you adjust risk tolerance, timeframe preferences, asset focus, and signal sensitivity? Different traders have different styles — a day trader and a swing trader need fundamentally different signal configurations. The best AI tools let you configure the system to match your approach.
The Human + AI Framework: How to Use AI TA Effectively
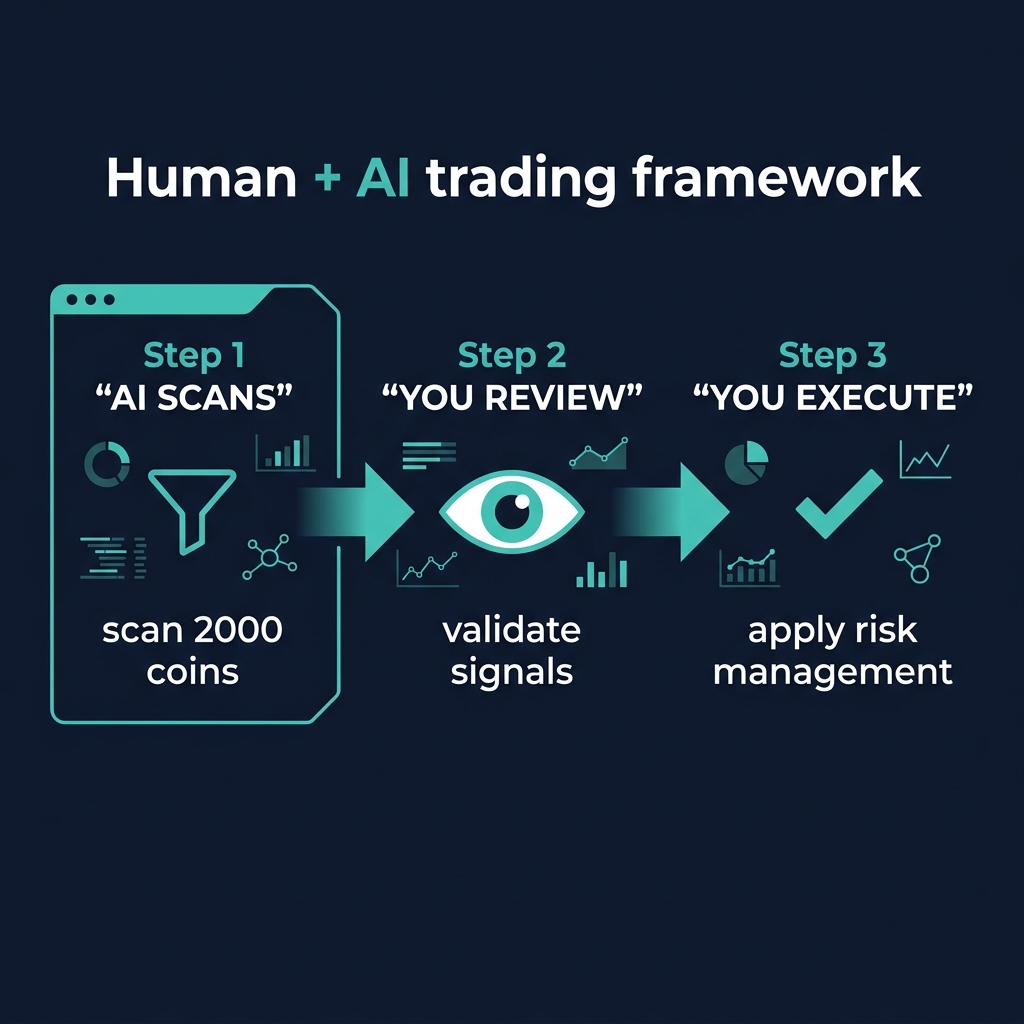
Here's the framework that separates traders who profit from AI tools from those who lose money trusting them blindly. It's a three-step process that leverages AI's strengths while preserving human judgment where it matters most.
Step 1: Let AI Scan for Opportunities (Filter)
Use AI as your first-pass filter. Let the system scan thousands of assets across multiple timeframes and surface the ones that show high-probability setups. This is where AI's speed and scale advantage is most valuable.
In practice: Configure your AI tool to alert you when a composite confluence score crosses a threshold — say, above 75 for bullish setups or below 25 for bearish setups. Also set up anomaly alerts for unusual volume or on-chain activity. This narrows your universe from 2,000+ tokens to maybe 5–15 actionable candidates each day.
An AI trading copilot approach works exceptionally well here — the AI handles the exhausting work of scanning and filtering, while you focus your energy on the highest-quality opportunities.
Step 2: Review AI Signals With Your Own TA Knowledge (Validate)
This is where your human expertise becomes critical. For each opportunity the AI surfaces, open the chart and validate the signal with your own analysis.
Ask yourself:
Does the pattern make sense in the broader market context?
Is there a clear narrative or catalyst supporting this move?
Are there obvious risks the AI might not be capturing (upcoming token unlock, regulatory news, correlation with BTC)?
Does this setup align with your trading plan and risk tolerance?
Your technical analysis knowledge isn't obsolete — it's the validation layer that separates profitable AI-assisted trading from blind signal following. If an AI says "bullish" but your analysis of the macro environment says "risk-off," your judgment should prevail.
Step 3: Apply Your Risk Management (Execute)
AI can identify opportunities, but position sizing, stop-loss placement, and portfolio-level risk management should remain under your control.
Key principles:
Never risk more than 1–2% of your portfolio on a single AI-generated signal.
Set stop-losses based on technical invalidation levels, not arbitrary percentages.
Track your AI-assisted trades separately to measure whether the system is actually adding value.
Regularly review and adjust your AI tool's settings based on performance data.
For a comprehensive risk framework, see our crypto risk management guide. AI can also assist with risk management itself — our guide on AI risk management in crypto explores how machine learning can optimize position sizing and portfolio allocation.
The bottom line: AI is the scanner, you are the decision-maker. This division of labor plays to each side's strengths and mitigates each side's weaknesses.
Limitations of AI in Crypto Trading (Honest Assessment)
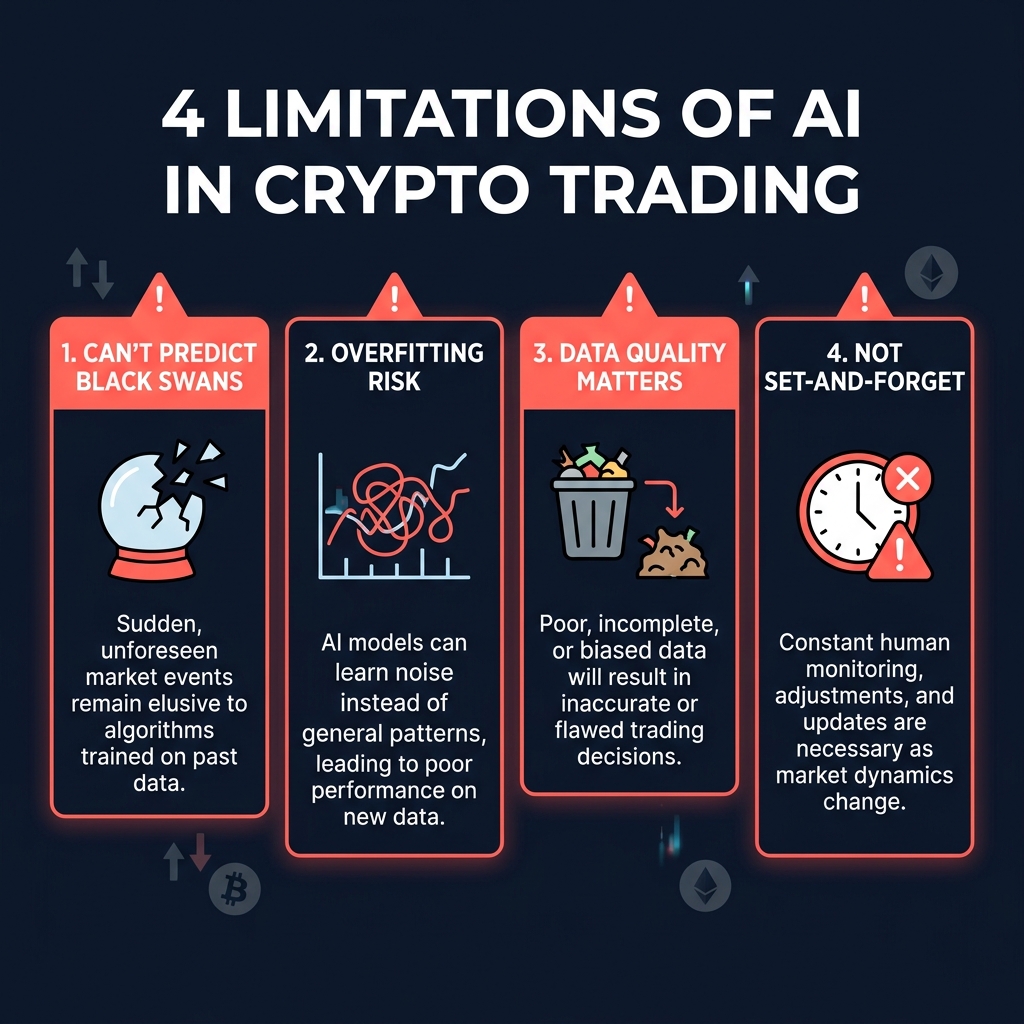
No responsible guide on AI crypto technical analysis would be complete without an honest discussion of what AI cannot do. The limitations are real, and ignoring them is how traders lose money.
AI Can't Predict Black Swan Events
A regulatory crackdown, an exchange hack, a stablecoin depeg, a protocol exploit — these events are, by definition, unpredictable from historical data. No AI model, no matter how sophisticated, can predict a black swan event because there's no pattern to learn from. When Terra collapsed in 2022, even the most advanced AI systems were blindsided alongside every human trader.
Implication: Always maintain risk management practices (position sizing, stop-losses, portfolio diversification) regardless of how confident an AI signal appears. No signal is a certainty.
Overfitting Is the Silent Killer
Overfitting occurs when a model learns the noise in historical data rather than the signal. An overfitted model produces spectacular backtesting results and terrible live performance. This is the single most common failure mode in algorithmic trading, and it's especially dangerous in crypto because:
Historical data is limited (most altcoins have less than 5 years of data).
Market regimes shift dramatically (2021 bull market dynamics are completely different from 2023 bear market dynamics).
Survivorship bias distorts historical datasets (you can't backtest on tokens that went to zero and were delisted).
Implication: Never trust backtested results alone. Demand walk-forward analysis, out-of-sample testing, and ideally live performance data before trusting an AI system with real capital.
Garbage In, Garbage Out
AI models are only as good as their data. If an exchange is reporting inflated volume (wash trading), if on-chain data is being manipulated through self-transfers, or if sentiment data is polluted by bot activity, the AI's outputs will be corrupted.
Implication: Data quality is a critical differentiator between AI platforms. Ask what data sources a platform uses, how they validate data integrity, and how they handle known issues like wash trading in volume data.
AI Is Not "Set and Forget"
Some traders buy an AI tool expecting to turn it on and print money. This never works. Markets evolve, models degrade, and what worked last quarter may not work next quarter.
Implication: Treat AI tools as instruments that require calibration, monitoring, and periodic adjustment — not as autonomous money-making machines. The best results come from traders who actively engage with their AI tools, understand their signals, and adapt their usage over time.
The Explainability Trade-Off
The most powerful AI models (deep neural networks) are often the least explainable. Simpler models (linear regression, decision trees) are more transparent but less capable. This creates a genuine tension: do you want a model that's more accurate but you can't understand, or a model that's less accurate but fully transparent?
Implication: For most traders, a moderate approach works best — models that provide composite scores with breakdowns of contributing factors, rather than pure black-box outputs or oversimplified transparent models.
FAQ
Is AI technical analysis better than traditional technical analysis?
AI technical analysis isn't inherently "better" — it's different. AI excels at speed, scale, and multi-source data integration, processing thousands of assets simultaneously with zero emotional bias. Traditional TA excels at contextual judgment, narrative understanding, and explainability. The most effective approach in 2026 combines both: using AI to scan and filter opportunities, then applying human TA knowledge to validate and execute. Think of AI as a powerful amplifier for your existing trading skills, not a replacement.
Can AI predict crypto prices accurately?
No AI system can predict crypto prices with certainty. What AI can do is quantify probabilities — e.g., "Based on current confluence signals, there is a 72% probability of upward continuation over the next 48 hours." That probabilistic framing is useful for decision-making and risk management, but it's fundamentally different from prediction. Any platform claiming "accurate price prediction" is overstating its capabilities. For a realistic assessment of what's possible, see our guide on machine learning price prediction.
How much does AI trading software cost?
AI crypto trading tools range from free (basic alerts and simple screeners) to $50–$500+/month for professional-grade platforms with multi-layer analysis, real-time signals, and portfolio-level risk management. The cost is typically justified if the tool demonstrably improves your win rate or risk-adjusted returns. Before subscribing to any platform, review our evaluation criteria above and demand live performance data, not just marketing claims. Our best AI trading tools guide compares current options across price points.
Do I need programming skills to use AI trading tools?
No. Modern AI crypto trading platforms are designed for traders, not developers. Most offer visual dashboards, configurable alerts, and plain-language signal explanations. You don't need to understand how a neural network works internally — you need to understand how to interpret its outputs and integrate them into your trading workflow. That said, traders with basic data literacy (understanding probability, statistical significance, and backtesting principles) will extract significantly more value from AI tools than those who treat them as black boxes.
What data does AI use for crypto technical analysis?
The best AI crypto technical analysis systems use multi-layer data: technical data (price, volume, indicators like RSI, MACD, Bollinger Bands, and moving averages), on-chain data (exchange flows, whale movements, active addresses, transaction volumes), derivatives data (funding rates, open interest, liquidation levels), and sentiment data (social media analysis, news sentiment, fear/greed indices). This multi-dimensional approach is a fundamental advantage over traditional TA, which relies solely on price and volume. CoinXSight's ASI Score is an example of a system that integrates all four data layers into a single composite assessment.
Can AI replace human traders entirely?
Not in 2026, and likely not for a long time. AI can automate pattern recognition, indicator analysis, and opportunity scanning — but it can't understand macro narratives, assess regulatory risk, evaluate team quality for fundamental analysis, or make judgment calls in unprecedented market conditions. The crypto market is also adversarial: as AI trading becomes more common, markets adapt, and strategies that worked when few used AI may stop working when everyone does. Human oversight, creative thinking, and adaptive judgment remain essential. The winning formula is human + AI collaboration, not full automation.
How do I know if an AI trading signal is reliable?
Evaluate reliability across multiple dimensions: confluence strength (how many independent indicators agree), historical accuracy (what percentage of similar signals have been profitable in the past), market context (does the signal align with the broader trend and macro environment), and risk/reward ratio (is the potential upside worth the defined downside). Never act on a single signal in isolation. Use the three-step framework outlined in this guide: let AI filter, validate with your own analysis, and execute with disciplined risk management. Tracking your results over time is the only way to know whether a specific AI tool is genuinely adding value to your trading.
AI crypto technical analysis isn't the future — it's the present. The traders who learn to integrate AI tools effectively today will have a compounding advantage over those who dismiss the technology or rely on it blindly. Start with the fundamentals of technical analysis, understand the AI layer through guides like this one, and build a workflow that leverages the best of both human judgment and machine intelligence.
Ready to Elevate Your Trading with AI?
Don't spend hours manually scanning charts. Let CoinXSight's machine learning models do the heavy lifting for you. Track over 2,000+ altcoins with automated pattern recognition, on-chain exchange flows, and real-time AI Confluence Scores.
[!WARNING]
Financial Disclaimer: Trading cryptocurrencies involves substantial risk and may not be suitable for every investor. The high volatility of crypto assets can result in significant financial losses. The information provided in this guide is for educational purposes only and does not constitute financial, investment, or trading advice. Always conduct your own research, practice proper risk management, and consult with a licensed financial advisor before making any investment decisions.
About the Author
Sarah Mitchell is a Technical Analysis Specialist at CoinXSight, focusing on combining traditional chart patterns with modern on-chain metrics and machine learning algorithms. With over seven years of active trading experience, she specializes in swing trading strategies and trend-following frameworks. Connect with her on LinkedIn or follow her latest market updates on Twitter/X.