Backtesting Crypto Strategies: The Complete Methodology Guide
Learn the science behind backtesting — from data preparation and walk-forward analysis to Monte Carlo simulations. Build strategies that survive live markets, not just historical data.
MC
Marcus ChenSenior Quantitative Strategist·May 20, 2026 · 16 min read · Updated Oct 6
Here's an uncomfortable truth: most backtest results you see online are garbage.
Not because the math is wrong — the math is usually perfect. The problem is that traders unknowingly commit a series of methodological sins that make historical results completely disconnected from future performance.
This guide teaches you the science of backtesting — the same methodology used by quantitative hedge funds to validate strategies before deploying billions of dollars. Whether you're testing a simple EMA crossover or CoinXSight's AI-powered confluence signals, these principles determine whether your strategy survives contact with live markets.
The Backtesting Pipeline: 6 Stages
A professional backtest isn't just "run the numbers." It's a structured pipeline with quality gates at each stage.
Stage 1: Hypothesis Formation
Every backtest starts with a tradeable hypothesis — not random parameter exploration.
Bad approach: "Let me try every RSI period from 5 to 50 and every EMA from 10 to 200 until something looks profitable."
Good approach: "I observe that BTC tends to bounce from the VWAP after liquidation cascades. I hypothesize that buying within 2% of VWAP after a >5% wick, with RSI below 35, produces positive expectancy."
The difference is crucial. The first approach guarantees finding something that looks profitable by pure chance. The second approach tests a specific market observation that has a logical reason to work.
Stage 2: Data Preparation
The quality of your backtest is only as good as the quality of your data.
Essential Data Checks
Check
Why It Matters
How to Verify
Survivorship bias
Only testing coins that survived = inflated results
Include delisted tokens in your universe
Look-ahead bias
Using future information in current decisions
Ensure every indicator uses only past data
Data gaps
Missing candles during exchange outages
Fill gaps with interpolation or skip periods
Wash trading
Fake volume inflates volume-based indicators
Use aggregated data from multiple exchanges
Time zone alignment
Mixing UTC and local timestamps
Standardize all timestamps to UTC
Minimum Data Requirements
For trend-following strategies: Minimum 200 candles of data (200 daily candles = ~10 months)
For mean-reversion strategies: Minimum 500 candles (need sufficient cycles)
For intraday strategies: Minimum 2,000 candles on your target timeframe
For statistical significance: Your strategy should generate at least 30 trades in the test period
Stage 3: Strategy Logic Implementation
Translate your hypothesis into precise, unambiguous rules.
The Entry/Exit Specification
Every strategy needs these 6 components fully defined:
┌─────────────────────────────────────────────┐
│           STRATEGY SPECIFICATION            │
├─────────────────────────────────────────────┤
│ 1. ENTRY CONDITION                          │
│    What exact conditions trigger a buy?      │
│                                              │
│ 2. EXIT CONDITION                           │
│    What conditions trigger a sell?            │
│                                              │
│ 3. STOP-LOSS                                │
│    Where is the maximum loss cut?            │
│                                              │
│ 4. TAKE-PROFIT                              │
│    Where do you take profits?                │
│                                              │
│ 5. POSITION SIZING                          │
│    How much capital per trade?               │
│                                              │
│ 6. TRADE MANAGEMENT                         │
│    Trailing stops? Partial exits? Re-entries?│
└─────────────────────────────────────────────┘
Critical rule: If you can't express your strategy as code with zero ambiguity, it's not a strategy — it's a vague idea.
Realistic Execution Assumptions
Cost Type
Conservative Estimate
Aggressive Estimate
Maker fee
0.02%
0.10%
Taker fee
0.04%
0.10%
Slippage (BTC/ETH)
0.05%
0.15%
Slippage (altcoins)
0.10%
0.50%
Slippage (meme coins)
0.30%
2.00%
Funding rate (perps)
0.01% per 8h
0.05% per 8h
Always backtest with conservative estimates first. If the strategy works with high costs, it definitely works with lower costs.
Stage 4: In-Sample Optimization
This is where you calibrate your parameters — but with discipline.
The Optimization Trap
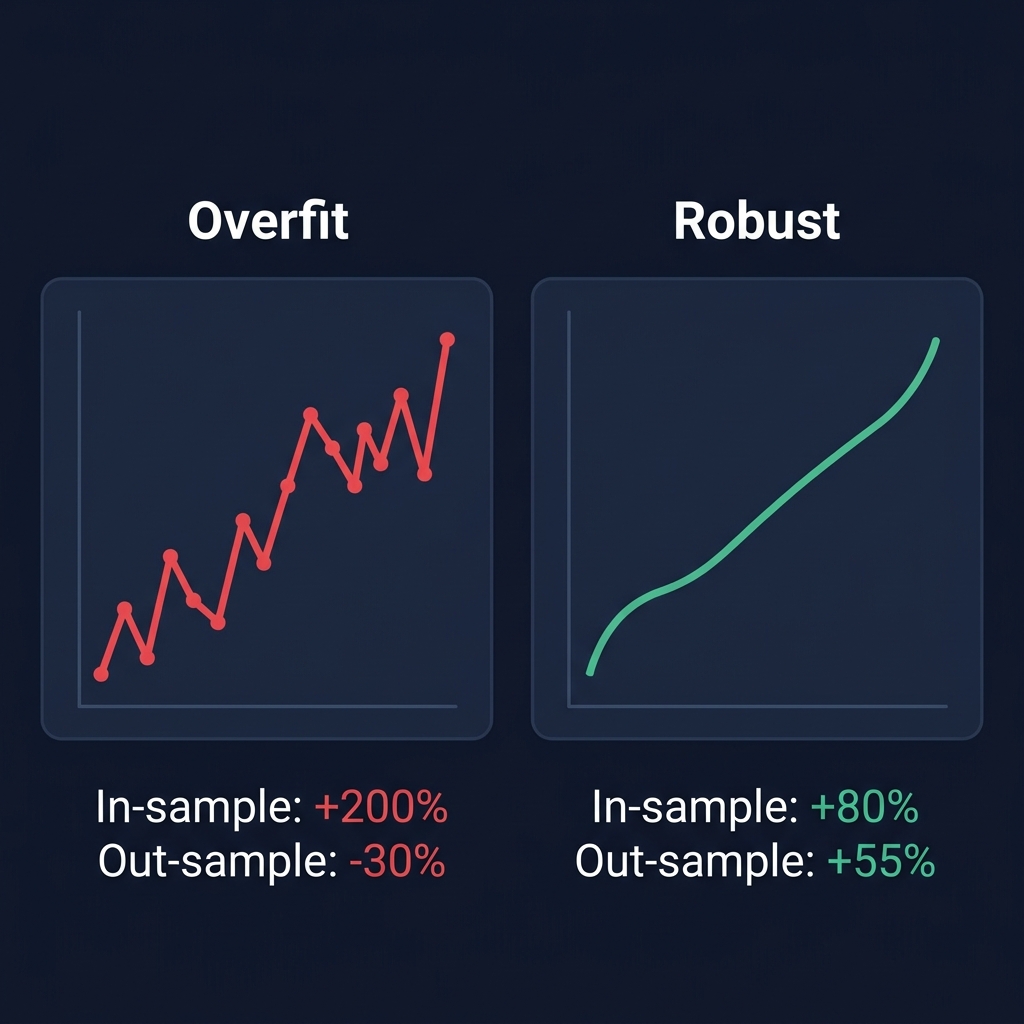
Imagine you have a simple EMA crossover strategy with 2 parameters: fast EMA period and slow EMA period. If you test every combination from 5-50 for both, that's 2,025 combinations. By pure random chance, some of them will look amazing on your historical data. This is not alpha — it's noise mining.
Rules for Safe Optimization
Limit free parameters to ≤ 3. Every additional parameter exponentially increases overfitting risk.
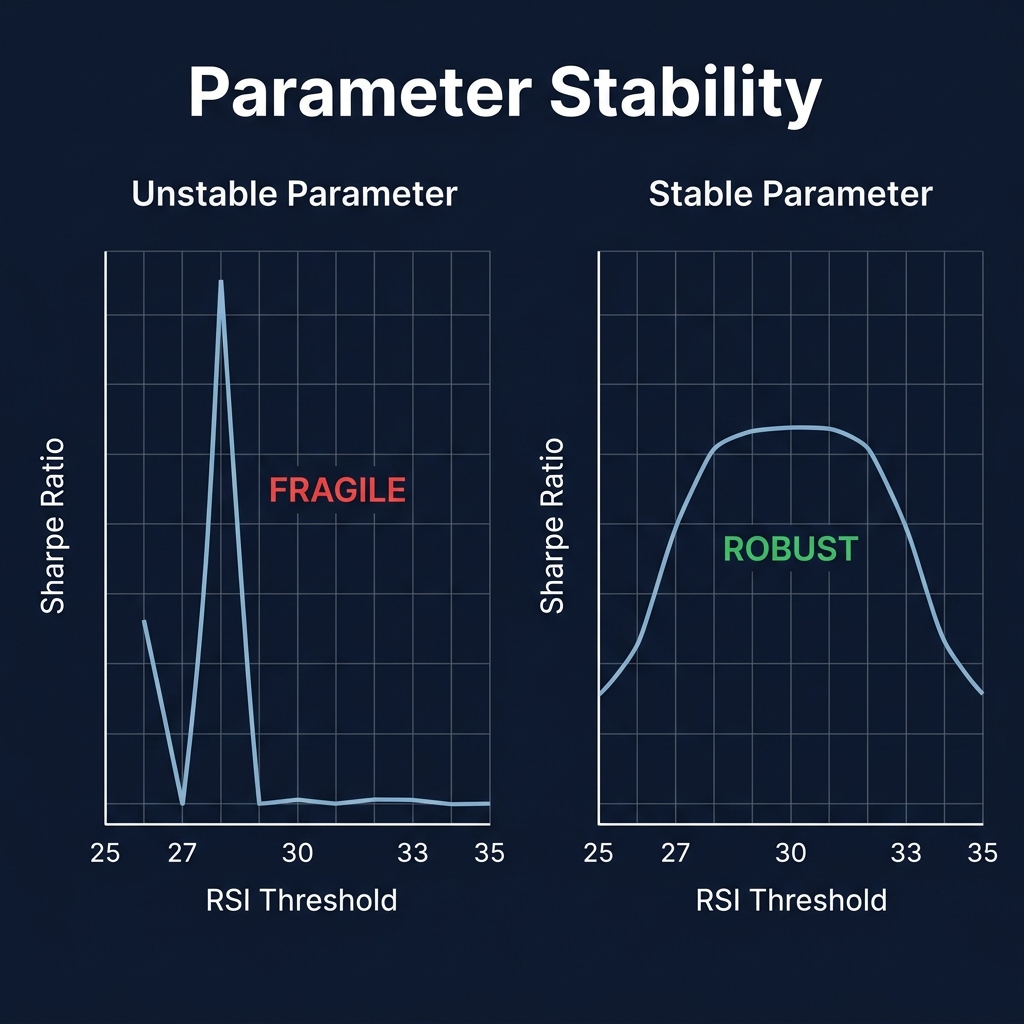
Prefer round numbers. RSI threshold of 30 is more robust than 27. EMA period of 20 is more robust than 18. Round numbers capture the same phenomenon without fitting to noise.
Check parameter stability. If RSI=30 is profitable but RSI=29 and RSI=31 are not, your edge is an illusion. A robust parameter shows similar results across a range.
Use the Sharpe ratio plateau test: Plot Sharpe ratio vs. parameter value. A valid parameter creates a broad plateau, not a narrow spike.
Stage 5: Out-of-Sample Validation
This is the most critical stage — and the one most traders skip entirely.
Walk-Forward Analysis (WFA)
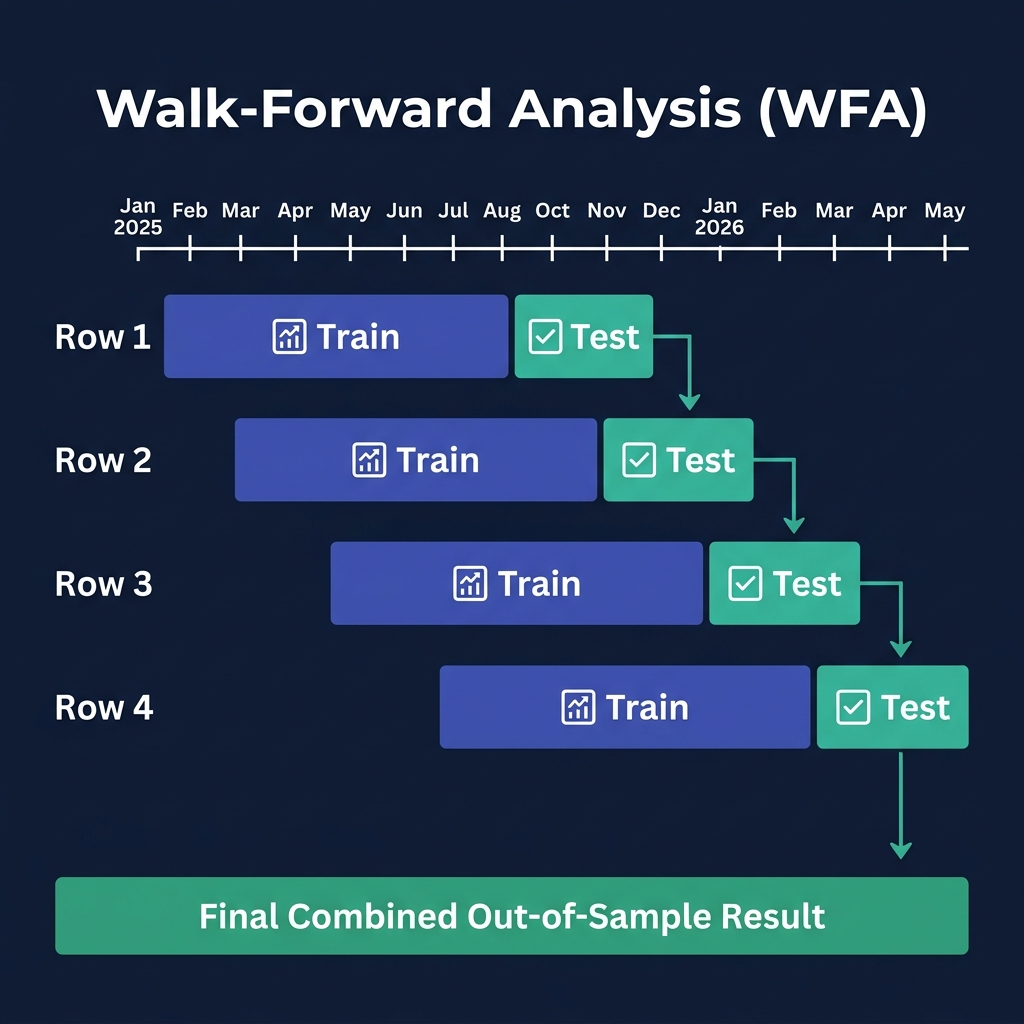
Walk-Forward Analysis is the gold standard for strategy validation. It simulates exactly how you would trade in real life: optimize on past data, then trade forward without changing anything.
How it works:
Total Data: Jan 2025 ──────────────────────── May 2026

Window 1:
  [Train: Jan-Jun 2025] → [Test: Jul-Sep 2025]

Window 2:
  [Train: Apr-Sep 2025] → [Test: Oct-Dec 2025]

Window 3:
  [Train: Jul-Dec 2025] → [Test: Jan-Mar 2026]

Window 4:
  [Train: Oct 2025-Mar 2026] → [Test: Apr-May 2026]

Final Result = Combined performance of ALL test windows
Why this works: Each test window uses parameters optimized on data it has never seen. If the combined test performance is similar to the training performance, your strategy has genuine predictive power.
Even a strategy that passes WFA can fail in extreme conditions. Run these stress tests:
Monte Carlo Simulation
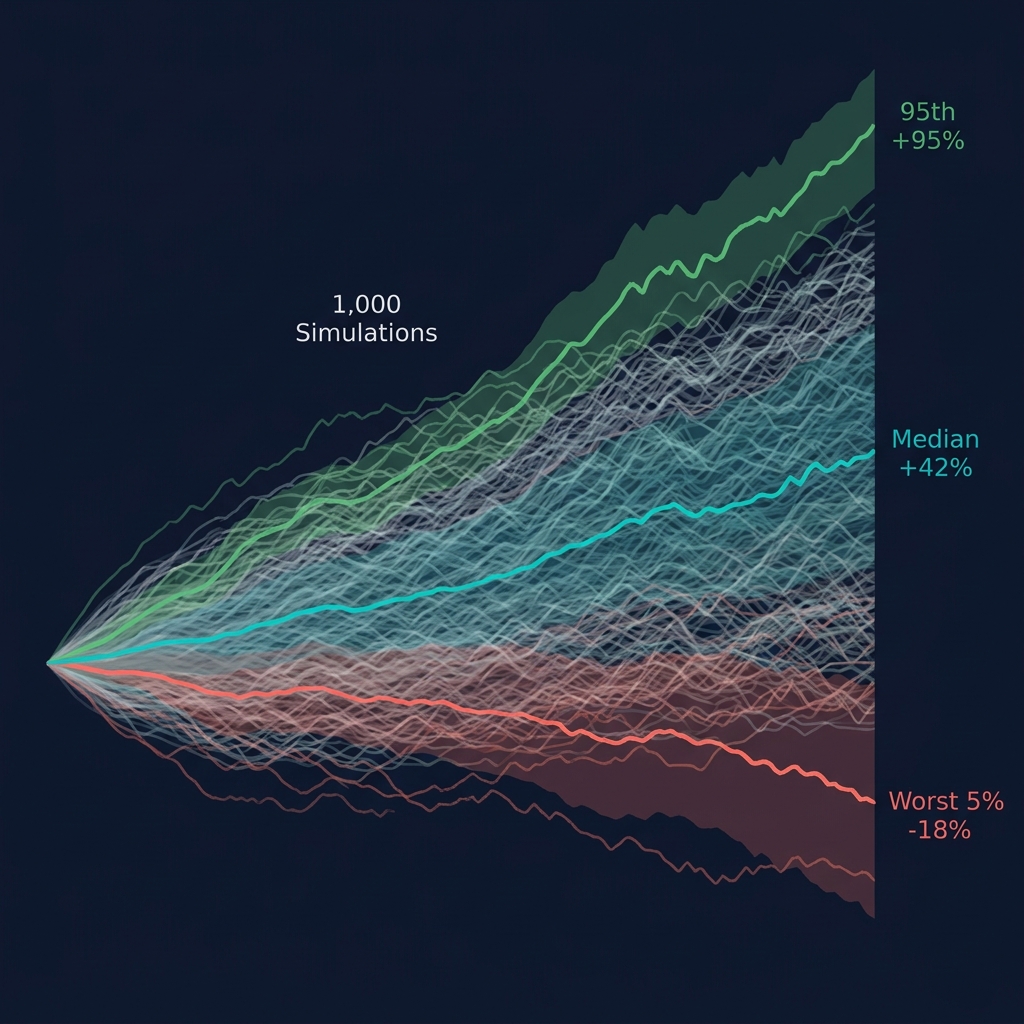
Randomly shuffle the order of your trades 1,000+ times. This answers: "Would my strategy still be profitable if the same trades occurred in a different sequence?"
Why this matters: A strategy might show a smooth equity curve historically, but a different ordering of the same trades could produce a 50% drawdown that would cause you to abandon it.
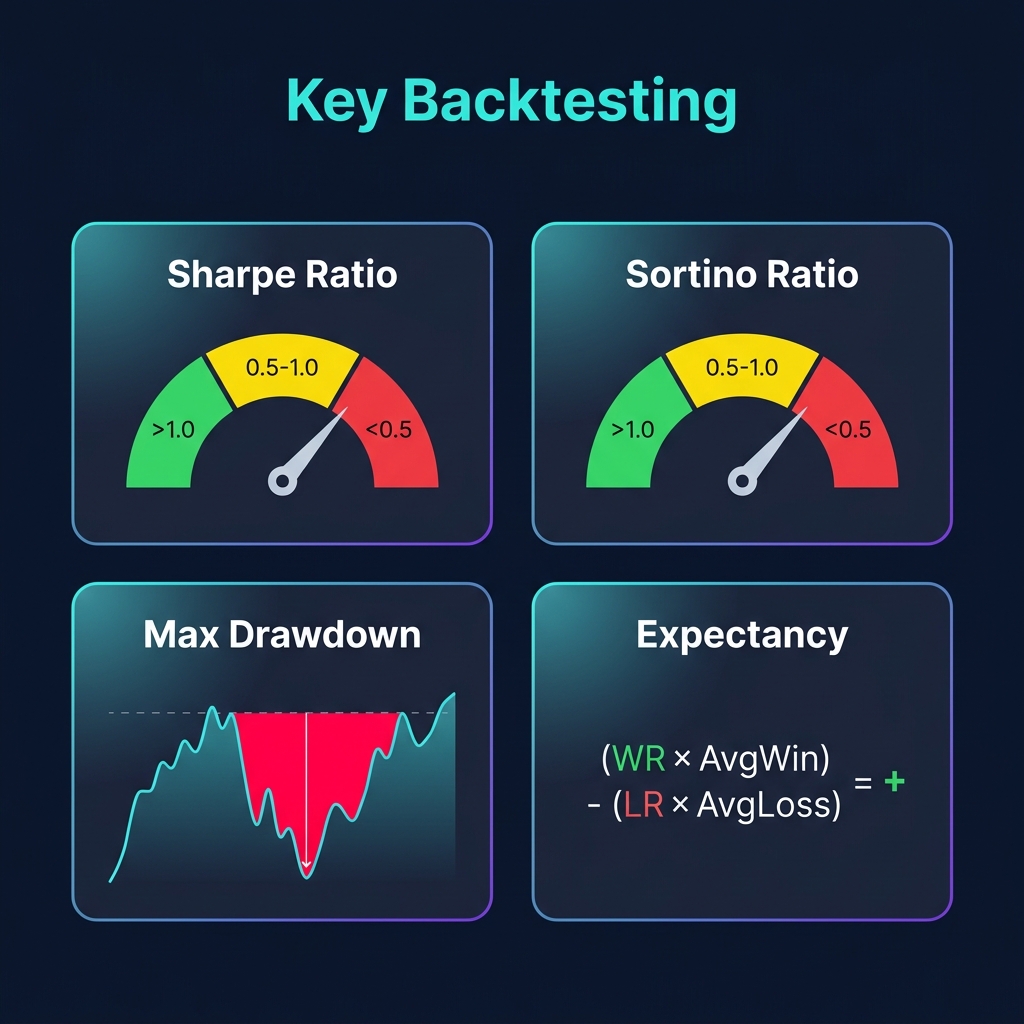
This single number tells you whether your strategy has positive edge. If expectancy is negative, nothing else matters — the strategy loses money.
The Equity Curve Health Check
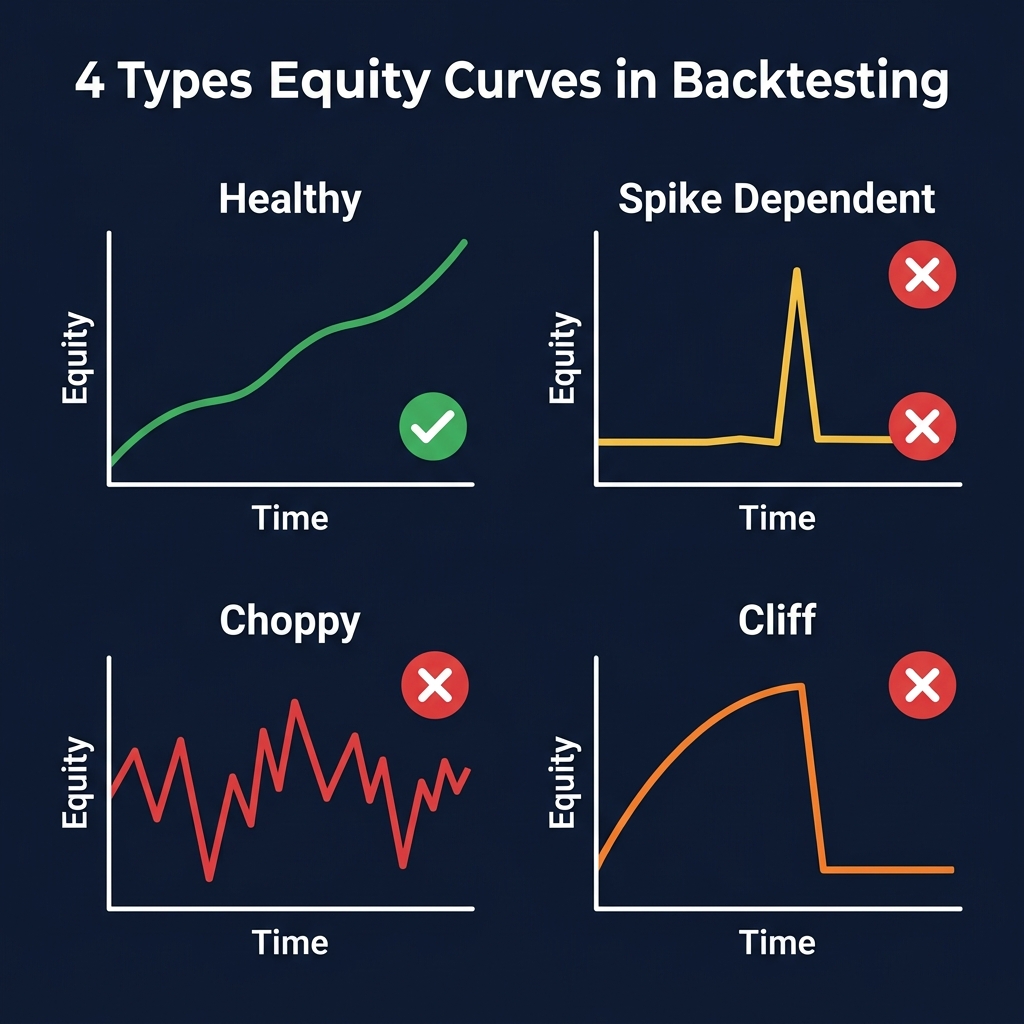
A healthy equity curve has these properties:
Steadily rising — not dependent on a few large wins
Short drawdown periods — recovers quickly from losses
Consistent slope — similar return rate across the whole period
No "hockey stick" — doesn't derive all profit from one period
Red Flags in Equity Curves
Pattern
What It Means
Action
Flat for months, then sudden spike
Strategy profits from rare events only
Add more entry conditions or test longer
Smooth climb, sudden cliff
Stop-loss too tight or didn't handle black swan
Add regime detection and position sizing
Choppy zigzag around breakeven
No real edge — random fluctuation
Simplify strategy or find better signals
Beautiful smooth curve with < 20 trades
Insufficient sample — likely lucky
Extend test period or lower signal threshold
Practical Example: Building & Validating a CoinXSight Strategy
Let's walk through the complete methodology with a real strategy.
Hypothesis
"CoinXSight's Deep Alpha momentum score crossing above 60 while the RSI is between 35-45 (oversold pullback in a trend) produces positive expectancy on 4H timeframe for BTC."
Why This Should Work
Deep Alpha Momentum > 60 confirms an existing trend
RSI 35-45 catches pullbacks within the trend (not reversals)
Combining AI scoring with classical TA creates confluence
4H timeframe balances signal frequency with quality
Strategy Rules
Component
Rule
Entry
Deep Alpha Momentum > 60 AND RSI between 35-45
Stop-Loss
2 × ATR(14) below entry
Take-Profit 1
1.5 × ATR(14) above entry (close 50%)
Take-Profit 2
3 × ATR(14) above entry (close remaining)
Position Size
2% risk per trade
Max Open Trades
1 at a time
Validation Process
Step 1: Run WFA with 4 windows on BTC 4H data (Jan 2025 — May 2026)
Step 2: Check Walk-Forward Efficiency:
In-sample average return per trade: 1.8%
Out-of-sample average return per trade: 1.2%
WFE = 67% → Good, minor overfitting present
Step 3: Monte Carlo Simulation (1,000 iterations):
Median final equity: +42% over 16 months
5th percentile max drawdown: -18%
Probability of ruin: 3%
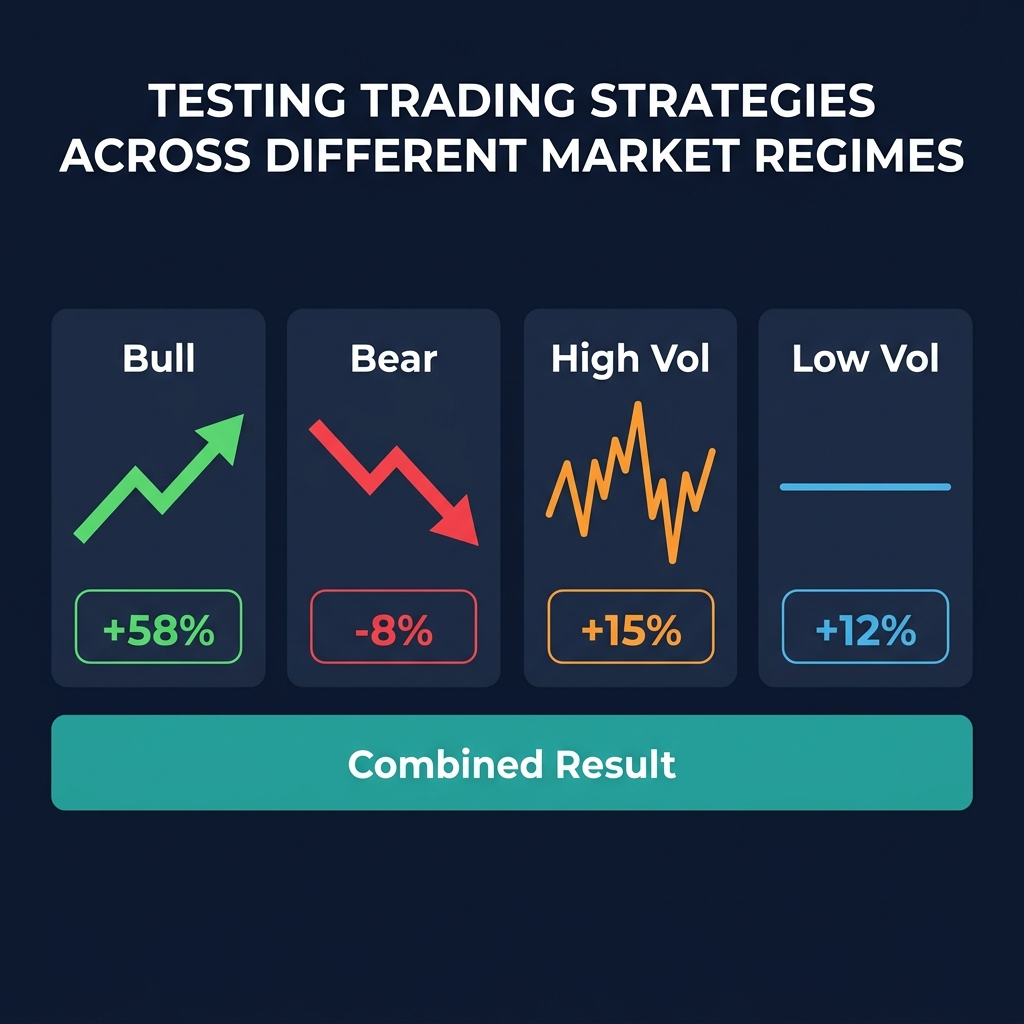
Step 4: Regime test results:
Regime
Return
Win Rate
Trades
Bull trend
+58%
68%
24
Bear trend
-8%
41%
12
Sideways
+12%
55%
18
Combined
+42%
58%
54
Conclusion: Strategy has genuine edge in bull and sideways markets. In bear markets it loses slightly — acceptable because position sizing limits losses.
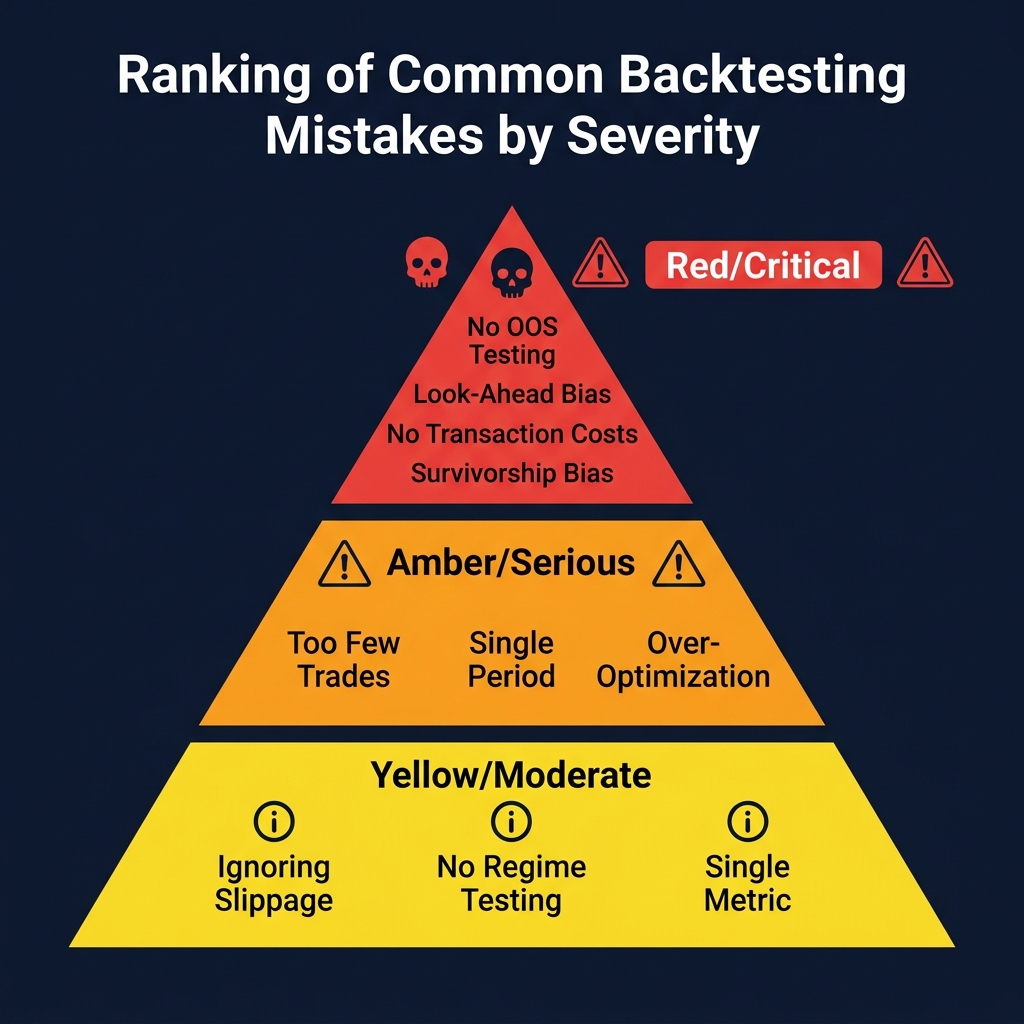
Common Backtesting Mistakes Ranked by Severity
Critical (Will Destroy Your Account)
No out-of-sample testing — You're guaranteed to overfit
Look-ahead bias — Using future data in calculations (e.g., daily close price at 2PM)
Ignoring transaction costs — Many strategies become unprofitable after costs
Survivorship bias — Testing only on coins that survived
Serious (Will Mislead You)
Too few trades — Fewer than 30 trades = statistically meaningless
Single time period — A strategy that works in 2025 Q1 only is not a strategy
Parameter over-optimization — More than 3 free parameters = noise mining
Ignoring maximum drawdown — 200% return means nothing if you had to endure -60% drawdown
Moderate (Will Reduce Edge)
Ignoring slippage — Especially lethal for high-frequency or altcoin strategies
Not testing across regimes — Bull-only strategies are just leverage
Using only one performance metric — Total return without Sharpe/Calmar is incomplete
Not considering correlation — Running multiple strategies that all fail together
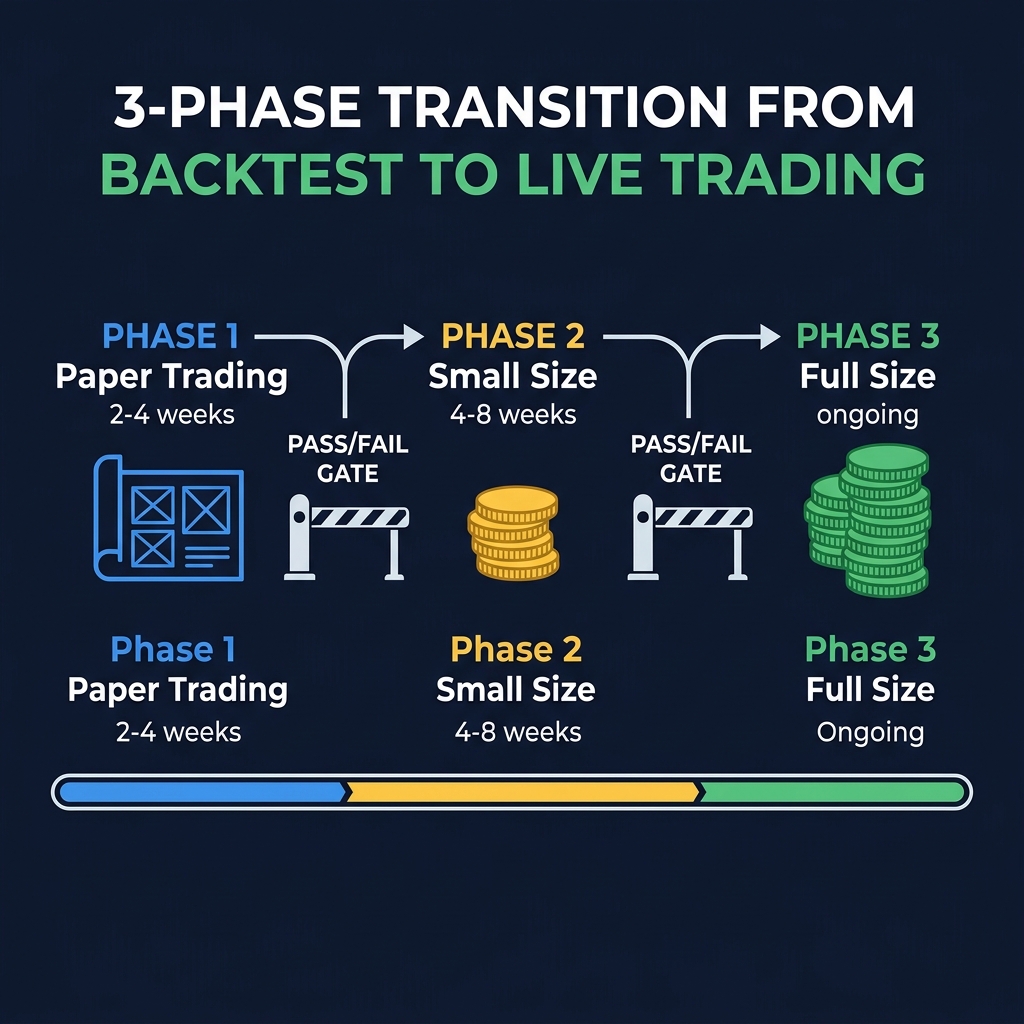
From Backtest to Live Trading: The Transition Checklist
Passing a backtest doesn't mean you should immediately trade full size. Follow this transition:
Execute your strategy in real-time with virtual money
Verify that live signal timing matches backtest assumptions
Compare paper results with expected backtest performance
Pass criteria: Paper results within 70% of backtest expectancy
Phase 2: Small Size Live (4-8 weeks)
Trade with 25% of intended position size
Track execution quality vs. backtest assumptions
Monitor for psychological challenges (fear, FOMO, impatience)
Pass criteria: Live Sharpe ratio > 0.7 × backtest Sharpe ratio
Phase 3: Full Size (Ongoing)
Scale to full intended position size
Implement continuous monitoring dashboards
Set automatic circuit breakers (pause if drawdown > 1.5× backtest max drawdown)
Review and recalibrate parameters quarterly
The CoinXSight Backtest Advantage
CoinXSight's AI Backtest Engine handles many of these methodological challenges for you:
Walk-Forward mode built in — no manual data splitting required
Realistic cost modeling with exchange-specific fee schedules
AI signal replay using historical ASI scores calculated without look-ahead bias
Multi-run comparison to test parameter sensitivity
Risk auditor that flags potential overfitting automatically
The methodology in this guide tells you what to look for. The Backtest Engine gives you the tools to find it.
Every profitable strategy started as a hypothesis that survived rigorous backtesting. CoinXSight's AI Backtest Engine gives you the institutional-grade tools to test yours — so you risk data before you risk capital.
Master risk management for crypto trading. Learn position sizing formulas, stop-loss strategies, and how CoinXSight's Portfolio module tracks your risk…