Crypto Market Analysis: BTC, ETH & SOL Forecast — Week 23 (Jun 2 – Jun 8, 2026)
In-depth weekly crypto market analysis and price predictions for BTC, ETH & SOL in Week 23 (June 2026). Explore AI Mood Score trends and key technical levels.
AT
Alex ThorneHead of Macro & Market Structure·Jun 1, 2026 · 11 min read · Updated Oct 6
The crypto market enters Week 23 under renewed selling pressure, invalidating the early stabilization signals observed last week. Total market capitalization fell to $2.584 trillion, representing a -3.3% contraction week-over-week. Volume has declined by -13.0% to $57.87 billion, showing a lack of buyer interest on this correction. Bitcoin dominance remains high at 57.25%, down slightly by -0.97 percentage points, while Ethereum dominance contracted to 9.40%.
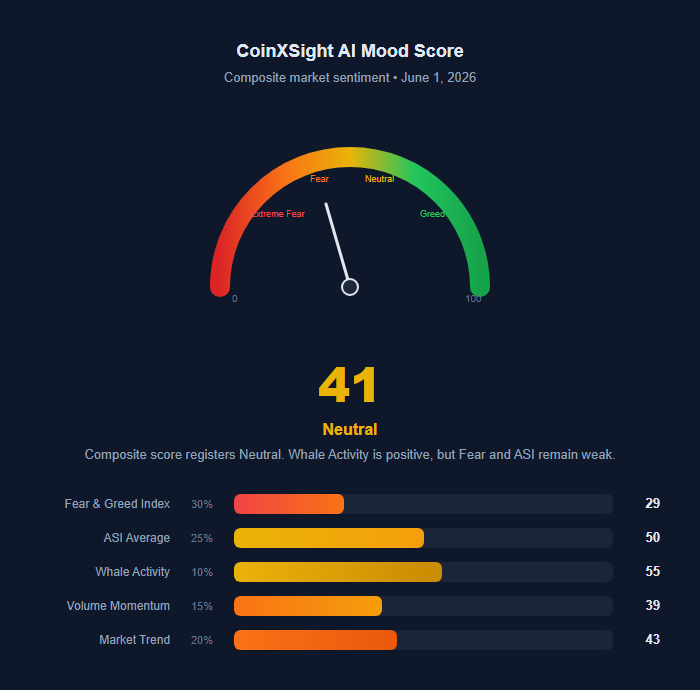
The Fear & Greed Index slipped one point to 29 (Fear). CoinXSight's composite AI Mood Score registers 41/100 (Neutral), down from 42 last week. Although the classification shifted from "Fear" to "Neutral" due to index boundary definitions, the underlying metrics show deteriorating sentiment. The decline was capped only by a minor increase in whale accumulation scores, which represents the sole positive driver in the market.
Metric
Week 23 Value
Week 22 Value
WoW Change
Total Market Cap
$2.584T
$2.673T
-3.3% ↓
24h Trading Volume
$57.87B
$66.50B
-13.0% ↓
BTC Dominance
57.25%
58.22%
-0.97pp ↓
ETH Dominance
9.40%
9.64%
-0.24pp ↓
Fear & Greed Index
29 (Fear)
30 (Fear)
-1 point ↓
AI Mood Score
41 (Neutral)
42 (Fear)
-1 point ↓
Active Cryptocurrencies
17,402
17,393
+9
Macro Context: The Correction Catalyst
Fed Funds Rate Expectations Shift
Market participants are pricing in a longer period of restrictive monetary policy. The Federal Reserve's current rate hold at 3.50% – 3.75% remains unchanged, but comments from regional Fed presidents suggest inflation is not returning to the target corridor as fast as anticipated.
The probability of a rate cut in September has dropped from 65% to 48%, while the probability of rates remaining at current levels through November has risen to 42%. High interest rates limit liquidity inflows into high-beta risk assets, acting as a persistent weight on crypto market valuations.
Geopolitical Escalation and Crude Volatility
The diplomatic progress mediated by Turkish channels last week has stalled. Delays in finalizing cargo guarantees for the Strait of Hormuz corridors have re-introduced supply chain risk. Brent crude rebounded from $94 to $98.50 per barrel.
Higher energy prices raise inflation expectations, reducing the likelihood of central bank easing. The correlation between crypto assets and crude oil remains negative, as rising energy costs pressure consumer liquidity and risk appetites.
US Dollar Strength Rebounds
The US Dollar Index (DXY) climbed to 105.80, recovering from its May low. The strength in the DXY reflects global capital seeking safety amid escalating trade negotiations between the US and China.
With initial tariff schedule agreements pushed back to late July, investors are reducing exposure to emerging markets and speculative digital assets, returning capital to US Treasuries and cash equivalents.
Bitcoin (BTC) — $73,967
Price Action Summary
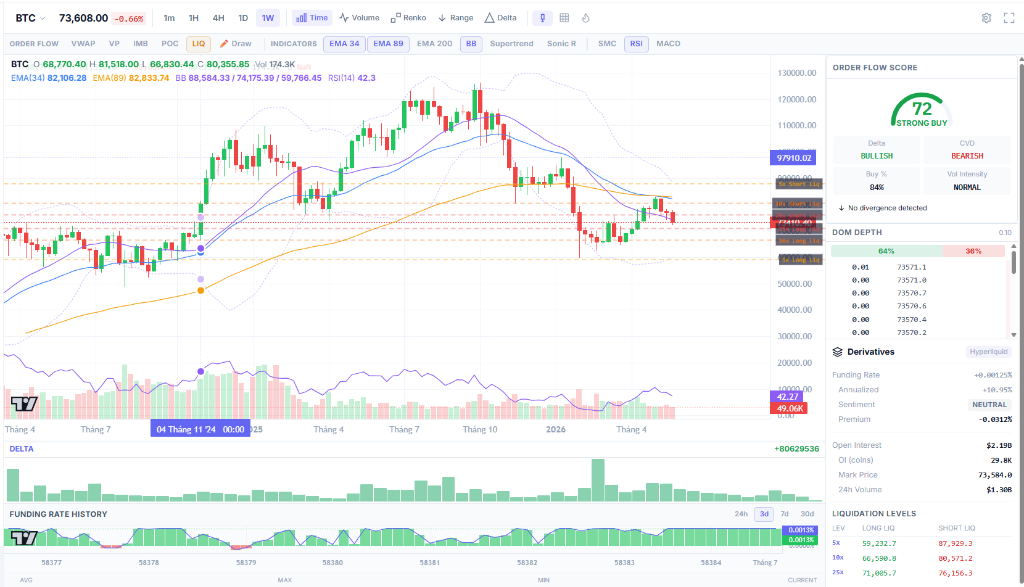
Bitcoin trades at $73,967, down -2.78% over the last seven days. The price fell from its weekly open near $77,500, breaking through multiple key moving averages on the daily chart.
This drop represents a clean breach of the local support structure and shifts the short-term market bias back to bearish.
CoinXSight Alpha Gems Intelligence
The prominent development this week is the failure of the Rising Wedge pattern identified in Week 22. The pattern, which had a high confluence score of 95, failed to break out to the upside as buyers did not support the move at the wedge apex.
BTC entered the week trading at $77,562 with an entry target of $77,517. On May 29, selling pressure forced the price down, crossing below the stop-loss level of $74,896.
The invalidation was marked by a sharp increase in sell volume and a drop in the Momentum Layer score inside the Deep Alpha module. This invalidation highlights the importance of adhering to predefined stop-loss levels.
Despite this price decline, the Alpha Signal Index (ASI) for BTC remains at 64 (BUY). This shows a divergence between price and market sentiment:
Metric
Current Value
Reading
Active Signal
BUY
ASI Score of 64
Whale Status
ACCUMULATION
Net positive on-chain flows
RSI (14)
49.7
Neutral momentum
MACD Histogram
Positive
Declining bullish momentum
Confluence Score
6/10
Moderate setup rating
The divergence between the ASI score and price is driven by whale accumulation. While retail traders are selling assets near support levels, whale wallets (entities holding >100 BTC) increased their positions by +0.18% this week, absorbing selling pressure.
BTC Technical Levels
The critical levels for the week ahead are:
Level
Price Zone
Significance
Resistance 2
$78,000 – $78,500
Major local high; validation zone for bulls
Resistance 1
$75,800 – $76,200
Prior support turned resistance; daily 50 EMA
Support 1
$73,000 – $73,500
Current local support; daily 200 EMA intersection
Support 2
$71,200 – $71,800
Swing low support; key defense line
BTC Verdict
NEUTRAL-BEARISH. The invalidation of the Rising Wedge structure and the close below the daily 50 EMA suggest further downward pressure. While the long-term whale accumulation remains positive, short-term momentum favors sellers. Traders should watch the $73,000 support zone. A daily close below this level opens the path to $71,200.
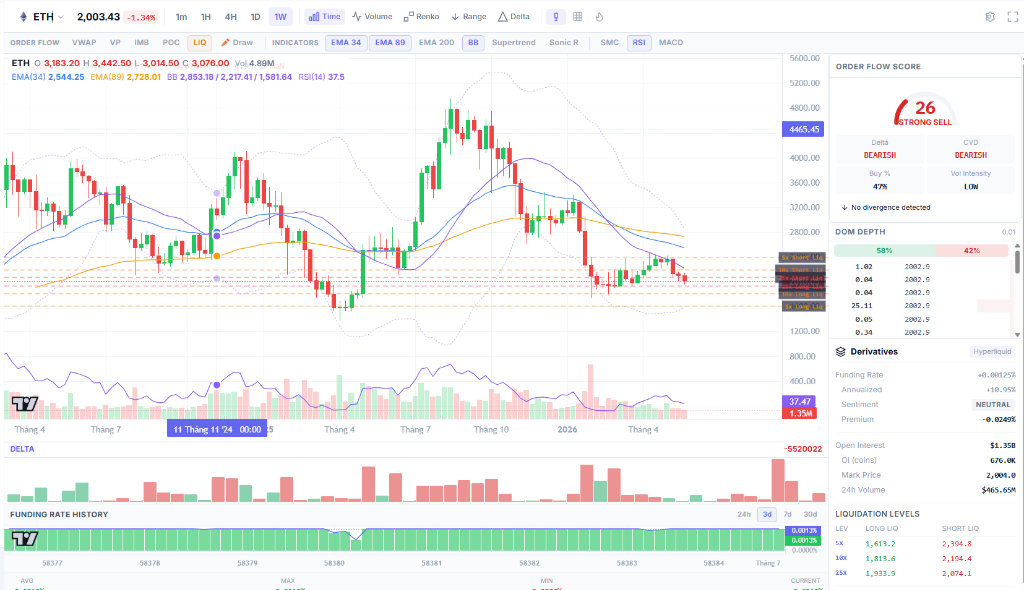
Ethereum (ETH) — $2,017
Price Action Summary
Ethereum trades at $2,017, marking a -2.87% drop over the last 7 days and a -5.4% decline compared to the Week 22 price of $2,131. ETH has underperformed BTC, dropping toward the key psychological support level of $2,000.
CoinXSight Deep Alpha Assessment
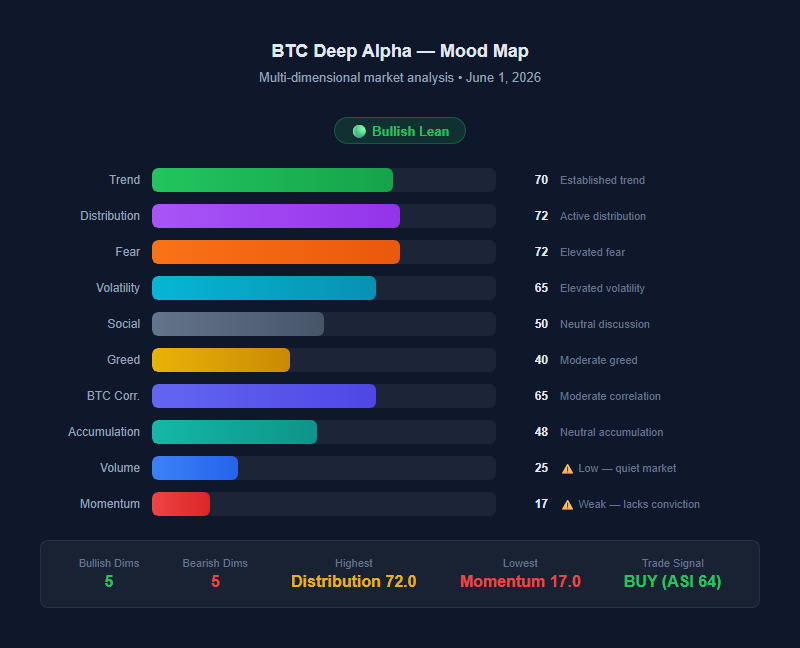
The daily chart shows that ETH's trend strength has deteriorated further. The bearish momentum that showed signs of fading last week has returned, driven by an increase in on-chain distribution.
Scenario 2: ETH Deep Alpha Momentum Decline (May 31, 2026)
As ETH hovered at $2,080, the Deep Alpha module registered a drop in the Momentum Layer from 55 to 41. At the same time, the distribution score rose from 60 to 72.
This combination flagged a breakdown of the transition thesis, preceding the price decline to $2,017 within 24 hours. The volume score remained low at 28, indicating that no buying force was present to defend the $2,050 level.
Dimension
Week 23 Score
Week 22 Score
WoW Change
Trend
70/100
85/100
-15 (weakening trend)
Momentum
41/100
55/100
-14 (bearish increase)
Volume
28/100
30/100
-2 (illiquid market)
Fear
72/100
65/100
+7 (rising panic)
Distribution
72/100
60/100
+12 (seller dominance)
Volatility
65/100
60/100
+5 (increasing volatility)
Key Insight: The increase in the Distribution score from 60 to 72 indicates active selling by mid-tier wallets (100–1,000 ETH). Volume remains low at 28/100, which means the price drop is occurring in thin order books. The fear metric at 72 indicates that market participants are expecting a break below the $2,000 floor.
ETH Verdict
BEARISH. Ethereum is trading immediately above its critical support level. The combination of declining momentum, low volume, and increasing distribution suggests a breakdown is likely. If the $2,000 level fails to hold on a daily close, the next major support zone is at $1,880. Buy setups should be avoided until ETH reclaims $2,150.
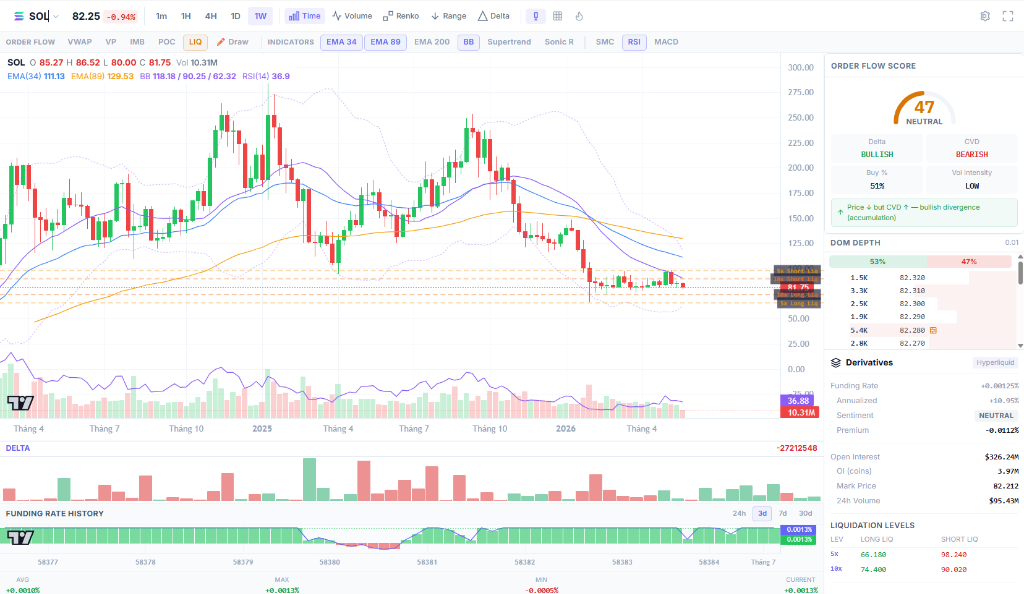
Solana (SOL) — $82.98
Price Action Summary
Solana trades at $82.98, down -3.28% over the last 7 days. The asset failed to sustain its recovery above $86, moving back down to test the lower boundary of its multi-week consolidation range.
CoinXSight Deep Alpha Assessment
The accumulation structure identified in Week 22 has reversed. The distribution metric has risen, showing that the short-term bottoming pattern did not develop sufficient buyer commitment.
Dimension
Week 23 Score
Week 22 Score
WoW Change
Momentum
82/100
75/100
+7 (bearish momentum rising)
Trend
60/100
55/100
+5 (bearish trend strengthening)
Fear
62/100
55/100
+7 (increasing caution)
Accumulation
48/100
55/100
-7 (buying interest fading)
Distribution
52/100
45/100
+7 (selling interest rising)
Volatility
70/100
65/100
+5 (widening range)
Key Insight: The ratio of accumulation to distribution has flipped from 55/45 last week back to 48/52 in favor of distribution. This indicates that the buyers who entered during the late May stabilization are exiting positions. Volatility has ticked up to 70/100, showing that SOL's price movements are becoming wider as it approaches its support range.
SOL Verdict
BEARISH. Solana has invalidated its bottom-formation thesis. The shift back to distribution dominance and rising bearish momentum suggest that the support level at $80.00 will be tested. If SOL breaks below $80.00, it faces a rapid decline to $74.50 due to the lack of historical volume support between those levels.
Alpha Gems Pipeline — Week 23 Status
The market correction has resulted in a signal drought. CoinXSight's Alpha Gems engine, which uses a multi-factor pattern recognition model, currently displays 0 active high-confluence gems (score ≥ 50). This represents a direct contraction from the 10 active long signals in Week 22.
Proprietary Confluence Scoring System
CoinXSight's Confluence Score is calculated using four distinct layers:
Trend Layer: Evaluates the relationship between the asset price and its Exponential Moving Averages (EMA 34, EMA 89, EMA 200) alongside Supertrend indicators.
SMC Layer: Detects institutional footprint through Order Blocks (OB) and Fair Value Gaps (FVG).
Momentum Layer: Formulates a composite score from the Relative Strength Index (RSI), MACD, Stochastic RSI, and the Money Flow Index (MFI).
Volume Layer: Analyzes volume ratio relative to its historical 20-day average.
In the current environment, no major assets have reached the required threshold across all four layers, indicating a high-risk environment for trend-following strategies.
Discovery Small-Cap Highlights
While major assets show no high-confluence setups, the Discovery scanner has flagged three small-cap tokens with low-market-cap signals. These setups carry high volatility risk:
TAKE (Overtake): ASI Score of 70 (BUY). The asset shows a Double Bottom pattern on the 4-hour chart, but volume remains low, indicating poor liquidity.
COOKIE (Cookie DAO): ASI Score of 60 (BUY). A Wyckoff Spring pattern has been detected on the 1-hour chart. The entry price is near $0.082 with support at $0.078.
HEI (Heima): ASI Score of 60 (BUY). Despite a -14% price drop over 24 hours, on-chain metrics show accumulation by early participant wallets.
Additionally, the engine has flagged a high-reliability Bearish Engulfing pattern on BNB on the daily chart, generating a SELL signal as the price failed to reclaim its range high.
Top 10 Market Performance
Asset
Price
24h Change
7d Change
Market Cap
BTC
$73,967
-0.03%
-2.78%
$1,479B
ETH
$2,017
-0.48%
-2.87%
$243B
USDT
$0.998
0.00%
0.00%
$188B
BNB
$714
-1.50%
-1.15%
$96B
XRP
$1.34
-0.19%
-0.59%
$83B
USDC
$1.001
-0.01%
-0.01%
$76B
SOL
$82.98
+0.06%
-3.28%
$48B
TRX
$0.352
+1.46%
-5.13%
$33B
stETH
$2,263
-3.71%
-22.68%
$22B
The performance table shows a consistent downward trend. The most notable shift is in TRX, which declined by -5.13% over the last 7 days, dropping to $0.352. The staking narrative that provided support in Week 22 has faded as market participants seek stablecoin cash equivalents.
AI Mood Score: Under the Hood
The composite AI Mood Score has dropped from 42 to 41, remaining in the Neutral-Fear border zone. The breakdown of individual components shows that the market is supported only by whale behavior:
Component
Score
Weight
Change from W22
Fear & Greed Index
29
30%
-1
ASI Average
50
25%
-2
Market Trend
43
20%
+1
Volume Momentum
39
15%
+1
Whale Activity
55
10%
+5
Composite Score
41
100%
-1
Whale Activity increased by +5 points to 55, showing that large wallet addresses are buying assets during the price correction. However, the Fear & Greed Index (29) and the ASI Average (50) declined, neutralising the positive impact of whale accumulation. The Volume Momentum score at 39 indicates that the market lacks the liquid trading volume necessary to sustain a price trend.
Week 23 Outlook & Key Levels
Scenarios
Base Case (55% probability — upgraded from 45%):
BTC continues to consolidate between $72,500 and $75,500. ETH remains weak, fluctuating around the $2,000 psychological support level. SOL trades within the $80.00 – $85.00 range. Overall trading volume remains low, preventing any clear directional trend.
Bearish Scenario (30% probability — upgraded from 15%):
BTC breaks below its daily 200 EMA at $73,000, triggering stop-loss orders down to $71,200. ETH breaks its psychological support, dropping rapidly toward $1,880. SOL falls below $80.00, testing support at $74.50. This scenario would be accelerated by a rise in energy costs or hawkish comments from central bank officials.
Bullish Scenario (15% probability — downgraded from 40%):
BTC reclaims the $76,000 level and moves toward $78,500. Whale accumulation triggers short-covering, lifting ETH back above $2,150 and SOL above $88.00. This scenario requires a decline in the DXY and progress in US-China trade negotiations.
What to Watch
BTC $73,000 support level: The daily 200 EMA is located at this price level. A clean break below it shifts the intermediate trend to bearish.
ETH $2,000 psychological floor: A close below this level is likely to trigger liquidations in DeFi lending platforms.
Whale Activity Score: Check if the Whale Activity score continues to diverge from the retail Fear & Greed index.
The US Dollar Index (DXY): Continued strength in the DXY above 106.00 will cap any potential rally in crypto assets.
DEX Liquidity on Small-Caps: Watch if small-cap discoveries like COOKIE or TAKE maintain their volume levels amid the large-cap decline.
FAQ
Why did the Bitcoin Rising Wedge pattern fail in Week 22?
The Rising Wedge failed because buyers did not support the breakout at the pattern's apex. The price dropped below the stop-loss level of $74,896, invalidating the bullish setup.
What is the difference between the Fear & Greed Index and the AI Mood Score?
The Fear & Greed Index relies on market sentiment data like social media volume and volatility. The AI Mood Score is a composite index that incorporates on-chain whale activity, volume momentum, and trend indicators.
Is Solana a buy at $82.98?
Technical indicators suggest caution. SOL's accumulation score has declined to 48, while distribution has risen to 52. This indicates that sellers are currently in control, and the price is likely to test the $80.00 support level.
How does the Confluence Scoring system work on CoinXSight?
The Confluence Scoring system evaluates assets using four layers: Trend, SMC (Smart Money Concepts), Momentum, and Volume. An asset must score highly across all four layers to generate a high-confluence signal.
How to Use This Analysis on CoinXSight
To track the metrics mentioned in this report in real time, follow these steps:
Open the Deep Alpha module to monitor the live ASI scores for BTC, ETH, and SOL.
Check the Whale Tracker dashboard to observe net on-chain inflows and track large wallet addresses.
Go to the Chart Pro dashboard to view the weekly candle charts and apply the Confluence Scoring overlay.
Review the Discovery Scanner feed to find any newly generated small-cap signals.
Disclaimer: This analysis is for educational purposes only. Cryptocurrency trading carries a high level of risk, and you may lose all of your capital. Always use risk management tools and conduct your own research before entering any trades.
Head of Macro & Market Structure·Global Macro Desk
Former institutional FX and macro derivative analyst. Specializes in global liquidity cycles, central bank balance sheets, and crypto market microstructure.
QUANTITATIVE SUITE // DEEP ALPHA ENGINEACTIVE
BTC/USDT // LIVE SCANNER
CONFLUENCE 75
LIVE SPOT PRICE$81,504.32MODERATE_SELL
TP2
$90,021.17
+8.94%
TP1
$85,590.64
+3.57%
ENTRY
$82,636.95
ZONE
SL
$84,113.79
1.79%
Auto-detect Order Blocks, Fair Value Gaps and risk-adjusted DCA ladders in < 5s.
Comprehensive monthly cryptocurrency market review for May 2026. Total market cap trends, BTC/ETH/SOL performance breakdown, Alpha Hunter pipeline metrics, macro…