Master AI-driven crypto risk management — position sizing formulas, stop loss strategies, and portfolio protection with CoinXSight. Essential crypto technical analysis for smarter trading.
KZ
Dr. Kevin ZhangPrincipal AI & Quantitative Researcher·May 23, 2026 · 10 min read · Updated Oct 6
Why Risk Management Matters More Than Your Strategy
Here's a counterintuitive fact that separates profitable traders from the majority: your risk management system is more important than your entry strategy. A mediocre strategy with excellent risk management will outperform a brilliant strategy with poor risk management every single time.
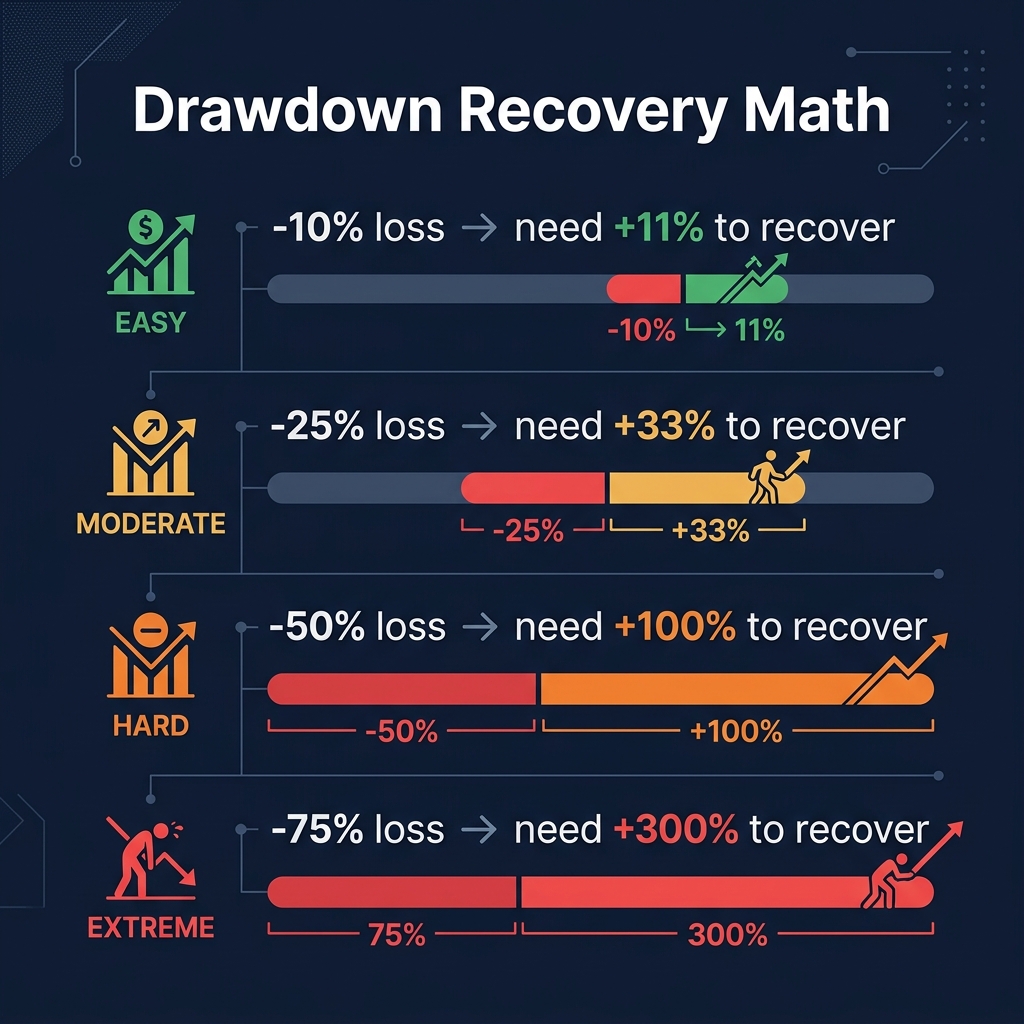
The math is simple. If you lose 50% of your portfolio, you need a 100% gain just to break even. Lose 75%, and you need 300%. The asymmetry of losses means that protecting capital is always more valuable than maximizing gains.
AI tools like ChatGPT and Gemini can't predict markets, but they excel at the mathematical, logical work of risk management: calculating position sizes, modeling drawdown scenarios, analyzing portfolio correlations, and stress-testing your exposure. This guide shows you how to use AI for the risk side of trading — the side most traders ignore.
💡 CoinXSight's Confluence Score system already integrates risk factors — when the score drops below 4/10, it's warning you that risk conditions are unfavorable. The risk management workflow below works alongside CoinXSight's built-in risk signals to create a complete protection system.
The AI Risk Management Framework
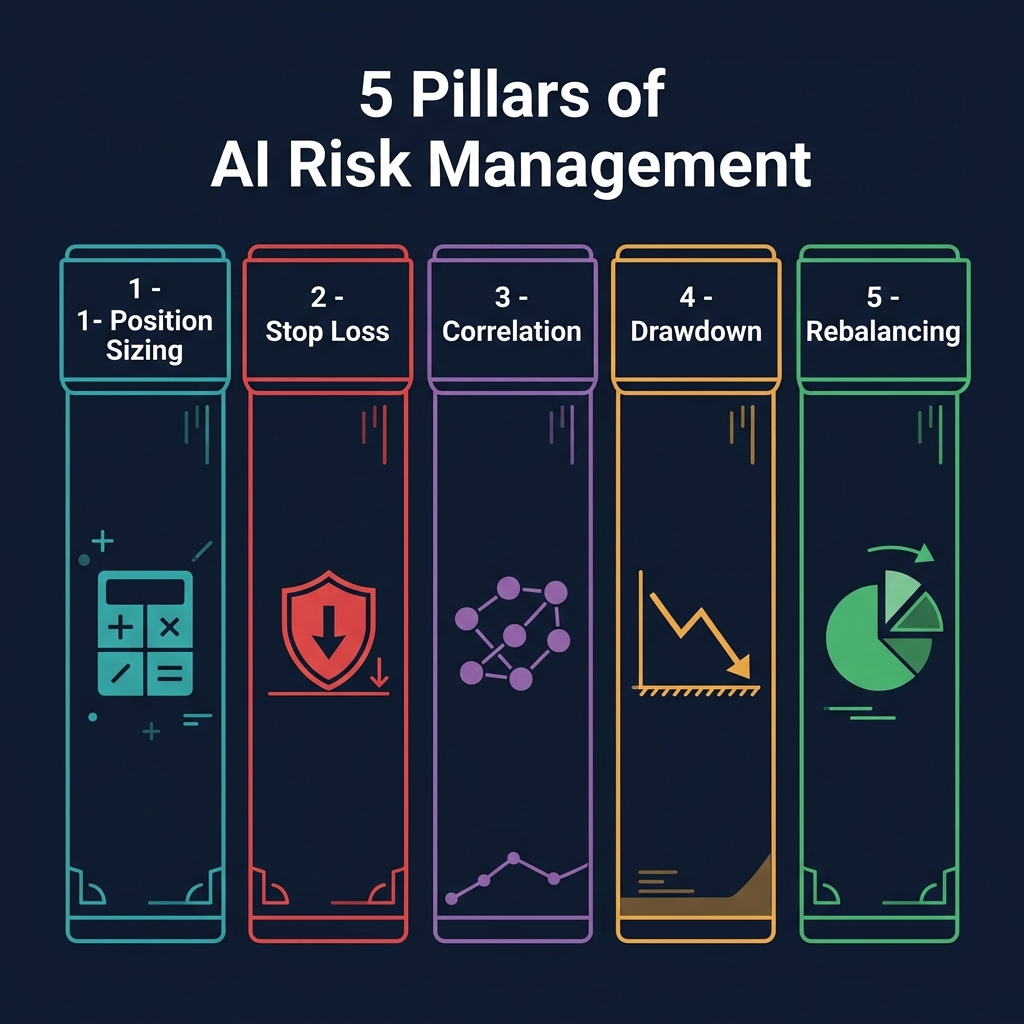
Effective risk management has 5 pillars. Most traders only use one (stop losses) and skip the other four.
Pillar
What It Controls
AI Use Case
Position Sizing
How much capital per trade
Calculate optimal size based on volatility and risk tolerance
Stop Loss Design
Where to exit losing trades
Model stop placement based on ATR, structure, and historical volatility
Correlation Analysis
How positions interact
Detect hidden portfolio concentration risks
Drawdown Management
How to handle losing streaks
Model recovery scenarios and implement circuit breakers
Portfolio Rebalancing
When to adjust allocations
Evaluate risk-adjusted returns and optimize allocation
Pillar 1: AI-Powered Position Sizing
Understanding Pillar 1: AI is a key part of crypto technical analysis. Most professional trading indicators on any crypto trading platform will help you apply these concepts in real time.
Position sizing is the single most impactful risk management decision. Risk too much per trade and one loss wrecks your account. Risk too little and you can't generate meaningful returns.
The Position Sizing Calculator Prompt
Role: Quantitative risk manager.

Calculate optimal position size for this trade:

ACCOUNT DATA:
- Total portfolio value: $[X]
- Maximum risk per trade: [X]% (recommended: 1-2%)
- Current open positions: [X] trades using [X]% of portfolio

TRADE SETUP:
- Token: [TOKEN]
- Entry price: $[X]
- Stop loss: $[X]
- Stop distance: [X]%
- CoinXSight Confluence Score: [X/10]

VOLATILITY CONTEXT:
- Token's 14-day ATR: $[X] ([X]% of price)
- BTC 24h volatility: [X]%
- Overall market regime: [trending/ranging/volatile]

Calculate:
1. Base position size using the fixed-percentage formula:
   Position Size = (Portfolio x Risk%) / Stop Distance%
2. Adjust for volatility: If ATR is above historical
   average, reduce by [X]%
3. Adjust for Confluence Score: Scale position by
   Score/10 (e.g., 7/10 = 70% of base size)
4. Final position size in USD and token units
5. Maximum number of correlated positions allowed
   simultaneously
6. What percentage of the portfolio would be at risk
   if ALL open positions hit their stop losses?

Format: Table with each calculation step.
The Kelly Criterion Prompt
The Kelly Criterion was developed by John L. Kelly Jr. at Bell Labs in 1956, originally for optimizing signal-noise ratios in telecommunications. It was later adapted for portfolio sizing by Edward O. Thorp in Beat the Dealer (1962).
I want to use a modified Kelly Criterion for position sizing.

Historical performance data:
- Win rate: [X]%
- Average win: [X]%
- Average loss: [X]%
- Number of trades in sample: [X]

Calculate:
1. Full Kelly percentage
2. Half-Kelly (more conservative, recommended for crypto)
3. Quarter-Kelly (maximum conservatism)
4. Which Kelly fraction is appropriate given
   my sample size?
5. What's the expected growth rate at each fraction?
6. At what drawdown level should I reduce
   from Half-Kelly to Quarter-Kelly?
Pillar 2: AI-Designed Stop Loss Strategies
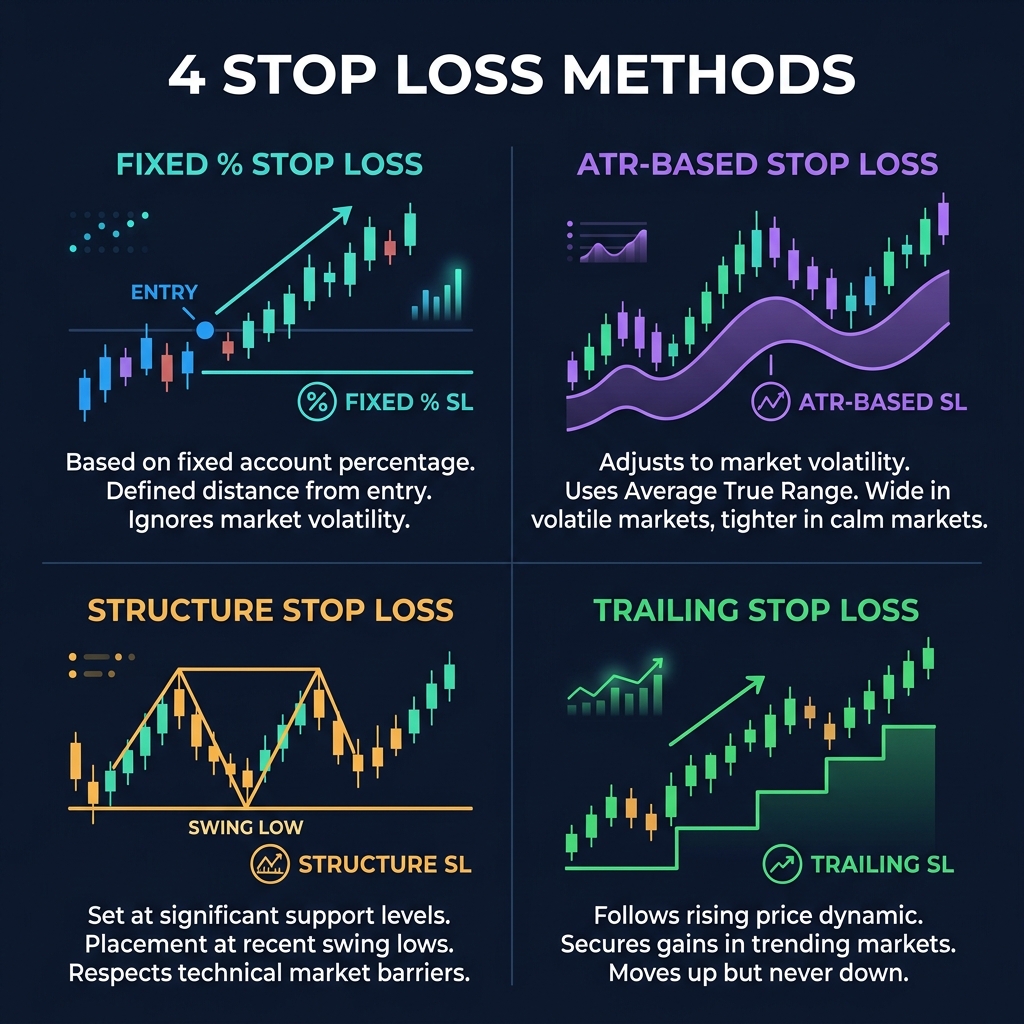
A stop loss isn't just a number below your entry. The placement method matters enormously. One of the most widely used volatility-based methods relies on ATR, developed by J. Welles Wilder Jr. in 1978 as part of his suite of technical indicators.
The Stop Loss Design Prompt
Role: Risk management specialist.

I need to design a stop loss for this trade:

TRADE DATA:
- Token: [TOKEN]
- Entry price: $[X]
- Direction: [long/short]
- Timeframe: [4H/Daily/Weekly]

TECHNICAL DATA:
- 14-day ATR: $[X]
- Recent swing low (for longs): $[X]
- Recent swing high (for shorts): $[X]
- Key support below entry: $[X]
- CoinXSight Confluence Score: [X/10]
- RSI(14): [value]

Compare these stop loss methods:

1. FIXED PERCENTAGE:
   Stop at [X]% below entry

2. ATR-BASED:
   Stop at Entry - (ATR x multiplier)
   Calculate for 1.5x, 2x, and 3x ATR

3. STRUCTURE-BASED:
   Stop below the nearest significant
   support/swing low

4. TRAILING STOP:
   Design a trailing mechanism
   (% trail or ATR trail)

For each method:
- Where exactly is the stop price?
- What's the position size at 2% portfolio risk?
- What's the R:R ratio to target?
- Pros and cons for current market conditions
- Which is best for THIS specific trade?
AI analysis: "ATR-based stop at 2x ATR = $107,200 – $4,200 = $103,000 — too wide, giving back 3.9%. Structure-based stop at $105,200 (just below swing low) = 1.9% risk — tight enough to maintain good R:R but respects market structure. Recommendation: Use structure-based at $105,200 with the ATR stop ($103,000) as the maximum allowable stop for larger positions. If Confluence Score drops below 5/10 while in the trade, tighten to the trailing stop method."
Pillar 3: Portfolio Correlation Analysis
This is where most crypto traders fail completely. They think holding BTC, ETH, SOL, and AVAX is "diversified." It's not — in a market crash, these assets drop 80-95% together. You can verify real-time correlation data using market aggregators like CoinGecko.
Real Example — Portfolio Correlation Alert via CoinXSight (May 2026)
A trader held BTC (40%), ETH (30%), and SOL (30%). Using ChatGPT to
analyze 90-day correlation data from CoinXSight's Portfolio module,
the AI flagged that BTC-ETH correlation had risen to 0.94 and BTC-SOL
to 0.89 — effectively making the portfolio a single-asset bet.
ChatGPT recommended adding a stablecoin yield position (20%) and
reducing SOL to 10%. When the May 28 correction hit (−8% across
majors), the rebalanced portfolio lost only −5.1% vs the original
allocation's −7.8% drawdown.
The Correlation Check Prompt
Role: Portfolio risk analyst.

Here's my current crypto portfolio:

| Token | Allocation | Current P&L | Confluence Score |
|-------|-----------|-------------|-----------------|
| BTC   | [X]%      | [X]%        | [X/10]          |
| ETH   | [X]%      | [X]%        | [X/10]          |
| SOL   | [X]%      | [X]%        | [X/10]          |
| [TOKEN] | [X]%    | [X]%        | [X/10]          |

Stablecoin reserve: [X]%
Total portfolio: $[X]

Analyze correlation risk:
1. Which tokens are highly correlated
   (likely to drop together)?
2. What's my effective concentration?
   (Correlated assets count as one position)
3. If BTC drops 20%, estimate the portfolio impact
4. Am I diversified across sectors?
   (L1, DeFi, infrastructure, etc.)
5. What's the maximum realistic portfolio drawdown
   in a market-wide correction?
6. Suggest a rebalancing plan to reduce
   correlation risk
7. What percentage should be in stablecoins
   given current market conditions?
The Stress Test Prompt
Stress test my portfolio against these scenarios:

Portfolio: [paste positions and sizes]

SCENARIOS:
1. BTC flash crash: -15% in 24 hours
2. Extended bear market: -40% over 3 months
3. Altcoin rotation: BTC +10%, alts -25%
4. Black swan: exchange hack, -30% market-wide
5. Regulatory shock: specific sector -50%

For each scenario:
- Estimated portfolio impact (% loss)
- Which positions are most vulnerable?
- Do my stop losses protect adequately?
- What pre-emptive actions should I take NOW
  to reduce exposure to each scenario?
Pillar 4: Drawdown Management
Drawdowns are inevitable. The question is: how do you respond?
The Drawdown Response Plan
Role: Trading psychologist and risk manager.

I'm currently in a drawdown:
- Peak portfolio value: $[X]
- Current portfolio value: $[X]
- Drawdown: [X]%
- Duration: [X] days
- Number of consecutive losses: [X]
- Current strategy win rate: [X]%
  (vs historical [X]%)

Design a drawdown response plan:

1. ASSESSMENT: Is this drawdown within
   normal variance or abnormal?

2. POSITION SIZING ADJUSTMENT:
   At what drawdown should I reduce size?
   - 10% drawdown: [action]
   - 20% drawdown: [action]
   - 30% drawdown: [action]

3. CIRCUIT BREAKER: At what point should I
   stop trading entirely and review strategy?

4. RECOVERY PLAN: Once drawdown stabilizes,
   how to resume trading?

5. PSYCHOLOGICAL FRAMEWORK:
   What behaviors should I avoid during drawdowns?
Pillar 5: AI-Assisted Portfolio Rebalancing
The Rebalancing Prompt
Role: Portfolio manager.

My target and current allocations:

| Token | Target % | Current % | Drift |
|-------|----------|-----------|-------|
| BTC   | [X]%     | [X]%      | [X]% |
| ETH   | [X]%     | [X]%      | [X]% |
| SOL   | [X]%     | [X]%      | [X]% |
| Stables | [X]%   | [X]%      | [X]% |

Advise on rebalancing:
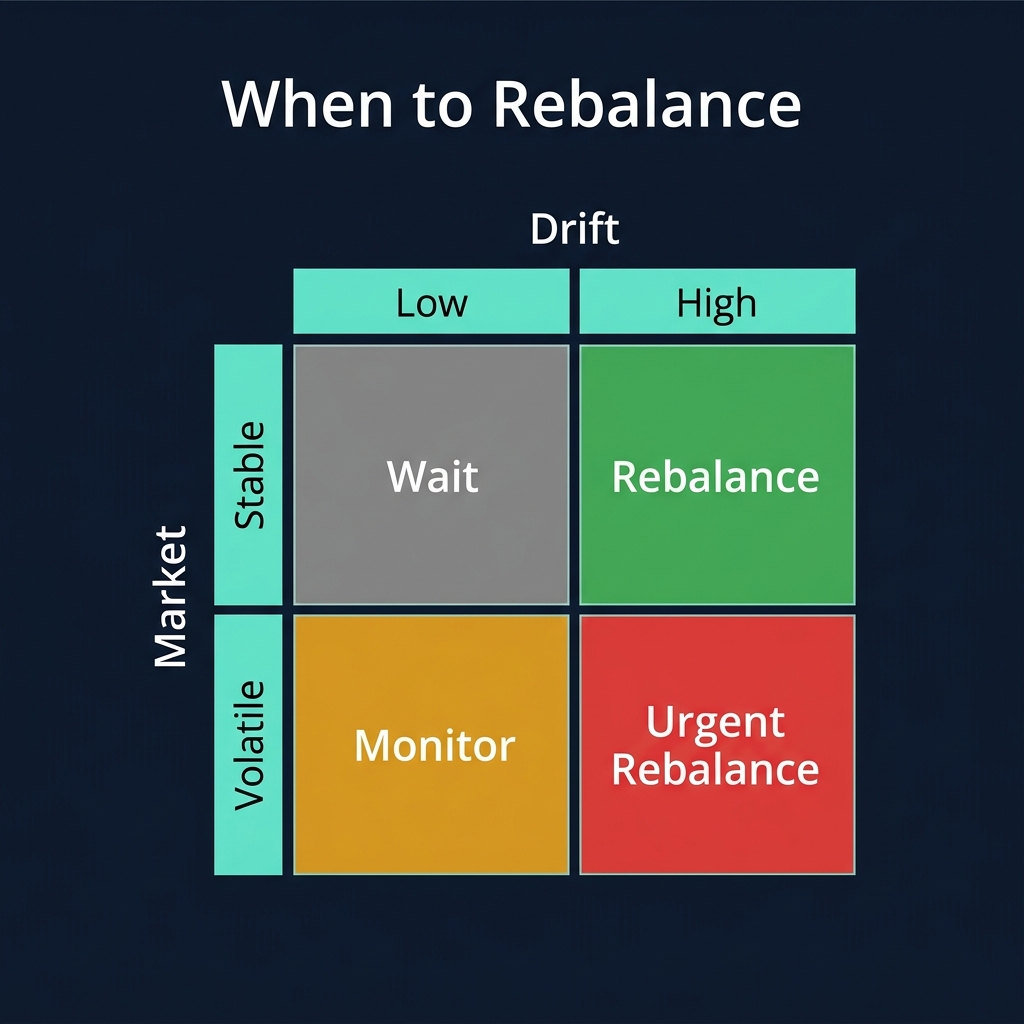
1. Which positions have drifted enough
   to warrant rebalancing? (>5% drift threshold)
2. Should I rebalance NOW or wait?
3. Tax-efficient rebalancing:
   sell winners or add to losers?
4. Given current market regime, should I
   shift target allocations?
5. What's the optimal stablecoin reserve now?
The Complete Risk Management Workflow on CoinXSight
CoinXSight is a crypto analytics platform that integrates this indicator with AI-powered confluence scoring:
Limitation: AI calculates risk mathematically but cannot account for exchange outages, smart contract exploits, delistings, or liquidity crises. Always hold a stablecoin reserve (minimum 20% of portfolio) as insurance against scenarios that no model can predict. CoinXSight's real-time alerts can notify you of unusual on-chain activity that might signal these events.
Quick-Reference Risk Rules
Rule
Threshold
CoinXSight Module
Max risk per trade
1-2% of portfolio
Position calculator
Max correlated exposure
3 positions in same sector
Deep Alpha
Confluence Score minimum
≥ 6/10 for full position
Deep Alpha
Stop loss method
ATR-based or structure-based
Chart Pro
Drawdown circuit breaker
Stop trading at -15% drawdown
Portfolio
Stablecoin reserve
≥ 20% of portfolio
Portfolio
Weekly risk audit
Every Sunday
All modules
FAQ
Can AI manage risk in crypto trading automatically?
AI (ChatGPT, Gemini) can calculate position sizes, model scenarios, and recommend risk parameters, but it cannot execute trades or monitor positions in real-time. Use AI for the analytical work (calculating risk, stress testing, designing stop strategies) and CoinXSight for real-time monitoring (Confluence Score changes, whale activity alerts, price alerts).
What is the ideal position size for crypto trades?
Risk 1-2% of your total portfolio per trade. For a $10,000 account, that's $100-200 maximum loss per trade. The exact position size depends on your stop loss distance: Position Size = (Account x Risk%) / Stop Distance%. AI can calculate this instantly when you provide your account data and stop level.
How do I use CoinXSight Confluence Score for risk management?
The Confluence Score reflects overall signal strength. Use it as a position size multiplier: at 8/10 take full position, at 6/10 take 60% position, below 5/10 skip the trade entirely. Also use it as a trailing indicator — if the Score drops below 4/10 while you're in a trade, consider reducing your position.
What should I do during a portfolio drawdown?
Follow the structured response: at 10% drawdown reduce position sizes by 50%, at 15% activate the circuit breaker (stop trading for 1 week minimum), and at 20% return to paper trading to validate your strategy still works. Use AI to calculate recovery timelines and identify whether the drawdown is normal variance or strategy failure.
How often should I rebalance my crypto portfolio?
Rebalance when any position drifts more than 5% from target allocation, or monthly (whichever comes first). During high-volatility periods, check weekly. Use AI to model whether rebalancing improves risk-adjusted returns for your specific portfolio composition.
Disclaimer: This article is for educational and informational purposes only and does not constitute financial, investment, or trading advice. Cryptocurrency markets are highly volatile and involve substantial risk of loss. No risk management strategy eliminates the possibility of losses — paper-trade or demo-trade before risking real capital. Position sizing calculations are illustrative and should be adapted to your personal financial situation. Always conduct your own research (DYOR) and consult a licensed financial advisor before making any investment decisions. CoinXSight provides analytical tools and data — not investment recommendations.
Which crypto trading platform is best for this indicator analysis?
CoinXSight offers this indicator alongside 12+ other trading indicators, AI-powered Confluence Scoring, and Smart Money Concepts u2014 making it a comprehensive crypto analytics platform for technical analysis.
KZ
Dr. Kevin Zhang
AI // QUANT LABS
Principal AI & Quantitative Researcher·Deep Alpha Engine Labs
Ph.D. in Computational Statistics. Leads machine learning architecture, regime-switching detection, and automated execution systems at CoinXSight Labs.
QUANTITATIVE SUITE // DEEP ALPHA ENGINEACTIVE
BTC/USDT // LIVE SCANNER
CONFLUENCE 93
LIVE SPOT PRICE$83,908.89STRONG_BUY
TP2
$89,725.68
+6.94%
TP1
$86,233.44
+2.77%
ENTRY
$83,905.28
ZONE
SL
$82,741.19
-1.39%
Auto-detect Order Blocks, Fair Value Gaps and risk-adjusted DCA ladders in < 5s.
Master risk management for crypto trading. Learn position sizing formulas, stop-loss strategies, and how CoinXSight's Portfolio module tracks your risk…