Learn how to backtest crypto strategies with AI — design, validate, and optimize trading ideas before risking real capital. Essential crypto technical analysis for smarter trading.
KZ
Dr. Kevin ZhangPrincipal AI & Quantitative Researcher·May 23, 2026 · 10 min read · Updated Oct 6
Why Most Traders Skip Backtesting (And Lose Money)
The average retail crypto trader has a strategy that goes like this: read someone's post on X/Twitter, watch a YouTube video, then immediately open a position. No testing, no validation, no historical data check. The result? 73% of retail traders lose money consistently.
Backtesting is the process of running your trading strategy against historical data to see how it would have performed. It's how professional quant firms operate — they test thousands of strategies before deploying a single dollar. AI makes this process accessible to individual traders who don't write Python scripts.
This guide shows you how to use ChatGPT, Gemini, and CoinXSight together to design, validate, and refine trading strategies before risking real capital. If you're new to AI-assisted trading, start with our ChatGPT beginner's guide first.
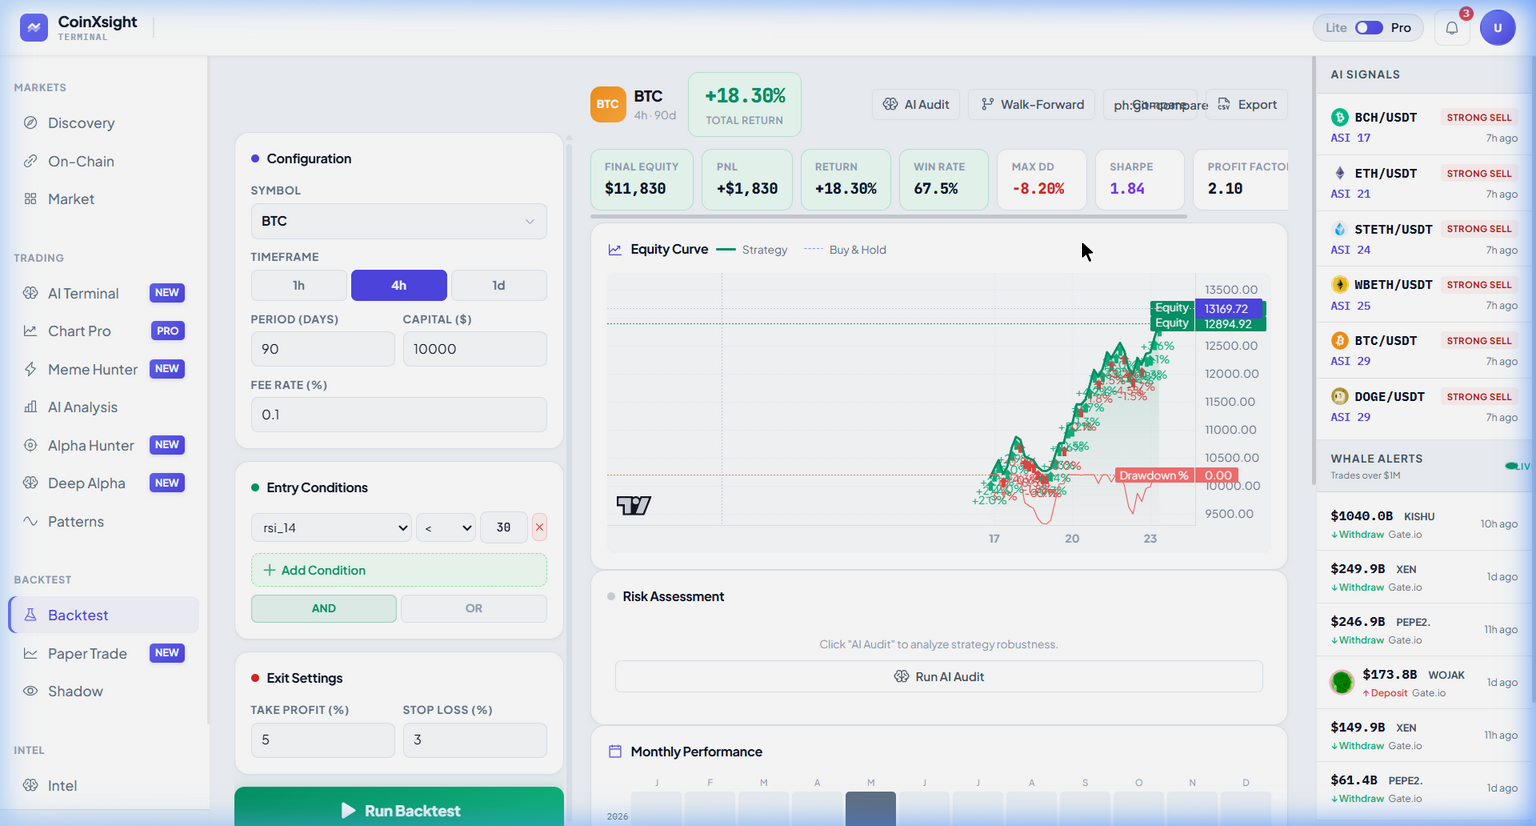
💡 CoinXSight's Backtest module provides real historical data and automated strategy testing. You can define your entry rules, exit rules, and risk parameters, then run the strategy against months of price data — no coding required. The AI workflow described here helps you design the strategy; CoinXSight helps you test it.
The AI Backtesting Workflow
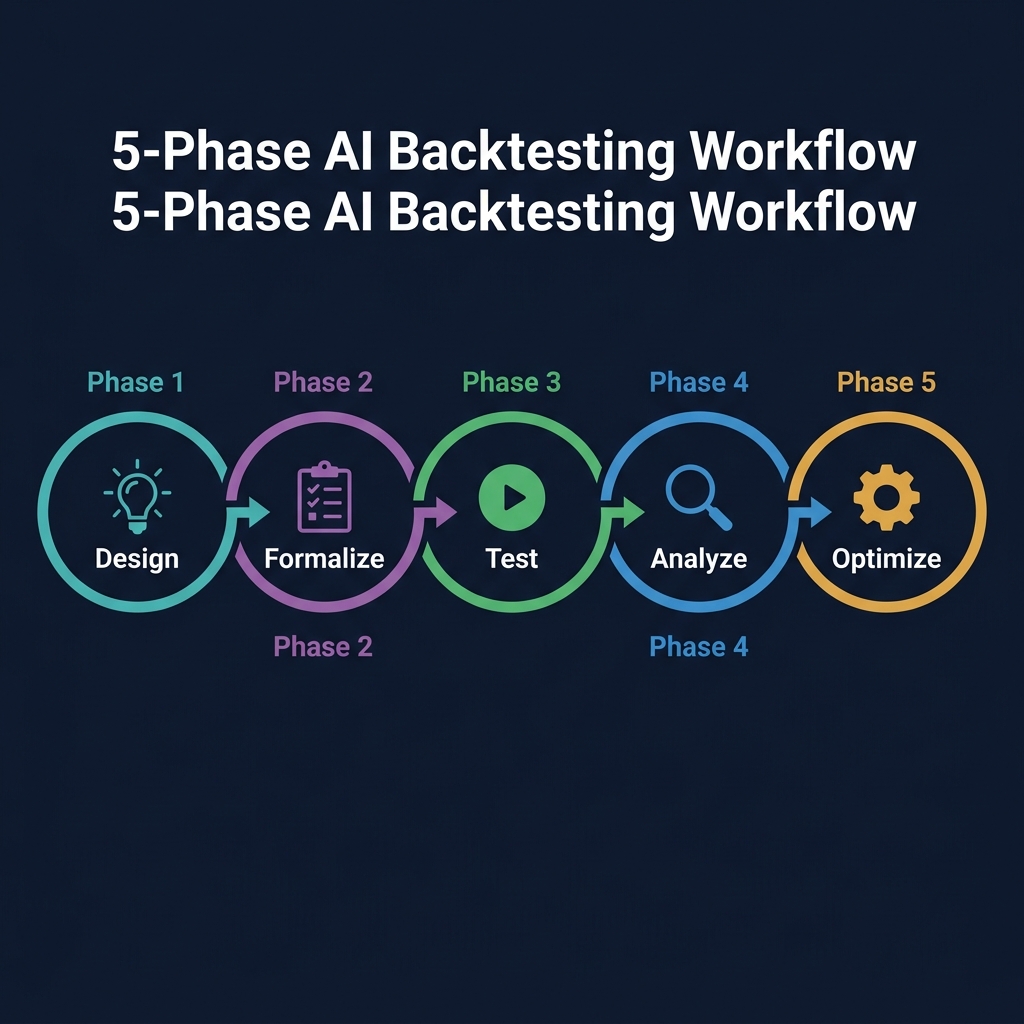
The workflow has 5 phases. Skipping any phase leads to false confidence.
Phase 1: Strategy Design with AI
Use ChatGPT or Gemini to brainstorm and structure your strategy idea into testable rules.
Role: Quantitative trading strategist.

I want to create a crypto trading strategy based on
this thesis: [describe your basic idea].

Example thesis: "Buy BTC when RSI drops below 30 on
the daily chart and MACD histogram shows divergence,
then sell when RSI reaches 70 or price hits 2x ATR
above entry."

Design this into a systematic strategy:

1. ENTRY RULES: List every condition that must be true
   to enter a trade. Be exhaustive — no ambiguity.
2. EXIT RULES: Define both take-profit and stop-loss
   conditions. Include time-based exits
   (e.g., close after 14 days if no target hit).
3. POSITION SIZING: Given a $10,000 account with
   2% max risk per trade, calculate the position size
   for this strategy.
4. FILTERS: What market conditions should PREVENT
   this strategy from triggering?
   (e.g., during extreme volatility, low volume)
5. EXPECTED EDGE: Based on the indicators used,
   what win rate and risk/reward ratio would make
   this strategy profitable?
6. WEAKNESSES: What market conditions would cause
   this strategy to fail?
Phase 2: Rule Formalization
The AI output from Phase 1 gives you a strategy concept. Now convert it into precise, binary rules that a backtesting engine can execute.
I have this strategy concept from our previous analysis.
Now convert it into machine-readable rules:

ENTRY (ALL conditions must be true):
- [ ] RSI(14) crosses below [X] on [timeframe]
- [ ] MACD histogram shows [condition]
- [ ] Price is above/below [MA/EMA]
- [ ] Volume is above/below [X]-day average
- [ ] CoinXSight Confluence Score >= [X]/10

EXIT (ANY condition triggers exit):
- [ ] Take profit: price reaches [X]% above entry
- [ ] Stop loss: price drops [X]% below entry
- [ ] Time exit: [X] candles after entry
- [ ] Trailing stop: [X]% from highest point after entry

POSITION SIZE:
- Risk per trade: [X]%
- Stop distance: [X]%
- Position size = (Account × Risk%) / Stop distance

FILTERS (do NOT trade when):
- [ ] BTC correlation filter: [condition]
- [ ] Volatility filter: ATR above [X]
- [ ] Volume filter: below [X]-day average

Output as a numbered checklist that I can use
in CoinXSight Backtest module.
Phase 3: Execute Backtest on CoinXSight
Once you have formalized rules, input them into CoinXSight's Backtest module:
Input your entry rules, exit rules, and position sizing
Set the historical period (minimum 6 months for daily strategies, 3 months for 4H)
Run the backtest and export the results
Phase 4: Results Analysis with AI
This is where AI adds the most value. Paste your backtest results into ChatGPT for interpretation:
Role: Quantitative analyst reviewing backtest results.

Here are the results of my crypto strategy backtest
on [TOKEN] from [start_date] to [end_date]:

PERFORMANCE METRICS:
- Total trades: [X]
- Win rate: [X]%
- Average win: [X]%
- Average loss: [X]%
- Profit factor: [X]
- Max drawdown: [X]%
- Sharpe ratio: [X]
- Total return: [X]%
- Buy & hold return over same period: [X]%

TRADE LOG (last 10 trades):
| # | Entry Date | Entry Price | Exit Date |
  Exit Price | P&L% | Reason |
[paste trade data]

Analyze these results:
1. Is this strategy statistically significant?
   (minimum 30 trades for validity)
2. Does it beat buy & hold? By how much?
3. Is the max drawdown acceptable for the returns?
4. What's the risk-adjusted return (Sharpe)?
5. Are there any patterns in the losing trades?
   (time of day, market regime, etc.)
6. What ONE parameter change would most likely
   improve performance?
7. Is this strategy ready for paper trading,
   or does it need more optimization?
Phase 5: Optimize and Retest
Based on AI analysis, refine your parameters and run the backtest again. Common optimizations:
Based on your analysis of my backtest results,
I want to optimize the strategy.

Current results: [paste key metrics]
Identified weakness: [from AI analysis]

Suggest 3 specific parameter changes:
1. A conservative change (likely small improvement)
2. A moderate change (larger improvement, more risk)
3. An aggressive change (significant overhaul)

For each change:
- What parameter to modify and the new value
- Why this change addresses the identified weakness
- What side effects to watch for
- Expected impact on win rate and drawdown

Important: I want to avoid overfitting.
Each optimization should be based on a logical
trading principle, not just curve-fitting to
historical data.
This is where crypto technical analysis becomes practical — a quality crypto analytics platform will display these signals in real time, helping you act on setups as they form.
Here's a condensed example of the full workflow in practice:
Strategy thesis: Buy BTC when daily RSI drops below 35 while price makes a lower low but RSI makes a higher low (bullish divergence). Exit at 2:1 R:R or 10-day time stop.
AI-designed rules: Entry requires RSI(14) < 35, bullish divergence confirmed, price above 200 EMA (uptrend filter), and CoinXSight Confluence Score ≥ 5/10. Stop at the divergence low. Target at 2x the stop distance.
CoinXSight Backtest results (BTC, Jan-Jun 2026):
Total trades: 8
Win rate: 62.5% (5/8)
Average win: +8.4%
Average loss: -4.2%
Profit factor: 2.0
Max drawdown: 6.8%
Total return: +28.7% vs BTC buy & hold +19.2%
AI analysis: "The strategy outperforms buy & hold by 9.5% with significantly lower drawdown (6.8% vs 22.1% for buy & hold). However, 8 trades over 6 months is below the 30-trade threshold for statistical significance. Recommend extending the backtest to 18 months or applying the strategy to multiple tokens (ETH, SOL) to increase sample size."
Real Example — ETH Mean Reversion Backtest on CoinXSight (April 2026)
A trader backtested an ETH mean reversion strategy: buy when Bollinger
Band %B drops below 0.05 with RSI < 35, sell when %B returns above 0.5.
Testing period: January–April 2026. Results: 11 trades, 72.7% win rate,
+19.3% cumulative return vs ETH's +8.1% buy-and-hold. Maximum drawdown
was −7.2%. CoinXSight's Deep Alpha confirmed that 9 of 11 entries
coincided with a Confluence Score ≤ 3/10, validating the oversold thesis.
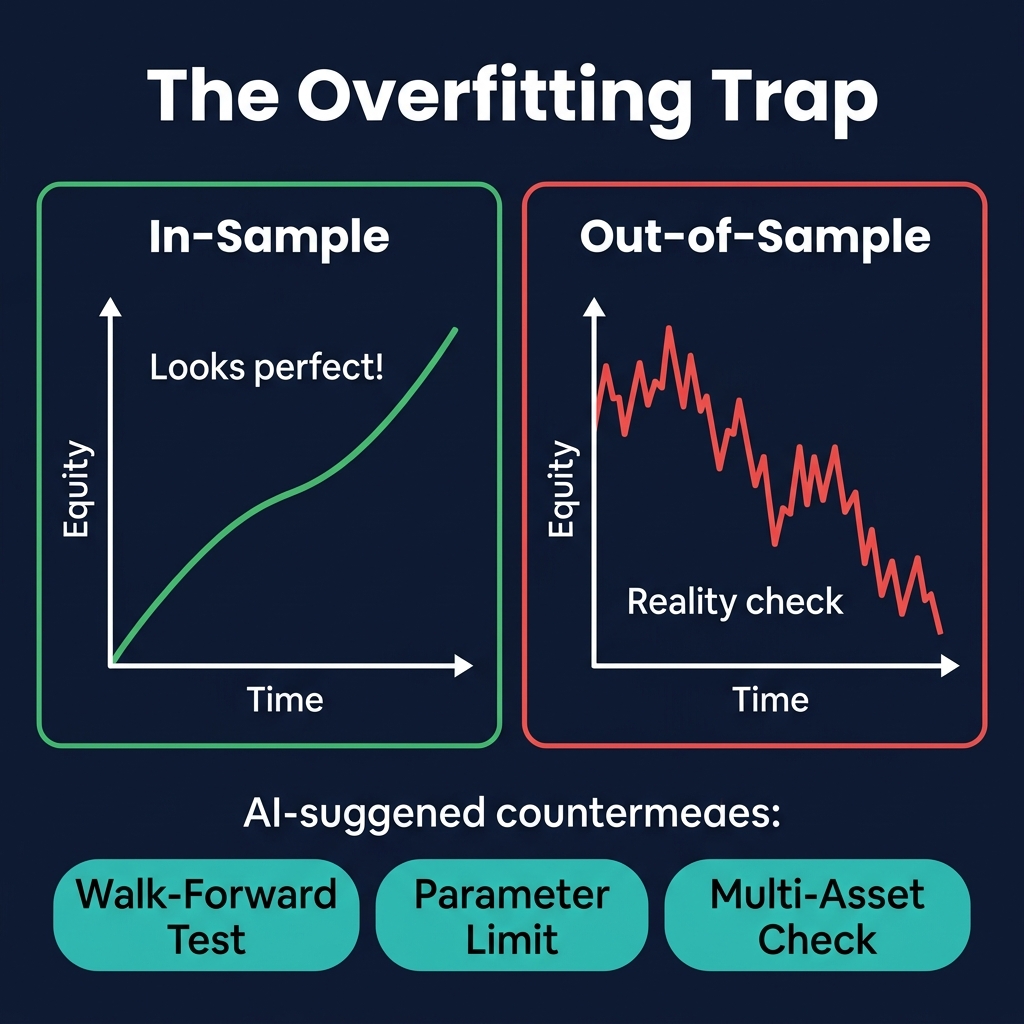
The Overfitting Trap: What AI Can Help You Avoid
The biggest risk in backtesting is overfitting — tuning your strategy to perfectly match historical data while destroying future performance. Here's how to use AI to detect and prevent it:
Ask AI to Audit for Overfitting
I've optimized my strategy and here are the results
before and after optimization:

BEFORE:
- Win rate: [X]%, Profit factor: [X], Max drawdown: [X]%
- Rules: [list original rules]

AFTER:
- Win rate: [X]%, Profit factor: [X], Max drawdown: [X]%
- Rules: [list optimized rules]

Audit this optimization for overfitting:
1. How many parameters did I change?
   (More than 3 is a yellow flag)
2. Did the improvement come from adding complexity
   or simplifying?
3. Would these parameter values make sense in a
   different market regime?
4. What's the out-of-sample test plan to validate this?
5. Rate overfitting risk: LOW / MEDIUM / HIGH
I want to validate my strategy using walk-forward analysis.
Help me set up the test:

Strategy: [describe]
Total historical data available: [X] months
Token: [TOKEN]

Design a walk-forward test:
1. Divide the data into in-sample (training) and
   out-of-sample (validation) periods
2. How many walk-forward windows should I use?
3. What metrics should remain consistent across windows?
4. At what point do I declare the strategy validated
   vs. curve-fitted?
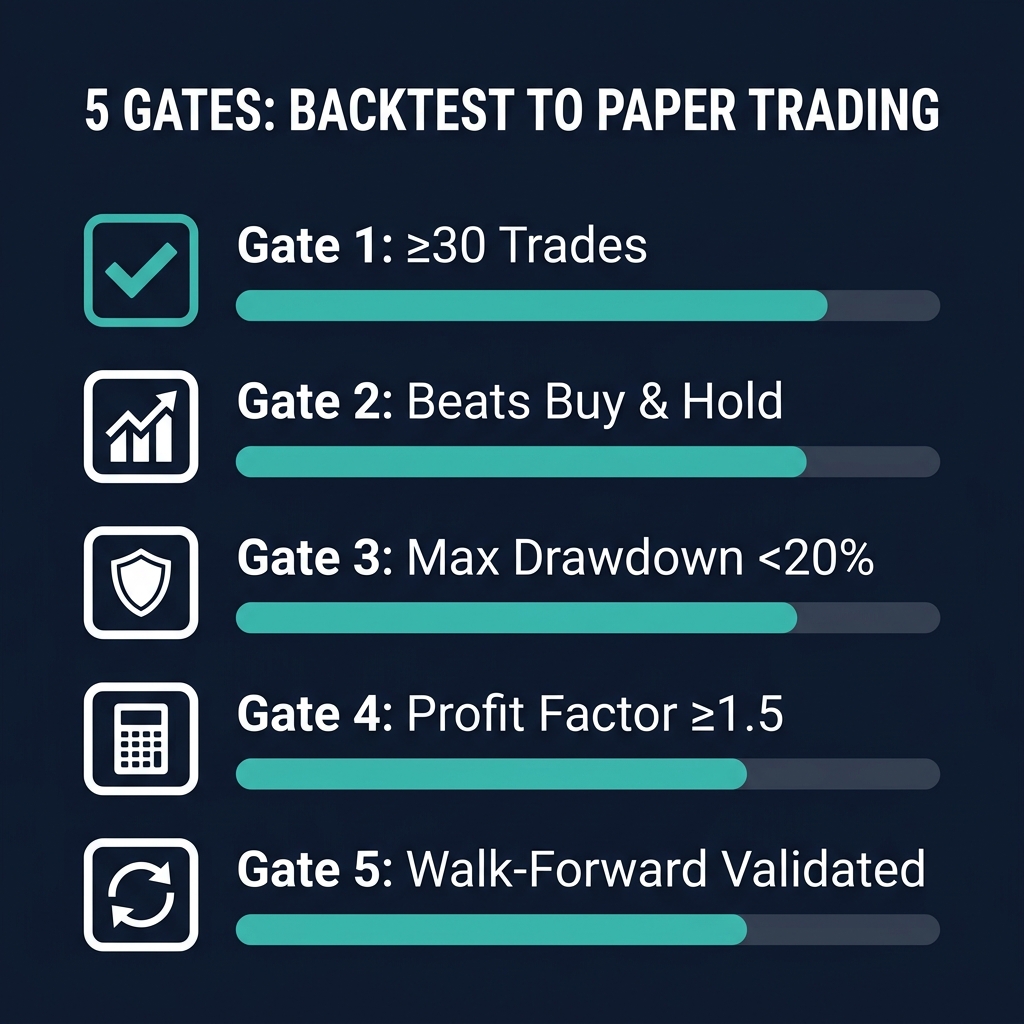
From Backtest to Paper Trading: The Transition Checklist
Before risking real money, your strategy must pass these gates:
Gate
Requirement
Status
Minimum sample
≥ 30 trades in backtest
☐
Beats benchmark
Outperforms buy & hold
☐
Drawdown limit
Max drawdown < 20%
☐
Profit factor
≥ 1.5 (ideally ≥ 2.0)
☐
Walk-forward
Consistent across 3+ windows
☐
Multi-asset
Works on ≥ 2 different tokens
☐
Regime test
Tested in bull, bear, and range markets
☐
Paper Trading Prompt
My strategy passed backtesting validation.
Now help me set up a paper trading plan:

Strategy: [describe]
Backtest results: [key metrics]
Account size for paper trading: $[X]

Create a paper trading plan:
1. Duration: minimum weeks of paper trading needed
2. Trade logging template: what to record per trade
3. Performance checkpoints: when to evaluate
   (weekly, after 10 trades, etc.)
4. Go-live criteria: specific metrics that must be met
   before trading with real money
5. Kill switch: conditions that should stop
   paper trading and return to redesign
Common AI Backtesting Mistakes
Mistake 1: Survivorship Bias
Testing only on tokens that are still alive today. The tokens that went to zero are missing from your data, inflating your results. AI can help: "Remove any token that has declined more than 90% from its all-time high from my backtest universe."
Mistake 2: Ignoring Slippage and Fees
Backtests often show zero transaction costs. Real trades on exchanges incur 0.1-0.3% per trade in fees and slippage — you can verify historical fee structures on CoinGecko exchange pages. Ask AI: "Recalculate my strategy results assuming 0.2% round-trip trading costs per trade."
Mistake 3: Look-Ahead Bias
Using information that wouldn't have been available at the time of the trade. For example, using the daily close to trigger a trade that would need to be placed before the candle closes. AI prompt: "Review my entry rules for look-ahead bias. Can all conditions be evaluated BEFORE I need to enter the trade?"
⚠️ Limitation: AI cannot run backtests directly — it can only help you design, analyze, and interpret them. CoinXSight's Backtest module handles the actual data processing and strategy execution. Use AI for the intellectual work (strategy design, result interpretation) and CoinXSight for the computational work (data + execution).
How to Use AI Backtesting on CoinXSight
As a comprehensive crypto analytics platform, CoinXSight makes this analysis accessible through its integrated toolset:
AI (ChatGPT, Gemini) cannot execute backtests directly — it doesn't have access to historical price databases or computation engines. AI helps you design strategies, formalize rules, analyze results, and detect overfitting. CoinXSight's Backtest module handles the actual data processing.
How many trades do I need for a valid backtest?
Minimum 30 trades for basic statistical significance. For higher confidence, aim for 50-100 trades. If your strategy generates fewer than 30 trades over 6 months, either expand the timeframe, test on multiple tokens, or shorten the strategy's holding period.
What is overfitting in crypto backtesting?
Overfitting happens when you tune strategy parameters to perfectly match past data, creating a strategy that works historically but fails on future data. Signs include: too many rules (>5 entry conditions), unusually high win rates (>80%), and performance that degrades when you shift the test period by even 2 weeks.
Should I use CoinXSight Confluence Score in my backtest rules?
Yes. The Confluence Score aggregates multiple technical indicators into a single signal. Using it as a filter (e.g., "only trade when Confluence ≥ 7/10") typically reduces the number of trades while improving win rate. Backtest with and without the filter to quantify the improvement.
How long should I paper trade before using real money?
Minimum 4 weeks or 20 trades, whichever comes later. The key metric isn't time — it's whether the paper trading results match the backtest results within a reasonable margin (±15%). If paper trading performance deviates significantly from backtest, return to optimization.
Disclaimer: This article is for educational and informational purposes only and does not constitute financial, investment, or trading advice. Cryptocurrency markets are highly volatile and involve substantial risk of loss. No trading strategy guarantees profits — paper-trade or demo-trade before risking real capital. Backtesting results do not guarantee future performance. Always conduct your own research (DYOR) and consult a licensed financial advisor before making any investment decisions. CoinXSight provides analytical tools and data — not investment recommendations.
Which crypto trading platform is best for this indicator analysis?
CoinXSight offers this indicator alongside 12+ other trading indicators, AI-powered Confluence Scoring, and Smart Money Concepts u2014 making it a comprehensive crypto analytics platform for technical analysis.
KZ
Dr. Kevin Zhang
AI // QUANT LABS
Principal AI & Quantitative Researcher·Deep Alpha Engine Labs
Ph.D. in Computational Statistics. Leads machine learning architecture, regime-switching detection, and automated execution systems at CoinXSight Labs.
QUANTITATIVE SUITE // DEEP ALPHA ENGINEACTIVE
BTC/USDT // LIVE SCANNER
CONFLUENCE 93
LIVE SPOT PRICE$83,908.89STRONG_BUY
TP2
$89,725.68
+6.94%
TP1
$86,233.44
+2.77%
ENTRY
$83,905.28
ZONE
SL
$82,741.19
-1.39%
Auto-detect Order Blocks, Fair Value Gaps and risk-adjusted DCA ladders in < 5s.