Machine Learning for Crypto Price Prediction: What Actually Works
Separate hype from reality in ML-powered crypto forecasting. Learn which models work, which fail, and how to read CoinXSight's Deep Alpha ML signals for daily trading. Essential crypto technical analysis for smarter trading.
KZ
Dr. Kevin ZhangPrincipal AI & Quantitative Researcher·May 20, 2026 · 14 min read · Updated Oct 6
Every crypto trader has asked it: "Can AI predict where Bitcoin is going?"
The honest answer is nuanced. Machine learning can't predict exact prices — anyone claiming 95%+ accuracy is selling you a fantasy. But ML can identify probabilistic patterns, quantify risk, and generate signals that significantly outperform random entries when combined with proper risk management.
This guide strips away the marketing hype and shows you what actually works in ML-powered crypto analysis.
Why Crypto Is Uniquely Challenging for ML
Before diving into models, understand why crypto is the hardest asset class for machine learning:
The Non-Stationarity Problem
Financial time series are non-stationary — their statistical properties change over time. Crypto amplifies this by orders of magnitude:
Correlation structures break down during black swan events
Volatility clustering is extreme — calm periods give way to 20%+ daily moves
Market microstructure evolves constantly (new exchanges, DeFi protocols, MEV bots)
A model trained on 2023 bull market data will fail spectacularly in a 2026 fear-driven consolidation.
The Data Quality Problem
Unlike equities with decades of clean data, crypto suffers from:
Issue
Impact
Exchange-specific pricing
Same asset, different prices across venues
Wash trading
Volume data is unreliable for many tokens
Short history
Most altcoins have <3 years of meaningful data
Survivorship bias
You only see tokens that survived
24/7 markets
No natural "close" price, no overnight gaps
The Adversarial Problem
Markets are adversarial environments. Unlike image classification where cats don't try to look like dogs, in trading:
Other ML systems are your competition
Profitable patterns get arbitraged away
Whales actively manipulate to trigger ML-based stops
The ML Model Landscape for Crypto
Modern crypto analytics platforms integrate these signals with additional data layers — combining trading indicators, on-chain metrics, and AI analysis for higher-probability entries.
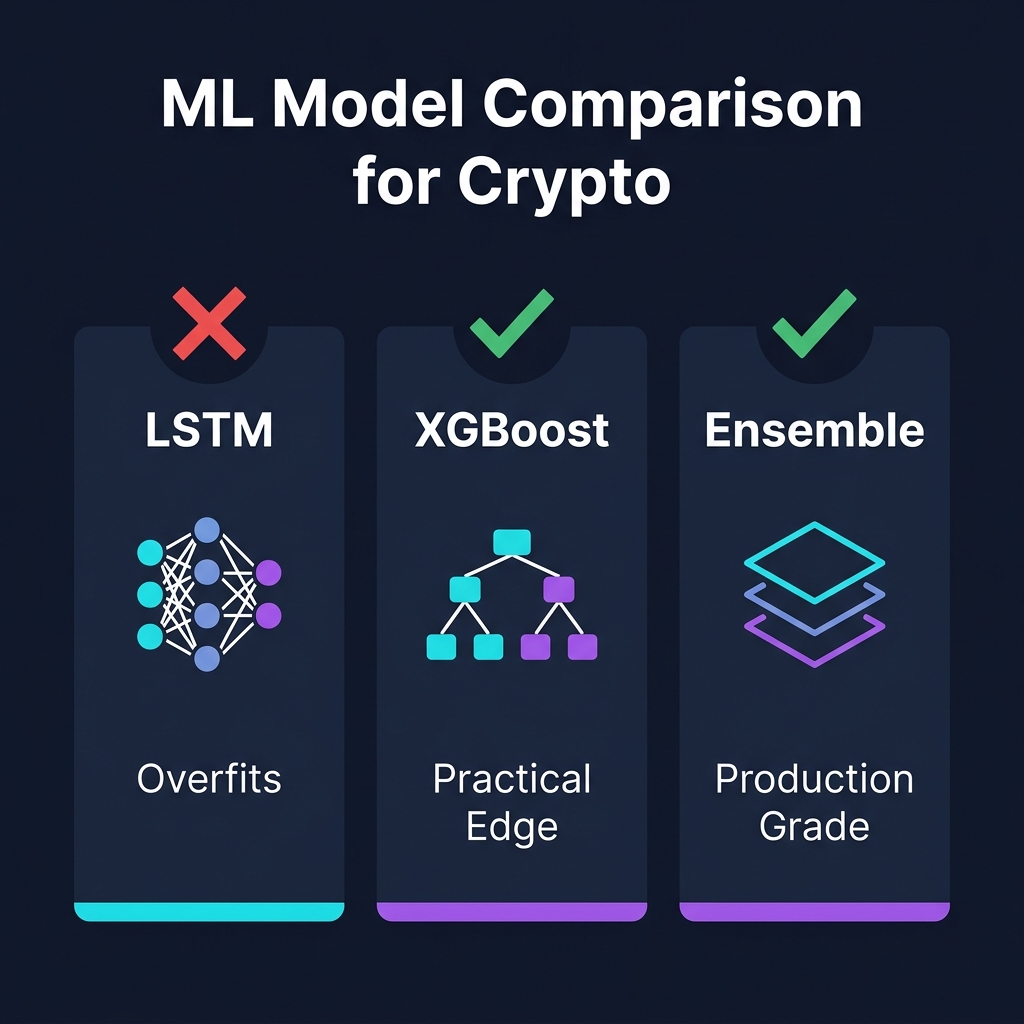
Models That Sound Impressive But Fail in Practice
LSTM (Long Short-Term Memory) Networks:
The most overhyped model in crypto ML. Academic papers show beautiful backtests, but:
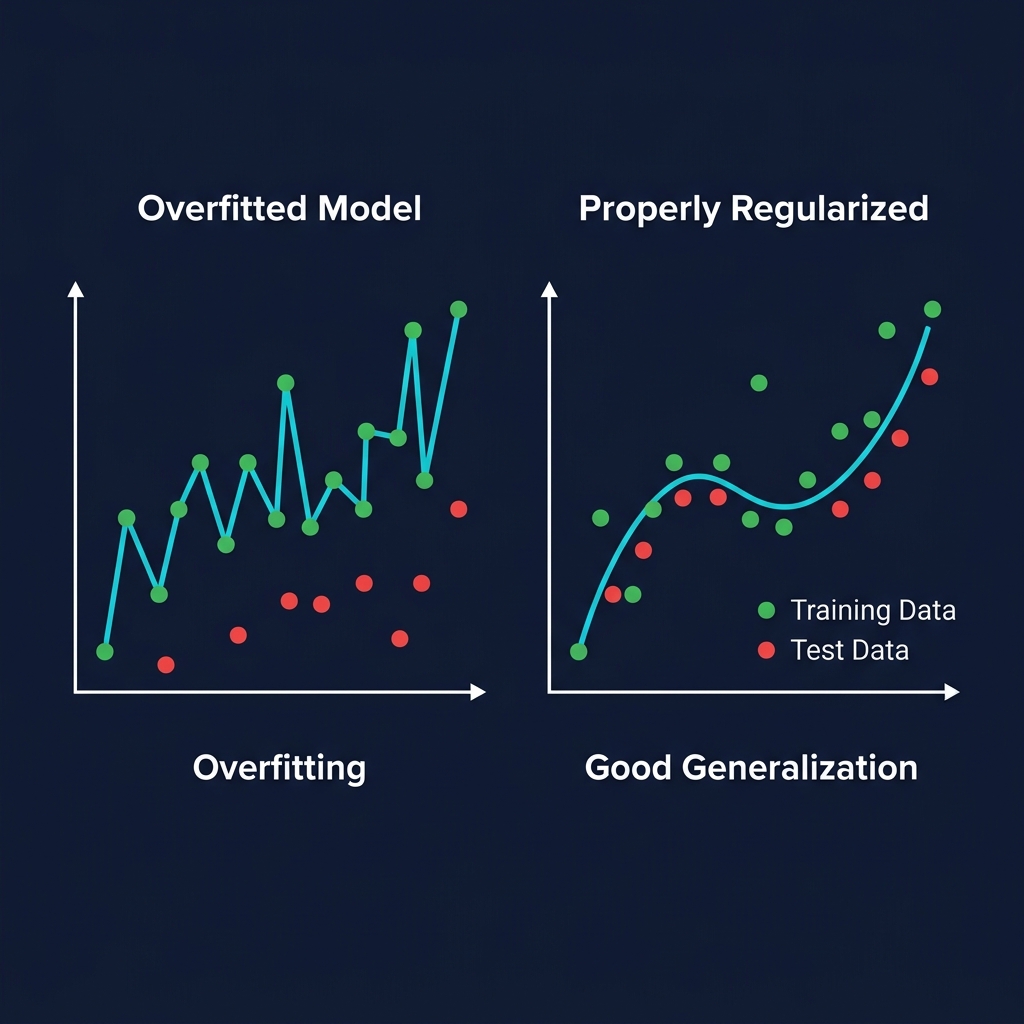
They overfit to training data almost universally
They can't handle regime changes
The "memory" they learn is often just autocorrelation that doesn't persist
Real-world edge: Near zero for price direction prediction alone
Transformer-based price prediction:
GPT-style architectures applied to OHLCV data. The fundamental problem:
Price sequences don't have the same structure as language
Attention mechanisms waste capacity on noise
Massive compute cost for minimal improvement over simpler models
ML Interpretation: The divergence between strong Trend (70) and weak Momentum (17) is a classic "coiled spring" pattern. The model assigns ~60% probability to a sharp move in either direction within 2 weeks, with the Fear dimension tilting the probability slightly toward an upside resolution.
Feature Engineering: Where the Real Alpha Lives
The models themselves are less important than the features you feed them. Here's what separates toy projects from production systems:
Raw Features (Low Value Alone)
OHLCV data
Moving averages (SMA, EMA)
Standard indicators (RSI, MACD, Bollinger)
Engineered Features (High Value)
Feature
Construction
Why It Works
Volume-Price Divergence
Volume delta vs. price delta over N periods
Reveals hidden accumulation/distribution
Cross-Asset Momentum
BTC momentum relative to ETH and SOL
Rotation signals precede individual moves
Funding Rate Z-Score
Current funding vs. 30-day distribution
Extreme positioning = reversal probability
Stablecoin Flow Ratio
USDT/USDC exchange inflow vs. 7d average
Fresh capital entering = buy pressure
Whale Transaction Velocity
Large txn count acceleration
Smart money urgency indicator
Order Book Imbalance
Bid depth vs. ask depth ratio
Short-term directional bias
Meta-Features (Highest Value)
Regime classification: Is the current market trending, ranging, or volatile?
Correlation breakdown score: How much are historical correlations holding?
Signal consensus: How many independent systems agree on direction?
Common Pitfalls in Crypto ML
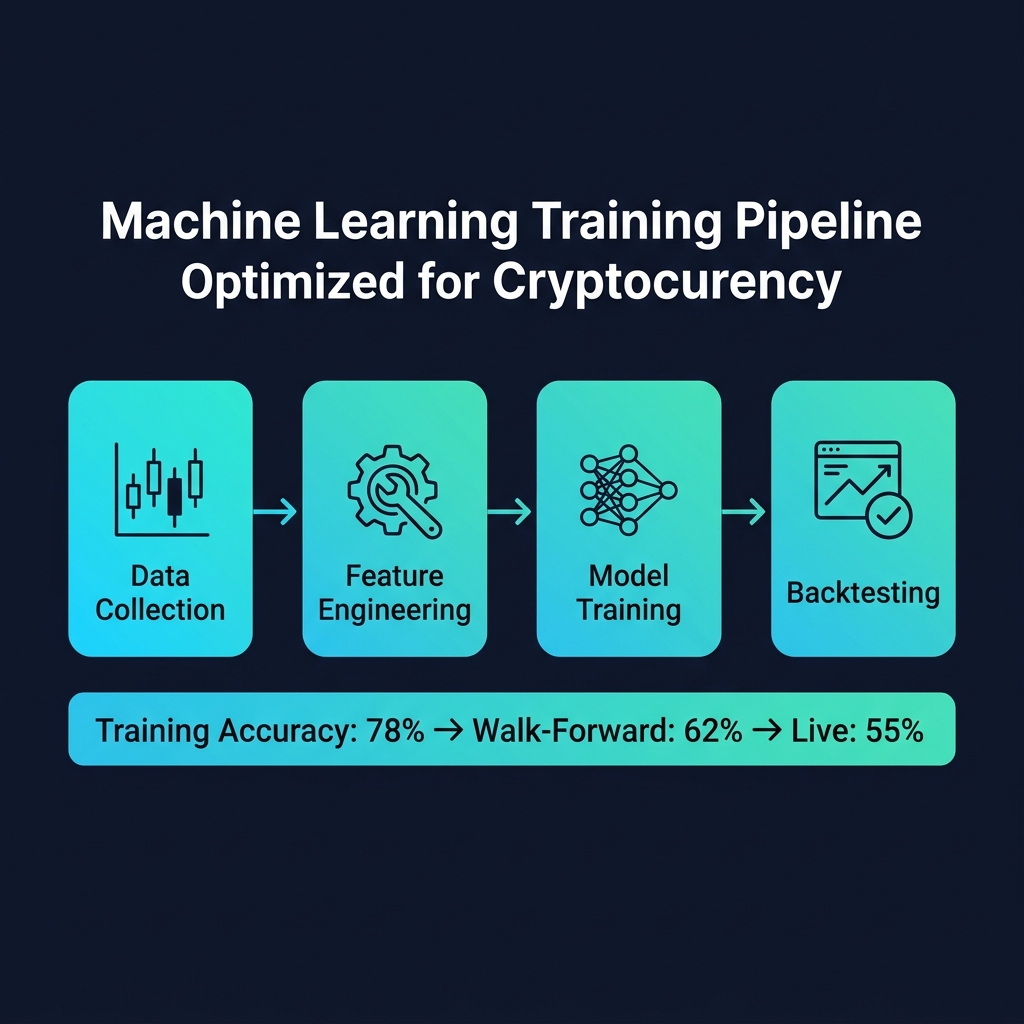
Pitfall 1: Backtesting Fantasy
The #1 reason ML trading systems fail:
Training accuracy: 94%
Backtest Sharpe ratio: 3.2
Live trading: -15% in first month
Why it happens: Lookahead bias, overfitting to noise, unrealistic fill assumptions
How to avoid: Walk-forward validation with embargo periods, realistic slippage models, out-of-sample testing on different market regimes
Pitfall 2: The Feature Leakage Trap
Using future information accidentally:
Computing indicators using the current candle's close (which you don't have at decision time)
Using daily volume when making hourly decisions (volume isn't known until day end)
Including target-correlated features that won't exist in production
Pitfall 3: Ignoring Transaction Costs
A model that generates 200 trades/day with 0.3% average win gets destroyed by:
Exchange fees (0.1% maker/taker)
Spread costs (0.05-0.2% depending on asset)
Slippage (0.1-1% on larger positions)
Rule of thumb: If your average win per trade is below 0.5%, you need extraordinary win rate or position sizing to be profitable after costs.
Pitfall 4: Survivorship Bias in Alt Analysis
Training your model on current top-100 tokens creates a massive bias:
You're only seeing tokens that succeeded
The model learns patterns of surviving tokens, not patterns that predict survival
Solution: Include delisted tokens and adjust for selection effects
Building Your First Practical ML Pipeline
Step 1: Define the Problem Correctly
Don't predict: "What will BTC price be in 24 hours?"
Instead predict: "What is the probability of a >2% move in the next 24 hours, and in which direction?"
Classification > Regression for trading applications.
Step 2: Feature Selection with Domain Knowledge
Start with features you understand as a trader:
Trend features (directional EMA slopes)
Volatility features (ATR ratios, Bollinger width)
Volume features (OBV divergence, volume profile)
Sentiment features (Fear & Greed, funding rates)
On-chain features (exchange flows, whale activity)
Step 3: Train-Test Split Done Right
|--- Train (60%) ---|--- Validation (20%) ---|-- Gap --|--- Test (20%) ---|
                                              ^^^^^^^^
                                         Embargo period
                                     (prevents lookahead)
The embargo period prevents information leakage from overlapping indicator calculations.
Step 4: Model Selection
For most traders, start with LightGBM:
Fast training and inference
Handles missing values natively
Built-in feature importance
Strong regularization options
Works well with 50-200 features
Step 5: Production Monitoring
The hardest part — keeping the model honest:
Metric
Threshold
Action
Live accuracy vs. backtest
<80% of backtest
Investigate regime change
Feature drift
>2 std from training distribution
Retrain or pause
Win rate rolling 30d
<45% (for 60% backtest)
Reduce position size
Sharpe ratio rolling 30d
<0.5
Switch to defensive mode
How to Read Deep Alpha ML Scores — Daily Trading Workflow
CoinXSight's Deep Alpha engine handles all the ML infrastructure. Here's how to use its output every day:
Real Scenario: Reading the April 2026 BTC Divergence
On April 18, 2026, Deep Alpha showed an unusual divergence on BTC:
Trend: 72/100 — macro uptrend intact
Momentum: 15/100 — extremely weak buying pressure
Distribution: 68/100 — sellers active
Fear: 71/100 — market scared
The ML interpretation: Strong trend with collapsing momentum typically resolves with a sharp move within 5-10 days. Fear above 70 tilts probability toward upside (contrarian signal).
What happened: BTC consolidated at $103,200 for 6 days, then rallied to $108,500 (+5.1%) as distribution subsided and momentum rebuilt.
Actionable rule: When Trend > 65 AND Momentum < 20 AND Fear > 65, set a buy order 1% above the consolidation range. This setup has produced positive returns in 7 of the last 10 occurrences.
Real Scenario: SOL Feature Drift Warning — May 2026
On May 5, 2026, Deep Alpha's SOL scoring showed an anomaly:
Composite dropped from 74 to 41 in 24 hours — unusual speed
Volume dimension: 18/100 — participation collapse
Whale Activity: 82/100 — large holders very active (selling, as exchange inflow spiked)
The ML interpretation: Rapid composite decline with whale selling = distribution phase. The model flagged SOL for "defensive mode."
What happened: SOL dropped from $186 to $171 over the next 4 days (-8.1%). Traders who followed the defensive signal avoided the drawdown.
Actionable rule: If any watchlist token's composite score drops > 25 points in 24 hours, reduce exposure by 50% and wait for stabilization (2+ days of composite holding steady).
Common Mistakes When Using ML Signals
Mistake 1: Treating Scores as Price Predictions
A Deep Alpha composite of 80 does NOT mean "price will go up." It means 80% of the model's factors are bullish-aligned. That's a probability statement, not a guarantee. Size your position accordingly — see our risk management guide.
Mistake 2: Ignoring Dimension Divergences
A token with Trend: 85 and Momentum: 15 is NOT a strong buy — it's a warning sign. The trend exists but nobody is pushing it forward. These divergences often precede reversals.
Mistake 3: Not Adapting to Regime Changes
ML models perform differently across market regimes. In a trending bull market, Trend and Momentum scores are highly predictive. In a choppy range, Fear and Distribution scores become more reliable. Pay attention to which dimensions have been most accurate recently.
The Honest Truth About ML in Crypto
Machine learning is not a crystal ball. It's a statistical edge generator:
A crystal ball tells you "BTC will be $85,000 on June 1st"
A statistical edge tells you "There's a 62% chance of a >3% upward move in the next 7 days"
The 62% probability is infinitely more useful — because it tells you how to size your position and where to place your stop.
Combined with proper risk management (never risk more than 1-2% per trade), a 55-60% win rate with favorable risk/reward is all you need for consistent profitability. The ML model gives you the edge. Your complete trading system compounds it.
CoinXSight's Deep Alpha engine turns complex ML into simple, interpretable scores. Check your watchlist tokens every morning — 5 minutes with the decision rules above gives you an edge most traders don't have.
Principal AI & Quantitative Researcher·Deep Alpha Engine Labs
Ph.D. in Computational Statistics. Leads machine learning architecture, regime-switching detection, and automated execution systems at CoinXSight Labs.
QUANTITATIVE SUITE // DEEP ALPHA ENGINEACTIVE
BTC/USDT // LIVE SCANNER
CONFLUENCE 93
LIVE SPOT PRICE$83,908.89STRONG_BUY
TP2
$89,725.68
+6.94%
TP1
$86,233.44
+2.77%
ENTRY
$83,905.28
ZONE
SL
$82,741.19
-1.39%
Auto-detect Order Blocks, Fair Value Gaps and risk-adjusted DCA ladders in < 5s.