Crypto Chart Patterns: The Complete 2026 Trading Guide
Master 12 classical chart patterns for crypto trading. Head and shoulders, triangles, wedges, flags with target formulas and real BTC, ETH, SOL examples.
MC
Marcus ChenSenior Quantitative Strategist·Jun 6, 2026 · 22 min read · Updated Oct 6
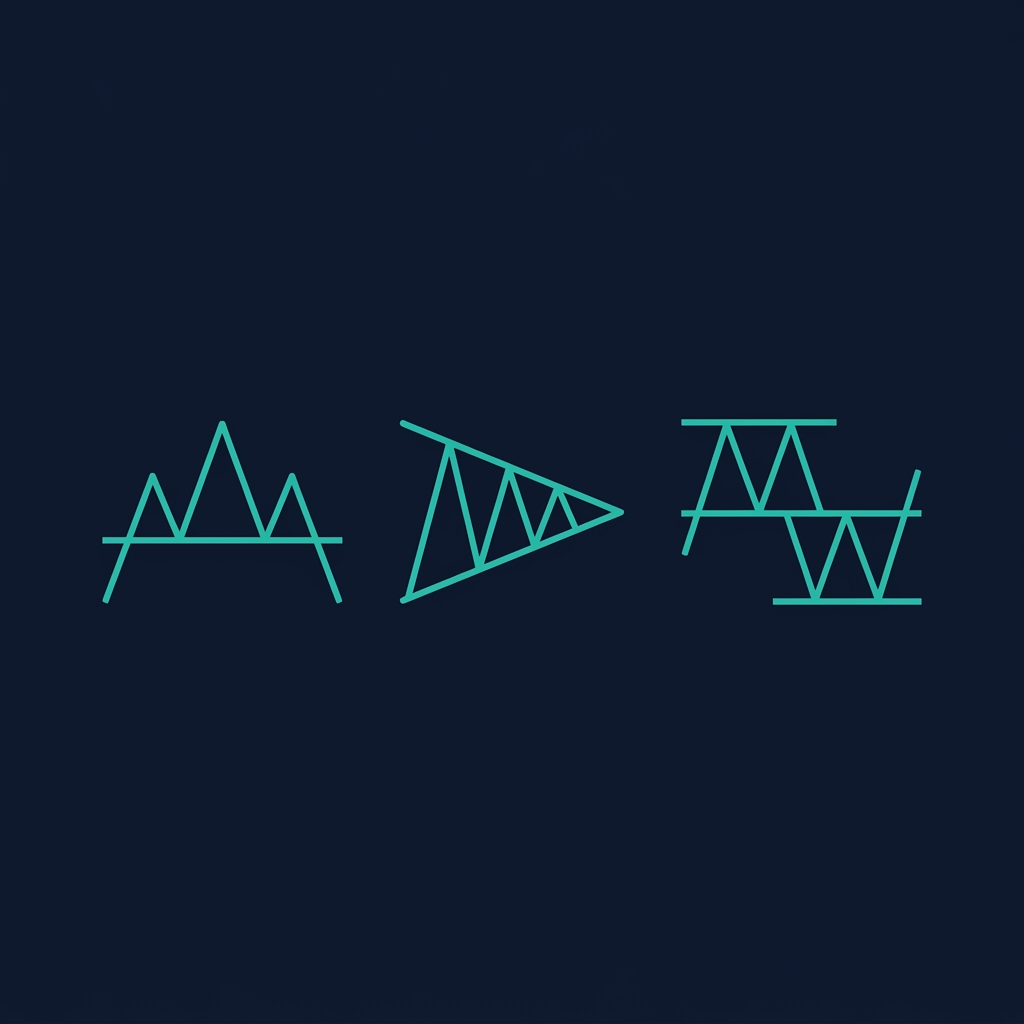
Classical chart patterns are multi-candle geometric formations — shapes like triangles, head and shoulders, and wedges — that develop over hours, days, or weeks on a price chart. They represent the collective psychology of thousands of traders negotiating between supply and demand, and when they resolve, they produce some of the most reliable and measurable moves in crypto trading.
If you've already studied candlestick patterns (single or multi-candle formations like hammers and engulfing patterns) or harmonic patterns (Fibonacci-ratio-based XABCD structures), classical chart patterns occupy different territory entirely. Candlestick patterns tell you what happened in 1–3 candles. Harmonic patterns require precise mathematical ratios. Classical chart patterns describe the broader structural story — they show you accumulation, distribution, continuation, and exhaustion as they unfold over dozens or hundreds of candles.
In 2026's institutional crypto market — with BTC trading around $105,000, ETH near $2,800, and SOL at $170 — these patterns remain foundational. Algorithmic trading desks, quantitative funds, and retail traders all watch the same shapes. That shared attention is precisely what gives chart patterns their power: enough participants act on the same formation to make it self-fulfilling.
💡 CoinXSight's Chart Pro module provides the drawing tools and multi-timeframe views you need to identify and measure classical chart patterns. The Deep Alpha dashboard adds volume and momentum confirmation to validate breakouts before you commit capital.
Why Chart Patterns Still Work in 2026
Three forces keep classical chart patterns relevant in modern crypto:
Self-fulfilling prophecy — Millions of traders recognize the same formations. When a head and shoulders neckline breaks on BTC, enough participants sell to make the measured move target hit. This reflexive dynamic is even stronger in crypto, where retail participation is high and information spreads instantly.
Institutional order flow — In 2026, institutional participants (ETF managers, crypto-native funds, prop desks) use algorithmic systems that incorporate pattern recognition. When a symmetrical triangle forms on the ETH 4H chart, algorithmic orders cluster at the apex and breakout levels. This concentrates liquidity at exactly the levels chart pattern traders watch.
Market structure hasn't changed — Despite AI tools, on-chain analytics, and increasingly sophisticated smart money concepts, markets still cycle through accumulation → markup → distribution → markdown. Chart patterns are visual representations of these phases. A double top is distribution. A cup and handle is re-accumulation. The labels are different, but the dynamics are identical.
Reversal patterns signal that the prevailing trend is losing momentum and a directional change is likely. They form at the end of extended moves — at resistance after uptrends, at support after downtrends.
Critical rule: A reversal pattern is only valid if there is a prior trend to reverse. A head and shoulders at the top of a 30% rally is meaningful. The same shape in the middle of a choppy range is just noise.
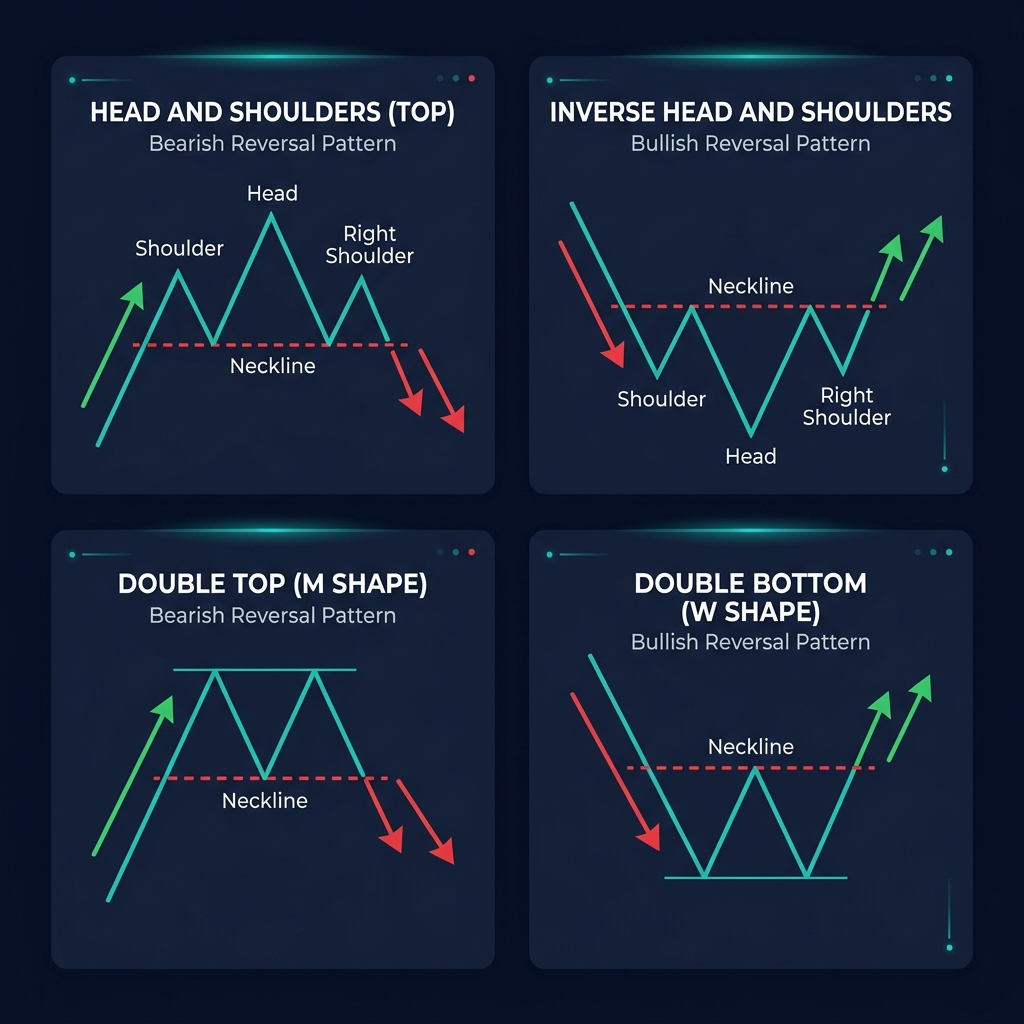
Head and Shoulders
The head and shoulders is the most widely recognized reversal pattern — and for good reason. It has the clearest structure, the most objective confirmation criteria, and one of the highest completion rates among classical patterns.
Structure:
Left Shoulder: Price rallies to a swing high, then pulls back
Head: Price rallies higher than the left shoulder (making a new high), then pulls back again
Right Shoulder: Price rallies again but fails to reach the head's high, then declines
Neckline: The line connecting the two pullback lows (between left shoulder/head and head/right shoulder)
Confirmation: The pattern is confirmed only when price closes below the neckline with above-average volume. A wick below the neckline that closes back above is not a valid break.
Measure the distance from the top of the head to the neckline. Subtract that distance from the neckline breakpoint.
2026 BTC Example:
BTC formed a head and shoulders on the 4H chart between May 8–22, 2026:
Left shoulder: $108,200
Head: $111,400
Right shoulder: $107,800
Neckline: ~$104,500
The neckline broke on May 22 with volume 1.8x the 20-period average. Pattern height: $111,400 – $104,500 = $6,900. Measured move target: $104,500 – $6,900 = $97,600. BTC reached $98,100 within 9 days — 93% of the measured target — before bouncing at the $98K support zone.
Trading rules:
Entry: Short on a 4H close below the neckline, or on a retest of the neckline from below
Stop loss: Above the right shoulder ($107,800 in this example)
Position sizing: With entry at $104,500 and stop at $107,800, that's $3,300 risk per BTC. At 1% account risk on a $50,000 account, position size = $500 / $3,300 = 0.15 BTC
Take profit: Measured move target ($97,600), or scale out at 50% / 75% / 100% of the target
Inverse Head and Shoulders
The mirror image, signaling a bullish reversal at the bottom of a downtrend.
Structure: Left shoulder low → head (deeper low) → right shoulder (higher low than head) → neckline connects the two highs between them.
Target calculation:
Target = Neckline price + (Neckline price - Head price)
2026 ETH Example:
ETH printed an inverse head and shoulders on the daily chart from March 12 to April 8, 2026:
Left shoulder: $2,420
Head: $2,280
Right shoulder: $2,450
Neckline: ~$2,620
Break above the neckline on April 8 with volume 2.1x average. Pattern height: $2,620 – $2,280 = $340. Target: $2,620 + $340 = $2,960. ETH reached $2,880 (+78% of target) before consolidating — a common outcome where the measured move provides a reliable minimum expectation.
Double Top
Two consecutive swing highs at approximately the same level, separated by a pullback. It signals that buyers tried twice to push through resistance and failed.
Structure: First peak → pullback to support (the "valley") → second peak at roughly the same level → decline below the valley.
Confirmation: Price closes below the valley support level with increasing volume on the breakdown.
Target calculation:
Target = Valley price - (Peak price - Valley price)
2026 SOL Example:
SOL formed a double top on the 4H chart at $178.50 and $179.20 (peaks within 0.4% of each other) during the week of April 14, 2026. Valley support was at $168.00.
Pattern height: $179 – $168 = $11. Target: $168 – $11 = $157. SOL broke below $168 on April 20, reaching $159.40 within 5 days.
⚠️ Precision note: The two peaks don't need to be at the exact same price. In crypto, allow a 1–2% tolerance. If peaks are $178.50 and $182.00 (a 2% gap), it's still a valid double top — especially if both peaks failed at the same horizontal resistance zone.
Double Bottom
The bullish mirror — two consecutive lows at approximately the same level, signaling accumulation and a potential reversal.
Double bottoms in crypto tend to have slightly higher completion rates than double tops because capitulation selling creates cleaner support levels.
Triple Top and Triple Bottom
Three tests of the same level that all fail, forming a stronger reversal signal than the double variant. Less common but more reliable — the third failure confirms that buyers (triple top) or sellers (triple bottom) are genuinely exhausted.
Key differences from double tops/bottoms:
Require more patience — triple formations take 30–50% longer to complete
Volume should decline on each successive test, confirming weakening momentum
The measured move target is the same formula as double top/bottom
2026 BTC Example:
BTC formed a triple top at the $109,000–$109,500 zone on the daily chart across February–April 2026. Three attempts to break above $109K failed (Feb 18: $109,200, Mar 7: $109,500, Apr 2: $109,100). Each peak showed declining volume. The support at $102,000 finally broke on April 8. Target: $102,000 – $7,200 = $94,800.
Rounding Bottom (Saucer Bottom)
A gradual, U-shaped reversal pattern that forms over weeks or months. Unlike the sharp V-bottoms common in crypto, a rounding bottom shows a slow transition from selling pressure to buying pressure — a sign of genuine accumulation rather than a short squeeze bounce.
Characteristics:
Gradual decline → flat period → gradual rise, forming a "bowl" shape
Volume typically follows the same U-shape: high during initial decline, low at the bottom, rising during the ascent
Confirmation: price closes above the "lip" of the saucer (the resistance level where the pattern began)
Target: The depth of the saucer projected above the lip. If the lip is at $2,800 and the bottom of the saucer is at $2,400, target = $2,800 + $400 = $3,200.
These patterns are rare in crypto's fast-moving environment but are more common on daily and weekly charts for large-cap tokens during cyclical transitions.
Continuation Patterns
Continuation patterns form during pauses within an existing trend. They represent periods of consolidation — the market catching its breath — before the trend resumes in the same direction.
Critical rule: Continuation patterns are only valid within the context of an existing trend. A flag pattern without a preceding flagpole is just a channel.
Bull Flag and Bear Flag
Flags are among the most common and most tradeable continuation patterns in crypto. They form after a sharp, impulsive move (the "flagpole"), followed by a shallow, counter-trend consolidation (the "flag").
Bull Flag Structure:
Flagpole: A sharp rally (typically 5–15% in crypto)
Flag: A downward-sloping or horizontal consolidation channel, usually retracing 20–40% of the flagpole
Breakout: Price breaks above the upper trendline of the flag on expanding volume
Target calculation:
Target = Breakout price + Flagpole height
Measure the flagpole (from the base of the rally to the top), then project that distance from the breakout point.
2026 BTC Example:
BTC rallied from $99,500 to $107,200 between March 1–5, 2026 (flagpole = $7,700). Price then consolidated in a gently downward-sloping channel from $107,200 to $104,800 over 4 days (the flag). The flag retraced 31% of the pole.
Breakout above $106,500 on March 9 with volume 1.6x average. Target: $106,500 + $7,700 = $114,200. BTC reached $112,800 by March 18 (82% of the measured target).
Bear Flag: The mirror image — a sharp decline followed by an upward-sloping consolidation, with a downside breakout.
Trading the flag:
Entry: On a 4H close above the flag's upper boundary (bull) or below the lower boundary (bear)
Stop: Below the flag's lowest point (bull) or above its highest point (bear)
Risk/reward: Flags typically offer 2:1 to 3:1 R:R because the flag's depth is small relative to the flagpole target
Pennant
A pennant is structurally similar to a flag but forms a small symmetrical triangle instead of a parallel channel. It signals a brief pause during a strong impulse move.
Key differences from flags:
Pennants have converging trendlines (not parallel)
They typically form and resolve faster than flags (3–10 candles)
Volume contracts during the pennant and expands on breakout
Target calculation: Same as a flag — project the flagpole height from the breakout point.
2026 ETH Example:
ETH surged from $2,520 to $2,780 on May 12, 2026 (flagpole = $260). A small pennant formed from May 12–15, with price narrowing between $2,740 and $2,760. Breakout above $2,760 on May 15. Target: $2,760 + $260 = $3,020. ETH reached $2,950 (73% of target) before encountering resistance at $3,000 psychological level.
Ascending Triangle
A flat horizontal resistance line with rising support (higher lows pressing into resistance). This pattern shows buyers becoming increasingly aggressive — each pullback is shallower, meaning sellers at resistance are being absorbed.
Structure:
Flat top: At least 2–3 touches at the same horizontal resistance level
Rising bottom: At least 2–3 higher lows forming an ascending trendline
Breakout: Price closes above the flat resistance with expanding volume
Target calculation:
Target = Breakout price + Triangle height
Measure from the flat resistance to the lowest point of the triangle.
2026 SOL Example:
SOL formed an ascending triangle on the 4H chart from April 22 to May 5, 2026:
Flat resistance: $175.00 (tested 4 times)
Rising support: $164 → $167 → $169 → $171
Triangle height: $175 – $164 = $11
Breakout above $175 on May 5 with volume 1.9x average. Target: $175 + $11 = $186. SOL hit $184.50 within 6 days.
💡 Ascending triangles have a bullish bias (~65% break upward) but they can break down. If price closes below the rising trendline, the pattern fails and becomes bearish. Always wait for the confirmed breakout direction.
Descending Triangle
The bearish mirror — flat support with lower highs pressing down. Sellers are becoming more aggressive, and buyers at support are being absorbed.
Bias: ~60% break downward, but upside breaks are possible (and tend to be explosive when they occur, as shorts are trapped).
Target: Triangle height projected below the support breakpoint.
Symmetrical Triangle
Converging trendlines from both directions — lower highs AND higher lows squeezing price into an apex. Neither buyers nor sellers have the upper hand, and the breakout can go in either direction.
Structure:
At least 2 touches on each trendline (preferably 3)
Volume declines as the triangle matures — this is a key validation signal
The breakout usually occurs between 50% and 75% of the distance from the base to the apex
2026 BTC Example:
BTC formed a symmetrical triangle on the daily chart from April 15 to May 8, 2026:
Breakout occurred at 68% of the distance to the apex
BTC broke upward at $104,800 on May 8 with volume 2.3x average. Target: $104,800 + $8,300 = $113,100. The measured move reached 75% completion at $111,000 before a pullback.
Symmetrical triangle rules:
Don't predict the direction — wait for the confirmed breakout
The breakout side typically aligns with the preceding trend (continuation bias)
If the breakout occurs after the 75% point toward the apex, the pattern loses reliability
Rising Wedge (Bearish)
Both trendlines slope upward, but the support line rises faster than the resistance line — the price range is narrowing as the pattern ascends. Despite appearing bullish (price is going up), rising wedges are bearish patterns that signal weakening buying momentum.
Why it's bearish: Each new high gains less ground than the previous one. Buyers are losing steam even as price drifts higher. When the lower trendline breaks, the accumulated long positions unwind rapidly.
ETH formed a rising wedge on the 4H chart from May 18–28, 2026. Price climbed from $2,720 to $2,840 within the narrowing channel. Wedge height at base: $80. Price broke below the lower trendline at $2,790 on May 28. Target: $2,790 – $80 = $2,710. ETH dropped to $2,730 within 3 days (75% of target).
Key confirmation: Volume should decline throughout the wedge and expand on the breakdown. A rising wedge with increasing volume is less reliable — it may indicate genuine buying pressure rather than exhaustion.
Falling Wedge (Bullish)
The bullish counterpart — both trendlines slope downward, with resistance falling faster than support. Price compresses downward but selling momentum is waning.
Target: Wedge height projected above the upper trendline breakout.
Falling wedges in crypto often form during corrections within larger uptrends. They're particularly common on SOL and ETH when these tokens pull back after sharp rallies — the multi-timeframe analysis confirms whether the wedge is a correction within a larger bullish structure.
Cup and Handle
A rounded bottom (the "cup") followed by a small downward drift or consolidation (the "handle"), then a breakout above the cup's rim. This pattern represents accumulation (the cup), a final shakeout of weak hands (the handle), and then the markup phase.
Structure:
Cup: A U-shaped decline and recovery, ideally lasting 4–12 weeks on daily charts
Handle: A shallow pullback from the cup's rim, retracing no more than 30–50% of the cup's depth. Should last 1–4 weeks
Breakout: Price closes above the cup's rim (the resistance level)
Target calculation:
Target = Rim price + Cup depth
2026 BTC Example:
BTC formed a cup and handle on the daily chart from January to April 2026:
Left rim: $108,000 (January 10)
Cup low: $96,500 (February 15)
Right rim: $108,200 (March 28)
Handle: price pulled back to $104,500 (April 2–8), retracing 32% of the cup depth
Cup depth: $108,000 – $96,500 = $11,500
Breakout above $108,200 on April 10 with volume 1.7x average. Target: $108,200 + $11,500 = $119,700.
⚠️ Crypto-specific note: The cup and handle is a longer-timeframe pattern. It's most reliable on daily and weekly charts. On the 1H or 4H, what looks like a cup and handle is often just noise. Require at least 30 candles for the cup to form before considering it valid.
Chart Pattern Quick Reference Table
Pattern
Type
Bias
Target Calculation
Avg. Completion Rate*
Best Timeframe
Head & Shoulders
Reversal
Bearish
Neckline – Height
~63%
4H, Daily
Inverse H&S
Reversal
Bullish
Neckline + Height
~65%
4H, Daily
Double Top
Reversal
Bearish
Valley – Height
~60%
4H, Daily
Double Bottom
Reversal
Bullish
Neckline + Height
~64%
4H, Daily
Triple Top/Bottom
Reversal
Bearish/Bullish
Same as Double
~68%
Daily
Bull Flag
Continuation
Bullish
Breakout + Pole
~62%
1H, 4H
Bear Flag
Continuation
Bearish
Breakout – Pole
~58%
1H, 4H
Ascending Triangle
Continuation
Bullish (65%)
Breakout + Height
~64%
4H, Daily
Descending Triangle
Continuation
Bearish (60%)
Breakout – Height
~60%
4H, Daily
Symmetrical Triangle
Continuation
Trend-dependent
Breakout ± Width
~55%
4H, Daily
Rising Wedge
Reversal
Bearish
Breakout – Width
~58%
4H, Daily
Falling Wedge
Reversal
Bullish
Breakout + Width
~62%
4H, Daily
Cup & Handle
Continuation
Bullish
Rim + Depth
~66%
Daily, Weekly
*Completion rates are approximate, based on aggregate backtesting across BTC, ETH, and SOL (2023–2026) on the specified timeframes. Rates measure how often price reaches at least 75% of the measured move target.
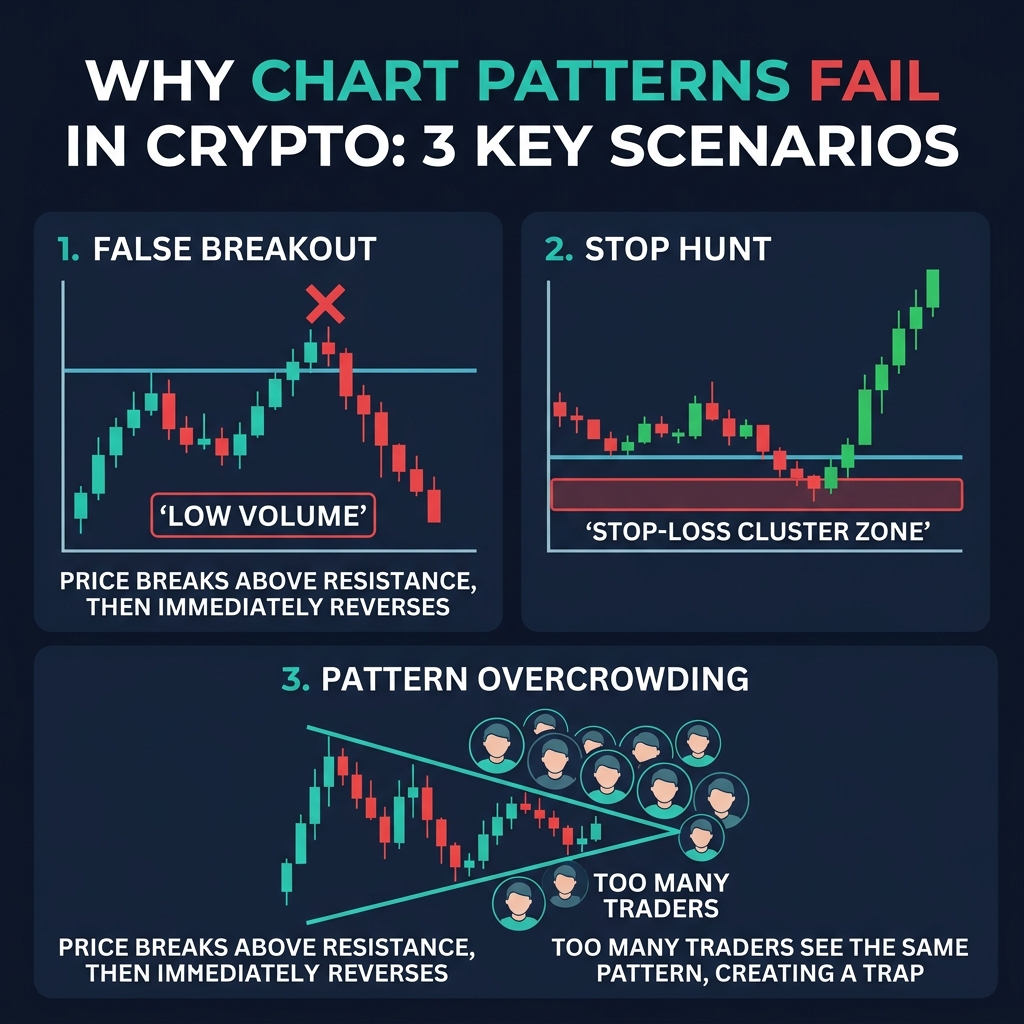
Why Chart Patterns Fail — And How to Protect Yourself
Chart patterns fail. Frequently. Understanding why they fail is more valuable than memorizing the patterns themselves, because it teaches you to filter for high-probability setups and discard the rest.
1. Low-Volume Breakouts (The #1 Killer)
A pattern can look textbook-perfect, but if the breakout occurs on low volume, it's likely a fakeout. Volume is the fuel behind a breakout — without it, price doesn't have the conviction to reach the measured target.
Rule of thumb: Require breakout volume ≥ 1.5x the 20-period average. Below that threshold, the breakout has a significantly higher failure rate.
2. False Breakouts and Stop Hunts
In 2026's crypto market, large players (whales, market makers, algorithmic funds) deliberately trigger false breakouts to capture liquidity. A neckline break on a head and shoulders might be engineered specifically to trigger stop-losses on long positions, after which price reverses sharply.
How to protect yourself:
Wait for a candle close beyond the breakout level, not just a wick
Require a retest of the broken level — many valid breakouts will pull back to the breakout point before continuing
Use CoinXSight's Deep Alpha to check whether volume and momentum layers confirm the breakout direction
3. Competing Timeframe Signals
A bullish ascending triangle on the 1H chart means nothing if the daily chart shows a clear bearish head and shoulders. Higher-timeframe patterns always override lower-timeframe patterns. This is why multi-timeframe analysis is non-negotiable.
4. Macro Event Overrides
No chart pattern can predict a surprise regulatory announcement, exchange hack, or macroeconomic shock. On June 13, 2024, a single Fed statement invalidated dozens of patterns across the entire crypto market within minutes. Chart patterns model normal market behavior — during abnormal events, all bets are off.
5. Pattern Degradation from Over-Crowding
When a chart pattern is extremely obvious — thousands of traders see the same head and shoulders on BTC — the pattern becomes crowded. Market makers and whales exploit this by triggering the expected breakout, waiting for retail to pile in, then reversing. This is particularly common with textbook patterns on BTC daily charts.
The bottom line: No single chart pattern is a trade signal on its own. Patterns are hypotheses that require confirmation from volume, indicators, and timeframe alignment before they become actionable trade setups.
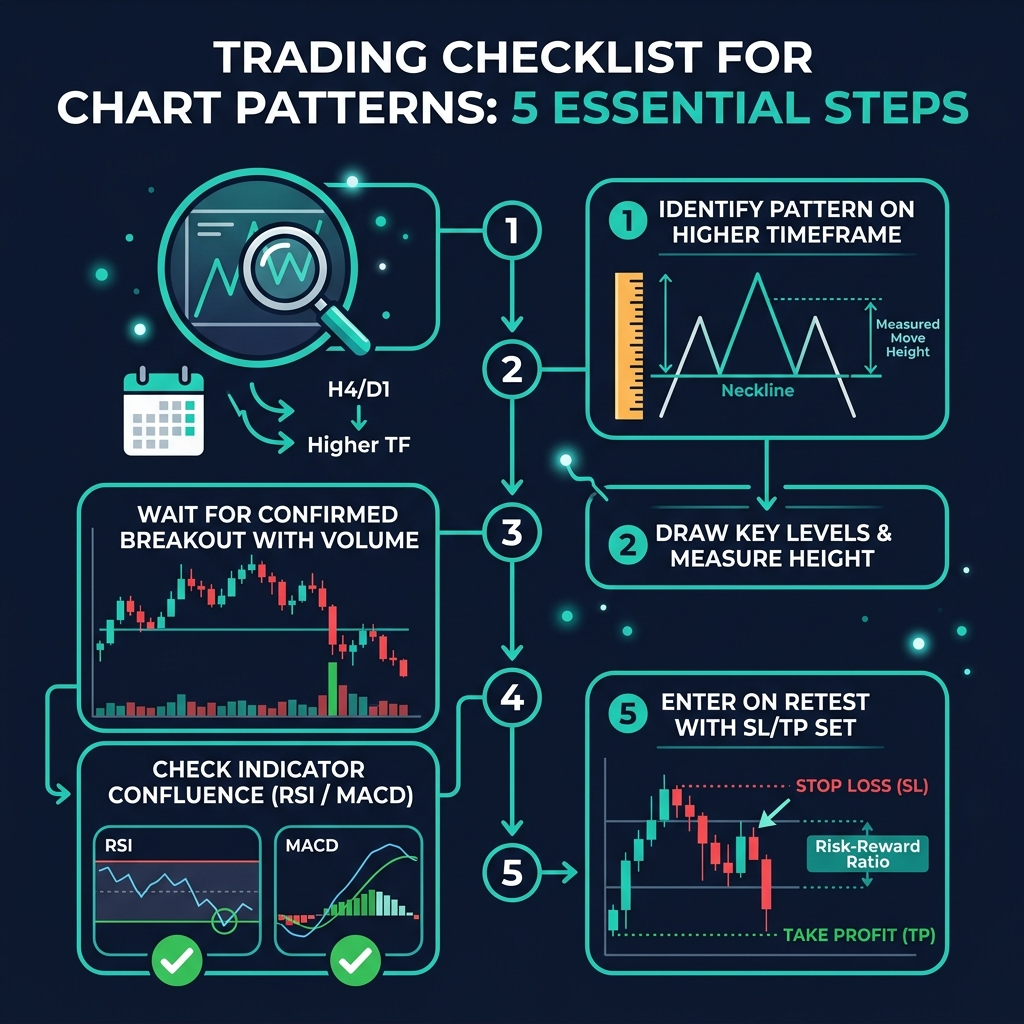
Chart Pattern Trading Checklist
Use this step-by-step checklist for any classical chart pattern trade. Print it, screenshot it, or keep it open in a separate tab.
Pre-Trade (Pattern Identification)
[ ] Identify the pattern type — Is it reversal or continuation?
[ ] Confirm a prior trend exists — Reversal patterns need a trend to reverse. Continuation patterns need a trend to continue. No trend = no valid pattern
[ ] Verify structural requirements — Correct number of touches on trendlines (minimum 2, ideally 3)? Head higher than shoulders? Neckline clearly defined?
[ ] Check the timeframe — Is this pattern forming on the 4H or daily chart? Patterns on 15m or below have much lower reliability
[ ] Check higher timeframe alignment — Does the pattern's direction agree with the daily/weekly trend? If not, reduce position size or skip
Breakout Confirmation
[ ] Wait for candle close — The breakout candle must close beyond the pattern boundary. Wicks don't count
[ ] Volume check — Breakout volume ≥ 1.5x the 20-period average
[ ] Calculate the measured move target — Use the pattern-specific formula
[ ] Check indicator confluence — RSI not in extreme territory (overbought for bullish breaks, oversold for bearish breaks), MACD aligned with breakout direction
Trade Execution
[ ] Define entry — At breakout close or on retest of the broken level
[ ] Set stop loss — Beyond the pattern's invalidation level (right shoulder for H&S, opposite boundary for triangles, flag extreme for flags)
[ ] Calculate position size — Based on 1–2% max account risk and the distance from entry to stop
[ ] Set target(s) — Primary target at 75% of measured move, secondary at 100%. Consider scaling out
[ ] Log the trade — Screenshot, entry reason, risk/reward ratio, and confirmation factors
Post-Trade
[ ] Monitor for failure — If price reverses back inside the pattern after breakout, the pattern has failed. Exit immediately at your stop
[ ] Scale out at targets — Don't hold for 100% of the measured move with your entire position. Take partial profits
[ ] Record the outcome — Win or loss, what worked and what didn't. Build your personal pattern accuracy data over time
Combining Chart Patterns with Indicators
Chart patterns describe structure. Indicators describe momentum, volume, and market positioning. Combining them creates a confirmation framework that filters out the ~40% of patterns that would otherwise fail.
RSI Divergence + Reversal Patterns
RSI divergence is the single most powerful confirmation tool for reversal chart patterns.
Bullish setup: An inverse head and shoulders forms with a bullish RSI divergence — price makes a lower low (the head), but RSI makes a higher low. This tells you that selling momentum is weakening even as price drops, confirming the reversal pattern's thesis.
Bearish setup: A head and shoulders forms with bearish RSI divergence — price makes a higher high (the head), but RSI makes a lower high. Momentum is fading even as price rises.
2026 SOL Example:
SOL formed an inverse head and shoulders on the 4H chart in late March 2026 (left shoulder $162, head $155, right shoulder $164). The 14-period RSI at the head was 28, but at the right shoulder low (which was a higher price at $164), RSI was 35 — bullish divergence confirmed. The neckline break at $172 produced a rally to $183.
Without the RSI divergence, you might have hesitated at the neckline. With it, you had double confirmation that selling momentum was exhausted.
Volume Confirmation
Volume is the truth serum for chart patterns. The relationship between volume and pattern stages should follow a predictable sequence:
Pattern Stage
Expected Volume Behavior
Pattern formation
Declining — consolidation means reduced participation
Final stages before breakout
Low — the "calm before the storm"
Breakout candle
Expanding — 1.5–2x average or more
Post-breakout continuation
Sustained or increasing — buyers/sellers following through
If volume doesn't follow this sequence, the pattern is suspect. A breakout on declining volume is a warning sign, regardless of how perfect the pattern looks visually. Use CoinXSight's volume profile and OBV tools to verify volume behavior across the pattern's development.
VWAP Alignment
VWAP (Volume Weighted Average Price) adds institutional-grade context to chart pattern breakouts.
Key principle: If a bullish breakout occurs above VWAP, institutions that entered at or below VWAP are profitable and likely to add to positions. If a bullish breakout occurs below VWAP, institutions may use the rally as an exit opportunity.
Practical application:
For long breakouts (ascending triangle, bull flag, inverse H&S): Require price to be above the session VWAP at the breakout point
For short breakouts (descending triangle, bear flag, H&S): Require price to be below the session VWAP
Fibonacci Confluence
When a pattern's measured move target aligns with a key Fibonacci retracement or extension level, the target becomes significantly more reliable. For example, if a double bottom's measured move points to $2,960 on ETH, and the 0.618 Fibonacci extension of the prior swing also falls at $2,950–$2,970, that confluence zone is likely where price will react.
Must expand on breakout; declining volume during formation
VWAP
Institutional positioning
Breakout above VWAP = institutional backing for longs
MACD
Trend momentum
MACD crossover aligned with breakout direction
OBV
Cumulative buying/selling pressure
OBV trending in the breakout direction confirms real accumulation/distribution
💡 On CoinXSight's Deep Alpha dashboard, the Confluence Score integrates multiple indicator layers into a single 1–10 rating. For chart pattern trades, aim for a Confluence Score ≥ 6/10. Scores below 5 indicate that the indicators aren't supporting the pattern — either skip the trade or reduce your position size.
Trading Chart Patterns on CoinXSight — Workflow
Here's a practical workflow for identifying and trading classical chart patterns using CoinXSight's tools:
Open Chart Pro → Select your token and set the 4H or daily timeframe
Scan for patterns → Look for the geometric shapes covered in this guide. Use the drawing tools to mark trendlines, necklines, and support/resistance boundaries
Measure the pattern → Use the measurement tool to calculate the pattern height and projected target
Switch to Deep Alpha → Check the Confluence Score and individual indicator layers:
Is volume declining during the pattern? (Good — confirms consolidation)
Is RSI showing divergence at pattern extremes? (Good — confirms reversal setups)
Does the ASI Score support the breakout direction?
Set alerts → Use CoinXSight alerts for a price break above/below the critical pattern level (neckline, trendline boundary, flag boundary)
Wait for confirmation → Do NOT enter before the breakout candle closes. Check volume on the breakout candle
Execute using the checklist → Follow the Pre-Trade, Breakout, and Execution steps from the checklist above
Monitor with Alpha Hunter → The Alpha Hunter signal engine can flag momentum shifts that align with or contradict your pattern-based trade
Frequently Asked Questions
What are the most reliable crypto chart patterns for trading?
Based on completion rates across BTC, ETH, and SOL in 2023–2026, the inverse head and shoulders (~65%), cup and handle (~66%), and ascending triangle (~64%) show the highest reliability when confirmed by volume. However, no pattern exceeds a ~78% success rate even under ideal conditions — always use stop losses.
How are chart patterns different from candlestick patterns?
Chart patterns are multi-candle geometric formations (triangles, head and shoulders, wedges) that develop over tens to hundreds of candles and describe broader market structure. Candlestick patterns are 1–3 candle formations (hammers, engulfing, doji) that signal short-term sentiment shifts. Chart patterns are about structure; candlestick patterns are about immediate price action.
What timeframe is best for crypto chart patterns?
The 4H and daily charts produce the most reliable chart patterns. On the 4H, patterns resolve within 2–15 days — ideal for swing trading. Daily chart patterns develop over weeks and suit position traders. Avoid relying on chart patterns below the 1H timeframe — the noise-to-signal ratio makes them unreliable in crypto's 24/7 market.
How do I calculate chart pattern price targets?
Every classical pattern uses a "measured move" formula. Measure the pattern's height (the distance between the key high and key low within the pattern) and project it from the breakout point. For reversal patterns, project from the neckline or support break. For continuation patterns, project from the breakout point in the trend direction. The specific formulas are detailed for each pattern above.
Can chart patterns be used for altcoin trading, or only Bitcoin?
Chart patterns work on any liquid market. BTC and ETH have the highest pattern completion rates because they have the deepest liquidity and the most participants watching the same formations. Mid-cap altcoins (SOL, AVAX, LINK) also produce tradeable patterns on the 4H and daily charts. For low-cap or meme tokens, chart patterns are unreliable — liquidity is too thin and single wallets can override any technical formation.
How do I distinguish a genuine breakout from a fakeout?
Three validation checks: (1) Candle close — the breakout candle must close beyond the pattern boundary, not just wick through it. (2) Volume — breakout volume should be ≥ 1.5x the 20-period average. (3) Indicator confirmation — RSI, MACD, and VWAP should align with the breakout direction. On CoinXSight, a Confluence Score ≥ 6/10 significantly reduces fakeout risk. If all three checks pass, treat it as a valid breakout. If any two fail, skip the trade.
Summary
Classical chart patterns remain one of the most practical tools in a crypto trader's toolkit in 2026. They provide a visual framework for understanding market structure, offer objective entry/exit criteria through measured move calculations, and work across all liquid crypto markets.
Here's what matters most:
Reversal patterns (head and shoulders, double/triple tops and bottoms) signal trend changes at key levels — always confirm with RSI divergence
Continuation patterns (flags, triangles, wedges, cup and handle) signal pauses within trends — always confirm with volume expansion on breakout
No pattern is a standalone signal — combine with volume, RSI, VWAP, and higher-timeframe alignment
Success rates range from 55–78% depending on confirmation quality — always use stop losses and size positions to risk no more than 1–2% of your account per trade
False breakouts are the biggest risk — wait for candle closes, require volume confirmation, and use CoinXSight's Confluence Score as an objective quality filter
Master multi-timeframe analysis to ensure your chart patterns align with the broader market direction
This article is for educational purposes only and does not constitute financial advice. Cryptocurrency trading involves significant risk. Always conduct your own research and never risk more than you can afford to lose.