In Part 3, we covered how stablecoin flow measures market buying power. Now we dive into the most direct form of flow analysis: tracking the wallets of the biggest holders.
Crypto whales — wallets holding more than 100 BTC or $10M+ in value — control a disproportionate share of market supply. When these wallets move, the market feels it. A single whale transferring 5,000 BTC to a crypto exchange can trigger a 2-3% price drop. A whale withdrawing 10,000 BTC from exchanges to cold storage can fuel a multi-week rally by reducing available supply.
On-chain whale tracking builds on the accumulation/distribution framework developed by Richard Wyckoff in the 1930s — the principle that large operators accumulate positions before marking up prices remains foundational to modern on-chain analysis.
The advantage of crypto over traditional markets: everything is on the blockchain. You can see whale movements in real-time, often hours or days before the price impact fully materializes. This transparency gives the informed trader a significant edge.
💡 CoinXSight's On-Chain module tracks whale movements across all major blockchains. The Whale Netflow metric on the Dashboard is one of the four hero stats, giving you instant visibility into whether large wallets are accumulating or distributing. This crypto analytics platform was built with whale analysis at its core.
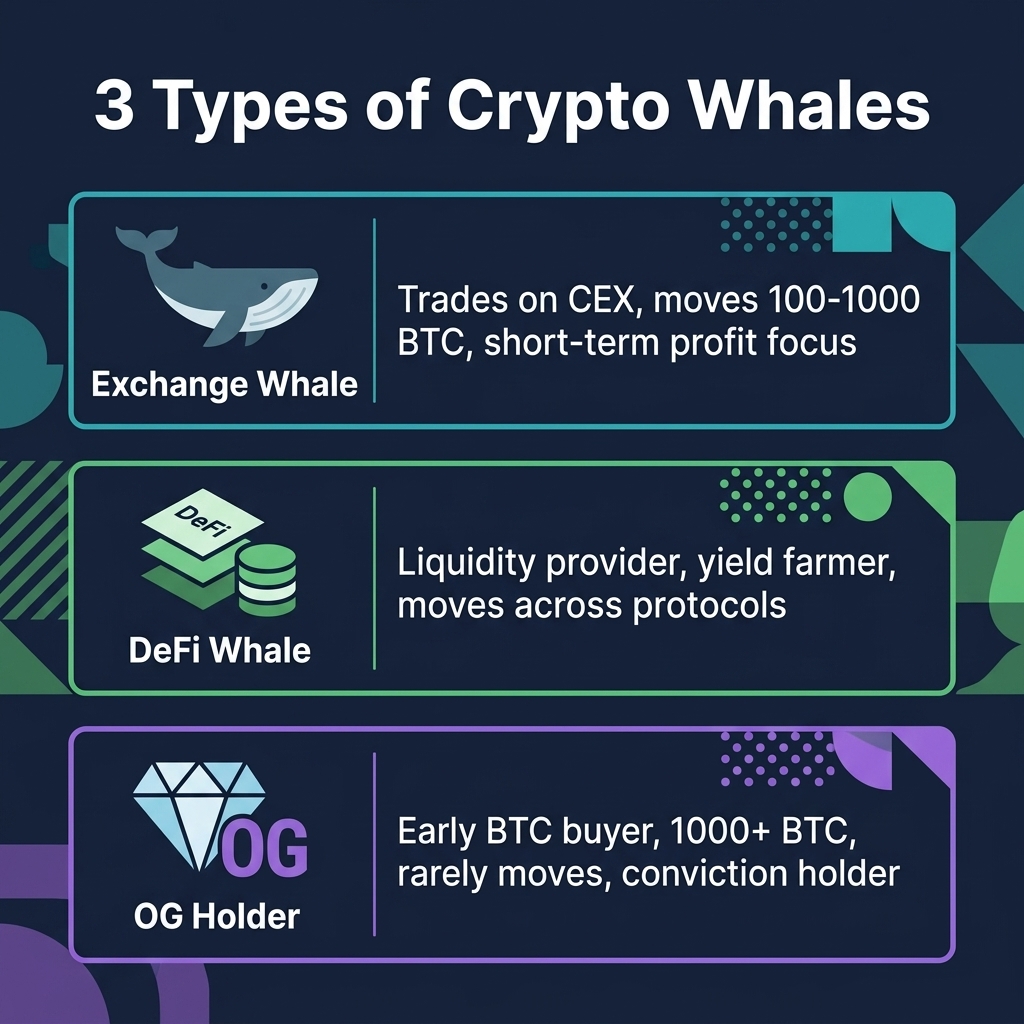
Understanding the 3 Types of Whales
Not all whales are the same. Their behavior patterns, timeframes, and market impact differ significantly.
Type 1: Exchange Whales
Profile: Actively trades on centralized crypto exchanges. Holds 100-1,000 BTC. Moves funds frequently between hot wallets and exchange accounts.
Behavior patterns:
Deposits to exchanges before major price moves (selling or shorting)
Withdrawals from exchanges after accumulation at support levels
Often uses multiple exchange accounts to obscure position size
Trade timeframe: days to weeks
Signal value: HIGH for short-term trading. Exchange whale movements directly impact order books and create immediate price pressure.
Type 2: DeFi Whales
Profile: Operates primarily in DeFi protocols. Provides liquidity, farms yield, participates in governance. Holds $10M+ across multiple chains and protocols.
Behavior patterns:
Moves capital between DeFi protocols seeking the best yield
Bridges large amounts between chains (signals narrative rotation)
Removes liquidity before expected volatility (early warning)
Deposits stablecoins into lending protocols during uncertainty
Signal value: MEDIUM for price trading, HIGH for DeFi sector analysis. DeFi whale movements are leading indicators for sector rotation and TVL trends.
Type 3: OG Holders (Diamond Hands)
Profile: Early Bitcoin buyers, crypto founders, mining pool operators. Holds 1,000+ BTC accumulated at very low cost basis. Rarely moves coins.
Behavior patterns:
Almost never deposits to exchanges (when they do, it is major news)
Moves between personal cold wallets (not a trading signal)
Any exchange deposit = potential major sell event
Trade timeframe: years (or never)
Signal value: LOW for regular trading, EXTREMELY HIGH when they move. A dormant wallet from 2012 depositing 1,000 BTC to Coinbase is one of the strongest bearish signals available.
Key Whale Metrics and How to Read Them
Exchange Whale Ratio
Formula: Whale inflow to exchanges ÷ Total exchange inflow (top 10 wallets vs all wallets)
Multiple dormant wallets moving same day = Coordinated event. Very significant.
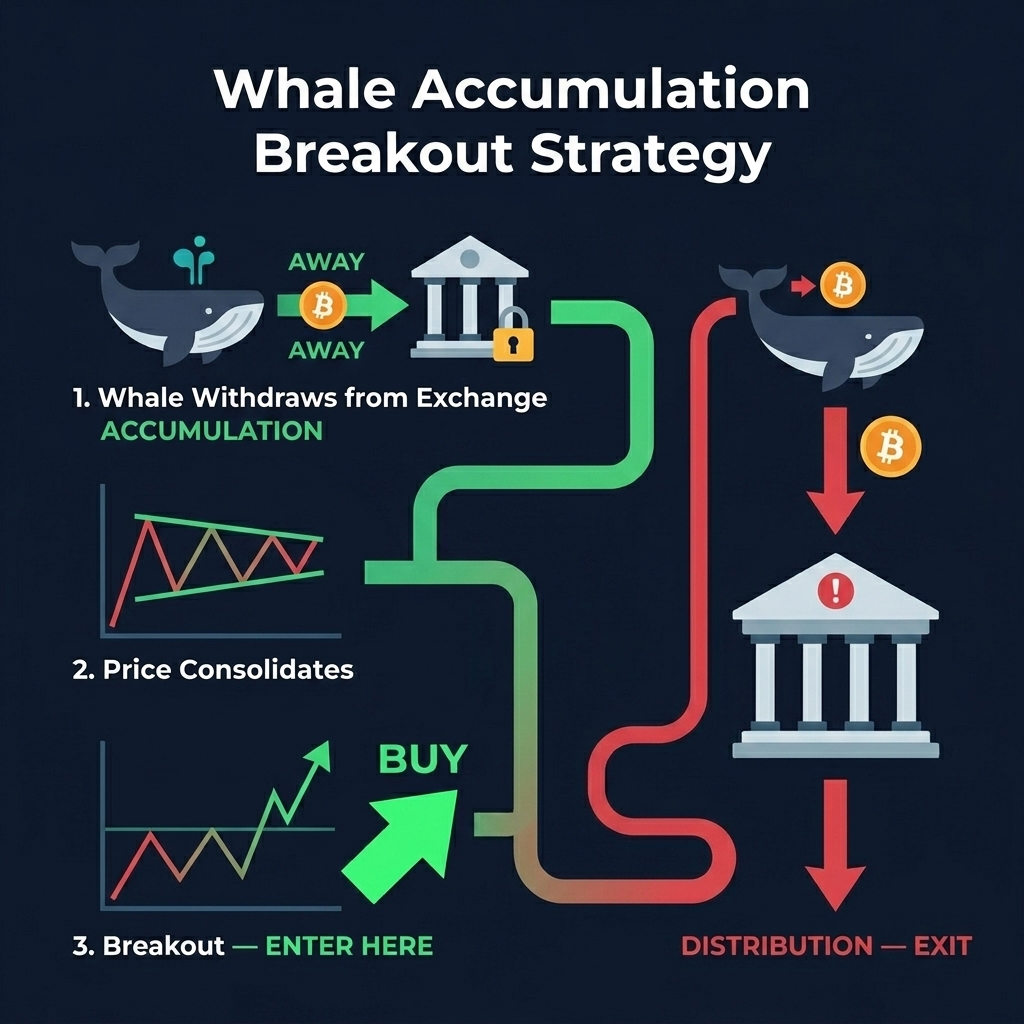
The Whale Accumulation Breakout Strategy
This is the core whale-based trading strategy. It detects when whales are quietly accumulating BTC by withdrawing from exchanges, then enters when the resulting supply squeeze triggers a breakout.
Setup Conditions (All Must Be True)
Whale netflow negative for 7+ days (sustained withdrawals from exchanges)
Price in consolidation (range-bound, low volatility — the spring compression phase)
Volume declining (the calm before the storm)
CoinXSight Accumulation Score ≥ 7/10
Entry Rules
Trigger: Price breaks above the consolidation range high with volume > 1.5x 20-day average
Confirmation: Daily candle closes above breakout level (no wicks only)
Position size: 75% at breakout, 25% on first pullback to breakout level
Exit Rules
Target: 2x ATR above breakout level, or trailing stop of 1.5x ATR
Stop loss: Below consolidation range low (invalidates the setup)
Whale exit: If whale netflow turns positive (deposits resume) while in trade, tighten stop to break-even
Volume exit: If breakout stalls with declining volume for 3+ days, take profit
Performance Context
This setup has triggered 8 times on BTC in the past 18 months:
Win rate: 6/8 (75%)
Average win: +9.7%
Average loss: -3.2%
Profit factor: 3.03
Average holding period: 11 days
The key insight: whale withdrawals compress available supply on exchanges. When a catalyst arrives (news, ETF inflow, stablecoin velocity spike), the reduced supply amplifies the price move. You are trading the supply squeeze effect.
Real Example — SOL Whale Accumulation (May 2026)
CoinXSight's Whale Tracker flagged 3 wallets accumulating a combined
890,000 SOL ($134M) over 8 days while SOL traded between $148-$152.
The Exchange Whale Ratio dropped to 0.72, indicating whales were
withdrawing from exchanges, not depositing. SOL broke out to $171
(+14.5%) within 2 weeks. Two of the flagged wallets had historically
78% accuracy on accumulation-before-breakout patterns.
OTC Detection — The Invisible Whale Trade
Large whales often avoid public exchanges to prevent slippage. Instead, they use OTC (Over-The-Counter) desks. These trades are harder to detect but leave on-chain footprints.
How to Spot OTC Activity
Pattern 1: Large transfers to known OTC desk addresses
Wallets like Cumberland, Circle Trade, Galaxy Trading have known addresses
When whale wallets send 500+ BTC to these addresses, an OTC trade is being arranged
Signal: Bullish if OTC desk is buying from whale (whale selling, but at premium — institutional demand). Bearish if OTC desk is selling to whale (whale buying cheap — expects higher prices, but current selling pressure).
Large USDT/USDC transfers to OTC desk addresses = institutional buyer loading
These often precede exchange-visible buying within 1-5 days
Pattern 3: Exchange reserves dropping without price impact
If exchange BTC reserves decline 1,000+ BTC in a day but price does not move up, the coins were likely transferred via OTC (not market-bought)
This is actually more bullish than market buying — it means a large buyer absorbed supply without pushing price up. The supply squeeze intensifies.
CoinXSight OTC Detection
CoinXSight's On-Chain module flags large transfers to/from known OTC desk addresses. When you see:
"Whale Alert: 2,000 BTC transferred to Cumberland" → OTC deal in progress
"Whale Alert: $50M USDC from unknown wallet to Galaxy OTC" → Large buyer loading
These alerts combined with exchange reserve tracking give you near-complete visibility into whale activity — both visible and invisible.
Altcoin Whale Tracking — Different Rules
Whale tracking works differently for altcoins because of concentration risk:
Top Holder Concentration
Concentration Level
Implication
Top 10 holders own > 60% supply
Extreme whale risk. One holder can crash price.
Top 10 holders own 30-60%
Significant whale influence. Monitor top wallets closely.
Top 10 holders own < 30%
Well-distributed. Whale risk manageable.
DeFi Protocol Whale Tracking
For altcoins in the DeFi ecosystem:
Track TVL changes per protocol — sudden 20%+ drops signal whale LP removal
Monitor governance token whale wallets — large holders dumping governance tokens often precedes protocol issues
Bridge activity — whales bridging tokens from L1 to L2 or vice versa signals narrative rotation
Smart Money Wallets
CoinXSight's Discovery module identifies "smart money wallets" — addresses with historically profitable trading patterns. Platforms like Nansen have pioneered smart money labeling by tagging wallets based on historical profitability and behavioral patterns:
Average win rate > 65% over 6+ months
Early entry into tokens that later 5x+
Consistent accumulation before price pumps
When multiple smart money wallets accumulate the same token simultaneously, it generates a high-conviction signal. This is the crypto portfolio tracker feature that turns raw whale data into actionable intelligence.
Real-World Example: Whale Activity During March 2026 Top
March 1-10, 2026: BTC at $82,000-$85,000 (new highs)
Whale netflow: turned positive on March 5 (+3,200 BTC/day)
Two dormant wallets (inactive since 2019) deposited 1,500 BTC to Binance
CoinXSight Accumulation Score dropped from 7 to 3
What this told the flow trader:
While retail was euphoric and price was at highs, whales were selling into strength. The combination of positive whale netflow + high exchange whale ratio + dormant wallet awakening = classic distribution pattern.
Outcome: BTC topped at $85,000 on March 15 and corrected to $76,000 by April 8 (-10.6%).
The lesson: Whale flow data signaled distribution 10 days before the price top. The trader monitoring whale netflow on CoinXSight's Dashboard would have started reducing exposure on March 5 when whale netflow turned positive.
Whale Alerts feed → Real-time large transactions (>$1M) with source/destination labels
Exchange Flow panel → Net BTC, ETH flows across major crypto exchanges
Accumulation Score → AI-scored probability of accumulation vs distribution for top tokens
Alert Setup for Whale Trading
Configure CoinXSight alerts for:
Whale netflow sign change (positive → negative or vice versa)
Exchange BTC reserves change > 2% in 24 hours
Dormant wallet activity (wallets inactive >1 year moving to exchanges)
Smart money wallet accumulation signals on discovery tokens
Whether you want to buy Bitcoin during whale accumulation phases or exit before distribution events, CoinXSight's whale tracking tools give you real-time visibility that no price chart can provide on any crypto exchange. This is the fundamental advantage of flow-based trading.
Protect like a whale: After accumulating crypto following whale flow signals, secure your holdings in a hardware crypto wallet. Whales keep their BTC in cold storage — you should too. Never leave significant positions on any crypto exchange longer than necessary.
FAQ
What defines a crypto whale?
In Bitcoin, a whale is typically defined as a wallet holding 100+ BTC (~$7.9M at current prices). For Ethereum, 1,000+ ETH. For altcoins, the threshold varies by market cap but generally means top 0.1% of holders. On CoinXSight's crypto analytics platform, whale alerts trigger for transactions exceeding $1M in value, which captures meaningful market-moving activity on any crypto exchange.
Can whale tracking be manipulated?
Yes — sophisticated whales use multiple wallets, tumbling services, and OTC desks to obscure their activity. However, on-chain forensics firms like Arkham and Nansen have labeled tens of thousands of whale wallets, making evasion increasingly difficult. On-chain data providers such as Glassnode offer comprehensive exchange flow and whale metrics that complement CoinXSight's tracking. The key is to track aggregate whale metrics (netflow, exchange ratio) rather than individual wallets, as aggregate data is harder to manipulate.
How quickly do whale movements impact price?
Exchange deposits by whales typically impact price within 1-24 hours if they sell via market orders, or 1-7 days if they use limit orders or TWAP algorithms. Whale withdrawals (accumulation) create a slower supply squeeze effect, typically manifesting in price over 1-4 weeks. OTC trades may have minimal immediate price impact but reduce future selling pressure.
Is whale tracking more useful for BTC or altcoins?
Both, but differently. For BTC, whale tracking helps identify macro trends (accumulation vs distribution phases). For altcoins, whale tracking is even more powerful because individual whales can represent 5-20% of circulating supply — their movements directly determine price. The risk is also higher: a single altcoin whale dumping can crash a token 20%+. Use CoinXSight's crypto portfolio tracker to monitor whale activity across all your holdings.
What is the difference between CoinXSight whale tracking and free alternatives like Whale Alert?
Whale Alert provides raw transaction alerts (wallet A sent X BTC to wallet B). CoinXSight adds intelligence layers: accumulation/distribution scoring, exchange flow attribution, smart money wallet classification, and integration with technical indicators via the Confluence Score. Free tools tell you what happened. CoinXSight's crypto analytics platform tells you what it means for your trading decisions.
Disclaimer: This article is for educational and informational purposes only and does not constitute financial, investment, or trading advice. Cryptocurrency markets are highly volatile and involve substantial risk of loss. No trading strategy guarantees profits — paper-trade or demo-trade before risking real capital. Always conduct your own research (DYOR) and consult a licensed financial advisor before making any investment decisions. CoinXSight provides analytical tools and data — not investment recommendations.