Crypto Breakout Trading: The Complete Strategy Guide
Master breakout trading in crypto with a 6-step confirmation framework, false breakout detection, and 3 complete setups with entry, stop-loss, and targets.
MC
Marcus ChenSenior Quantitative Strategist·Jun 6, 2026 · 18 min read · Updated Oct 6
Why Breakout Trading Dominates Crypto — And Why Most Traders Still Lose
Breakout trading is the most popular strategy in crypto markets. The logic is simple: price consolidates inside a defined range, pressure builds, and eventually one side wins — price explodes in a direction, and you ride the wave. In theory, breakouts offer the best risk-to-reward setups available because you enter at the exact moment momentum shifts and place tight stops just below the broken level.
Here's the problem: 60-70% of breakouts in crypto are false breakouts. Price pierces a level, triggers a rush of buy orders, then immediately reverses — trapping breakout traders in losing positions while rewarding the market makers and whales who engineered the move.
This guide teaches you to tell the difference. You'll learn a 6-step confirmation framework that filters real breakouts from traps, specific techniques to detect and profit from false breakouts, and three complete trading setups with exact entry, stop-loss, and take-profit levels using 2026 market data.
If you're new to identifying key price levels, start with the Support and Resistance Guide first — breakout trading builds directly on those concepts.
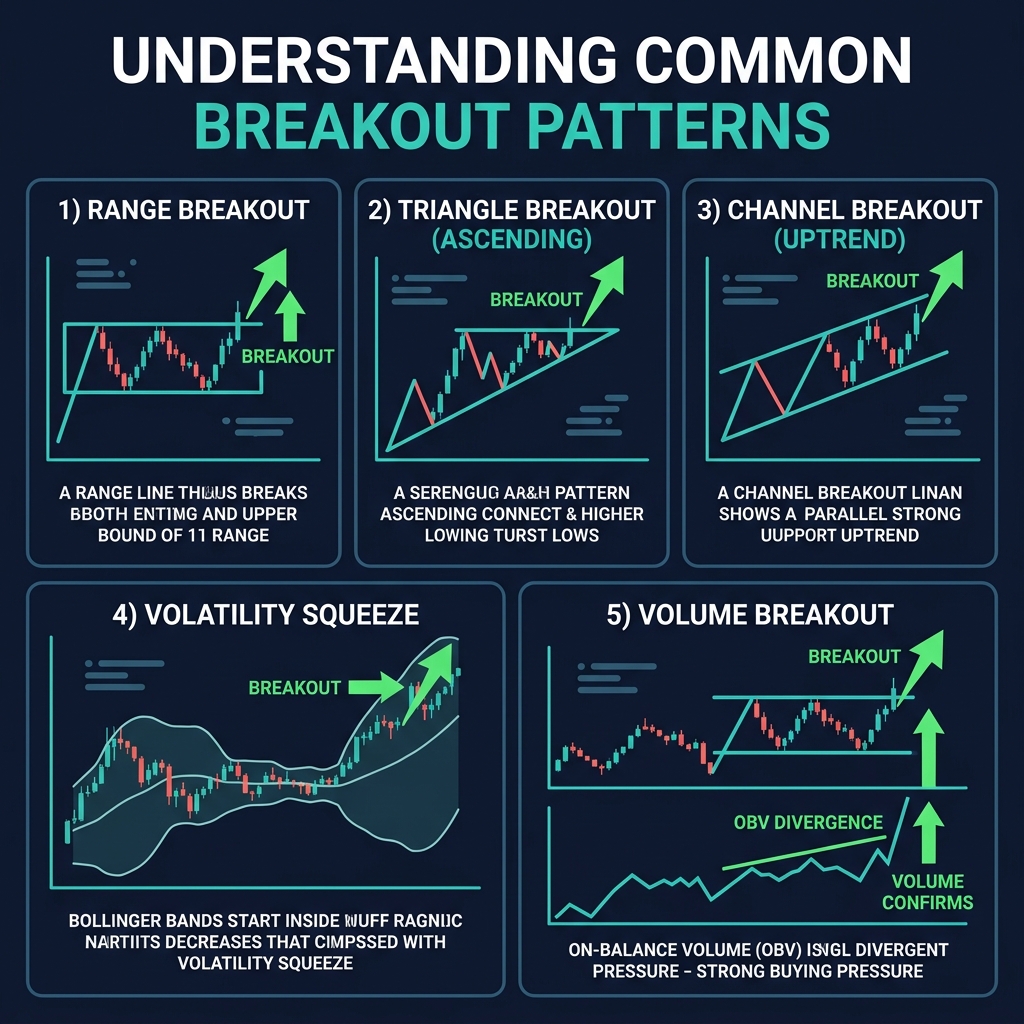
The 5 Types of Crypto Breakouts
Not all breakouts are equal. Each type has distinct characteristics, reliability, and optimal trading approaches. Understanding which type you're trading changes your confirmation requirements and position sizing.
Type 1: Range Breakout (Horizontal Support & Resistance)
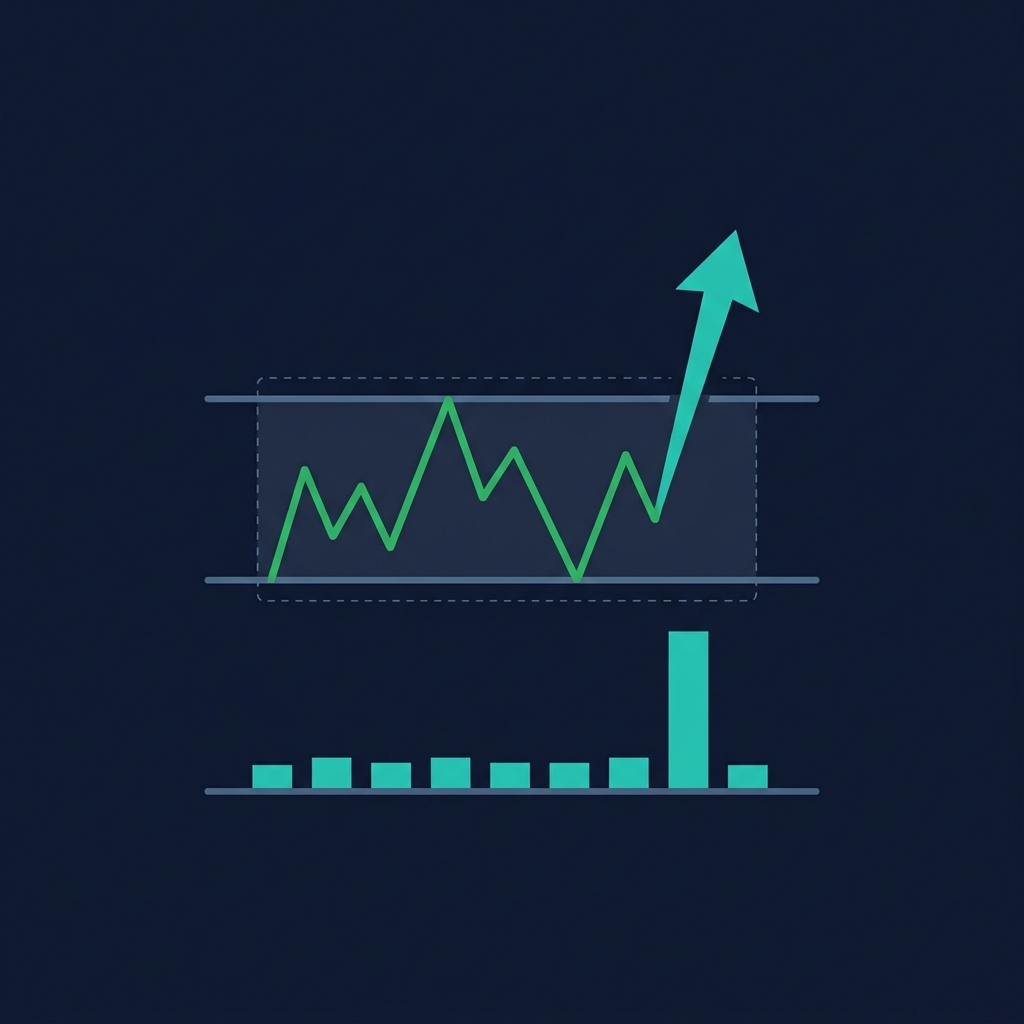
What it looks like: Price bounces between a flat support floor and a flat resistance ceiling at least 3 times on each side. The longer the range and the more touches, the more significant the eventual breakout.
How to identify it:
Draw horizontal lines at the price level where at least 3 candle wicks reverse
The range must be clearly defined — if you're squinting to see it, it's not clean enough
Volume should decrease during the consolidation phase
2026 crypto example — BTC $100,000–$108,000 range:
BTC spent much of Q1 2026 oscillating between $100,000 support and $108,000 resistance on the daily chart. Each touch of $108,000 was sold aggressively; each dip to $100,000 was bought. When BTC finally closed above $108,000 on the daily chart with 2.1x average volume, the measured move target was $116,000 ($108K + $8K range height) — and price reached $114,500 within 12 days.
Reliability: Medium-high. Range breakouts produce clean measured moves, but the more obvious the range, the more likely a false breakout will occur first.
Type 2: Triangle Breakout (Ascending, Descending, Symmetrical)
What it looks like: Price forms a converging pattern of higher lows (ascending), lower highs (descending), or both (symmetrical). The apex of the triangle is where the breakout must resolve.
Triangle Type
Structure
Bias
Breakout Direction
Ascending
Flat resistance + rising support
Bullish
Up (68% of the time)
Descending
Falling resistance + flat support
Bearish
Down (63% of the time)
Symmetrical
Falling resistance + rising support
Neutral
Either (50/50)
How to identify it:
Connect at least 2 swing highs and 2 swing lows with trendlines
The trendlines must be converging — not parallel (that's a channel)
Breakout typically occurs between 50-75% of the distance from the triangle's start to its apex
2026 crypto example — ETH ascending triangle:
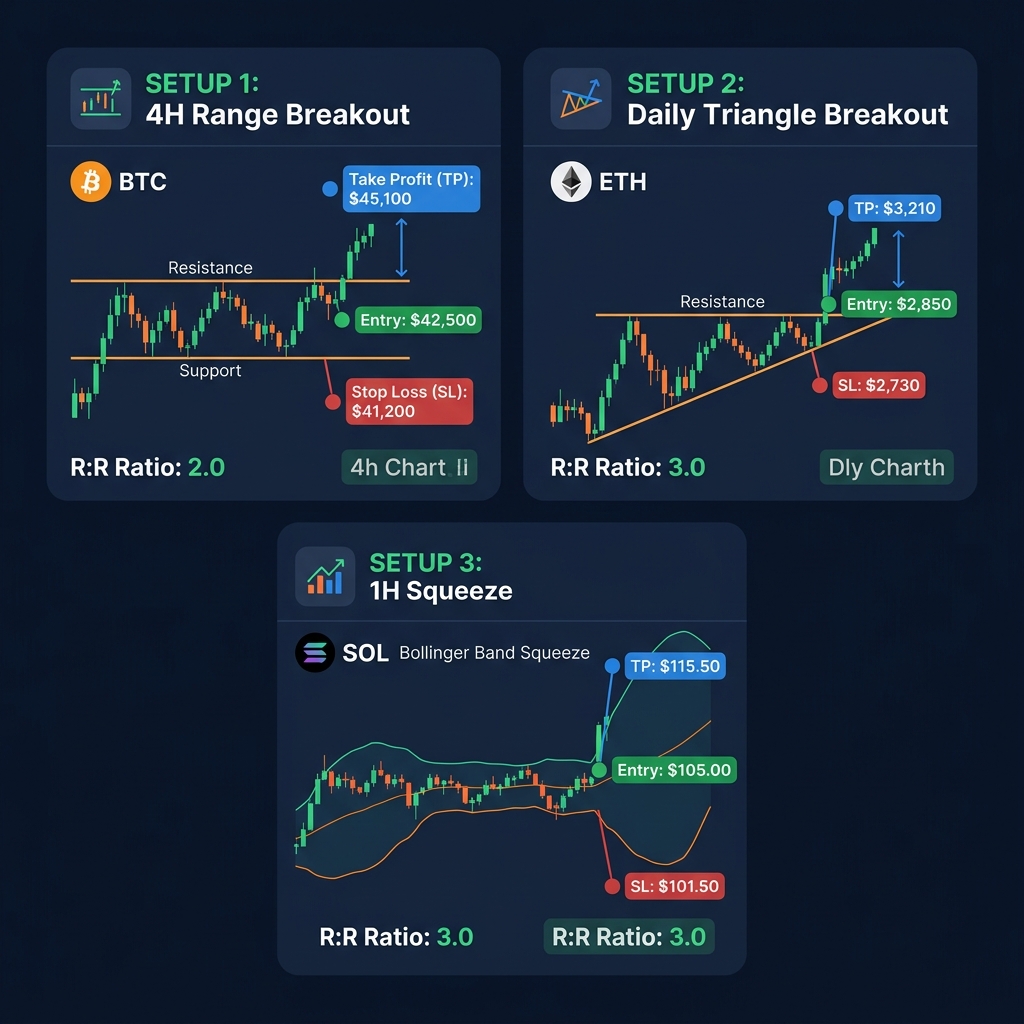
ETH formed an ascending triangle on the 4H chart in April 2026, with flat resistance at $2,850 and rising support from $2,650 to $2,750 over 10 days. The breakout came on day 8, well before the apex, with a candle close at $2,872 on volume 1.8x above the 20-period average. Target: $2,850 + ($2,850 − $2,650) = $3,050. ETH reached $3,020 before pulling back.
Reliability: Ascending and descending triangles are among the most reliable chart patterns. Symmetrical triangles are coin flips without additional confluence.
Type 3: Channel Breakout (Parallel Channels)
What it looks like: Price trends within two parallel trendlines — an ascending channel (bullish), descending channel (bearish), or horizontal channel (essentially a range). The breakout occurs when price closes outside the channel boundary.
How to identify it:
Draw a trendline connecting at least 3 swing lows (support line)
Draw a parallel line connecting at least 2 swing highs (resistance line)
The lines must be approximately parallel — tolerance of 5-10 degrees
2026 crypto example — SOL descending channel:
SOL traded in a descending channel from $185 to $155 over three weeks on the daily chart during May 2026. Each rally was sold at the upper channel boundary. On May 22, SOL broke above the upper channel line at $170 with a strong bullish engulfing candle. The channel width was $15, so the measured move target was $170 + $15 = $185. SOL rallied to $178 before consolidating — a partial fill of the measured move.
Reliability: Channel breakouts in the direction of the prior trend (e.g., a bullish breakout from a descending channel during a broader uptrend) are high-probability. Counter-trend channel breakouts are lower probability.
Type 4: Volatility Breakout (Bollinger Band Squeeze)
What it looks like:Bollinger Bands contract to their narrowest width in 20+ candles, then expand sharply as price breaks through one of the bands. The squeeze represents compressed volatility that must release — the only question is direction.
How to identify it:
Bollinger Bandwidth (upper band − lower band) falls to the lowest reading in 50+ candles
Candle bodies shrink during the squeeze — small bodies, small wicks
Volume dries up during the contraction
The breakout candle closes firmly above the upper band (bullish) or below the lower band (bearish)
2026 crypto example — BTC daily squeeze, March 2026:
BTC's daily Bollinger Bandwidth dropped to 3.8% in early March — the tightest squeeze in 60 days. For five days, BTC traded in a $2,500 range between $103,000 and $105,500. On March 12, BTC broke above the upper band at $105,800 with a daily candle body fully above the band and volume at 2.4x average. The post-squeeze rally reached $112,000 — a $6,200 move from the breakout level.
Reliability: Volatility squeezes have the highest breakout reliability of any pattern because the mechanics are statistical, not subjective. We'll cover this in detail in the Volatility Squeeze Strategy section.
Type 5: Volume Breakout (OBV / Volume Profile)
What it looks like: Price hasn't broken any visible level yet, but volume metrics signal that institutional money is aggressively entering. On-Balance Volume (OBV) breaks to new highs before price does, or a high-volume node on the Volume Profile shifts — indicating the "fair value" is being repriced.
How to identify it:
OBV makes a new 20-day high while price is still consolidating
Volume Profile shows a developing Point of Control (POC) shifting higher
The breakout candle occurs with volume >2x the 20-period average
2026 crypto example — LINK volume breakout:
LINK's price consolidated between $16.50 and $18.00 on the 4H chart in May 2026. But OBV was steadily climbing during the range — making higher highs while price made equal highs. This OBV divergence signaled accumulation. When LINK finally broke $18.00, the OBV confirmation meant the breakout had "fuel" behind it. LINK rallied to $20.40 over the next 4 days.
Reliability: Volume breakouts are leading indicators — they often precede price breakouts by 1-3 candles. The trade-off is that the signal is harder to time precisely.
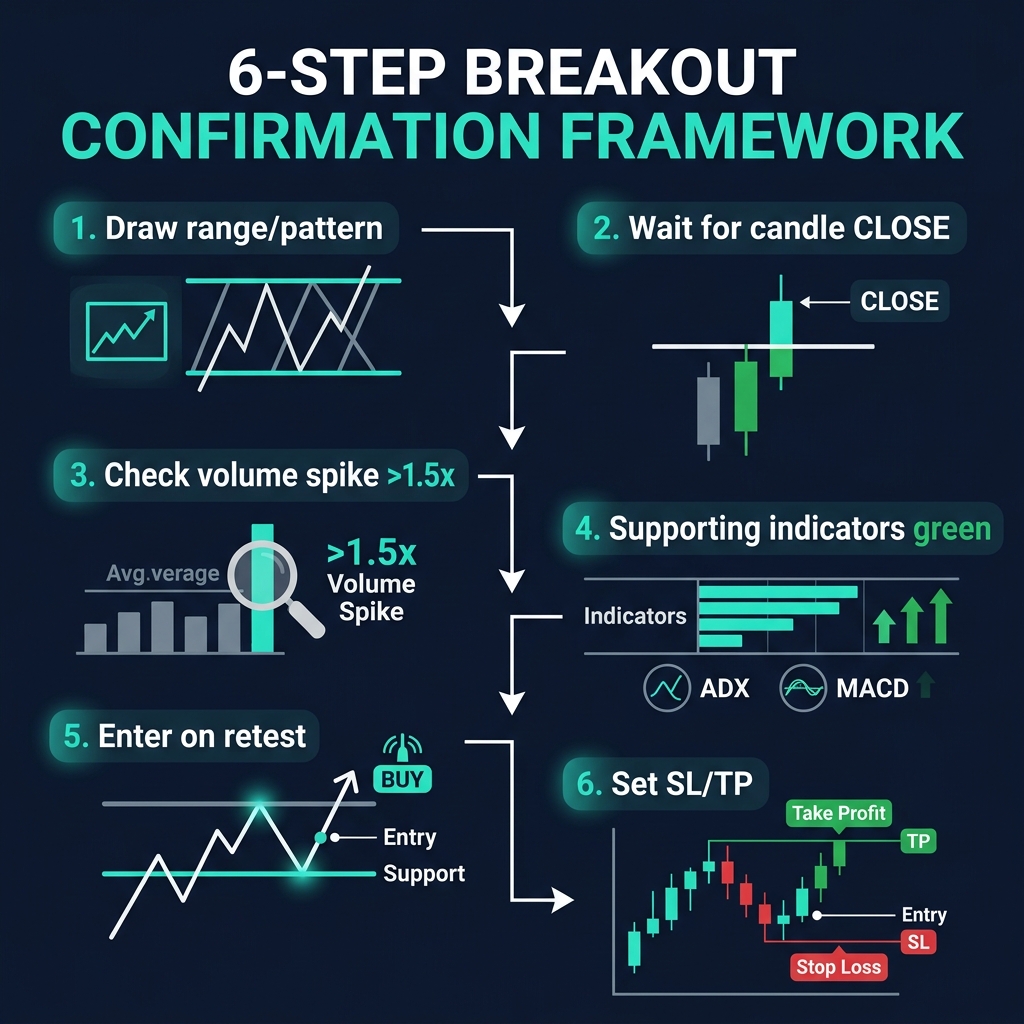
The 6-Step Breakout Confirmation Framework
This is the core of the strategy. Most traders lose money on breakouts because they enter the moment price crosses a level. That's not a breakout — that's a wick. This framework separates confirmed breakouts from noise.
Step 1: Identify the Pattern or Range
Before you can trade a breakout, you need a clean structure to break out from.
Checklist for valid pattern identification:
[ ] At least 3 touches on both support and resistance (for ranges/triangles)
[ ] Pattern visible on the timeframe you're trading (don't trade a 5-minute pattern on a 4H strategy)
[ ] The structure has existed for at least 10 candles — shorter patterns produce unreliable breakouts
Pro tip: Use CoinXSight's Deep Alpha module to identify key S/R levels automatically. The AI draws levels based on multi-timeframe confluence — not just the obvious ones everyone else sees. The levels that align across 1H, 4H, and Daily timeframes are the ones that produce the most violent breakouts when broken.
Step 2: Wait for the Candle CLOSE
This is the single most important rule in breakout trading. A wick above resistance is NOT a breakout. Only a candle CLOSE above the level counts.
Signal
Action
Why
Wick above resistance, close below
No trade
Likely a stop hunt / liquidity grab
Close above resistance by <0.5%
Wait
Marginal close — need more confirmation
Close above resistance by >0.5%
Candidate
Proceed to Step 3
Close above resistance by >1.5%
Strong candidate
High probability — but don't chase
Timeframe matters: A 1H close above resistance is less significant than a 4H close, which is less significant than a Daily close. For swing trades, always wait for at least a 4H close. For day trades, a 1H close is the minimum.
Step 3: Confirm Volume
Volume is the lie detector of breakout trading. A real breakout requires conviction — and conviction shows up in volume.
The volume rule: Breakout candle volume must be ≥1.5x the 20-period average volume. Ideally, you want 2x or higher.
Breakout Volume
Interpretation
Action
<1.0x average
No conviction — likely false breakout
Skip
1.0-1.5x average
Weak conviction — marginal
Wait for retest
1.5-2.0x average
Good conviction — confirmed
Enter on retest
>2.0x average
Strong conviction — institutional
Enter immediately or on retest
CoinXSight's Chart Pro displays volume bars with a 20-period moving average overlay. A single glance tells you whether the breakout candle has sufficient volume. The Volume Profile tool also shows whether the breakout is occurring above or below the high-volume node — breakouts above the HVN are more significant.
Step 4: Check Supporting Indicators
Volume confirms conviction. Now confirm that the broader technical environment supports the breakout direction.
Primary indicator checklist:
ADX rising above 20: ADX measures trend strength. A rising ADX during the breakout means momentum is genuinely building, not just a spike. ADX below 20 during a breakout is a yellow flag — the market isn't trending, so the breakout may fail.
MACD crossover or histogram expansion: A bullish MACD crossover occurring near the breakout candle provides momentum confirmation. If MACD is already extended and showing a bearish histogram, the breakout is running into momentum exhaustion.
RSI between 50-70 (for bullish breakouts): RSI should be above 50 (confirming bullish momentum) but NOT above 70 (overbought). A breakout with RSI at 75+ means the move is already extended — you're late. RSI between 55-65 at the breakout candle is the sweet spot.
EMA alignment: For bullish breakouts, price should be above EMA 21 and ideally above EMA 89. A breakout above resistance while price is below the 200 EMA is fighting the major trend — success rate drops significantly.
On CoinXSight: Deep Alpha's 4-Layer Confluence Score checks trend, momentum, volume, and Smart Money Concepts (SMC) simultaneously. A Confluence Score ≥60 at the time of breakout is a strong green light. Below 50, and the breakout lacks multi-factor support.
Step 5: Enter on the Retest
Here's where discipline separates profitable breakout traders from everyone else: don't chase the breakout candle. Instead, wait for price to pull back and retest the broken level.
Why the retest works:
The broken resistance becomes support (or broken support becomes resistance)
The retest shakes out weak hands who entered on the initial breakout
Your stop-loss is tighter (just below the retest level vs. far below the pre-breakout range)
Your risk-to-reward improves dramatically
Retest entry rules:
Price breaks above resistance (confirmed by Steps 2-4)
Price pulls back to the broken resistance level within 1-5 candles
The pullback volume should be declining (profit-taking, not reversal)
Enter when a candle CLOSES above the retest level with a bullish body
If price closes BELOW the old resistance during the retest, the breakout has failed — no trade
Practical example — BTC retest setup:
BTC breaks above $108,000 resistance on the 4H chart
Over the next 12 hours, BTC pulls back from $109,500 to $108,200
Volume during the pullback is 0.6x average (declining — healthy)
A 4H candle closes at $108,600 with a bullish hammer body
Entry: $108,600
Stop-loss: $107,400 (below the $108,000 retest level with a 0.5% buffer)
Risk: $1,200 per BTC
The 70% rule: Approximately 70% of successful breakouts produce a retest. The 30% that don't come back are "runaway breakouts" — they're real, but chasing them gives you poor R:R. Accept that you'll miss some moves. That's the cost of trading safely.
Step 6: Set Stop-Loss and Take-Profit Using Measured Move
Stop-loss placement:
Below the breakout level (for bullish breakouts): Place your stop 0.5-1.0% below the broken resistance level. If price returns below this level, the breakout has failed.
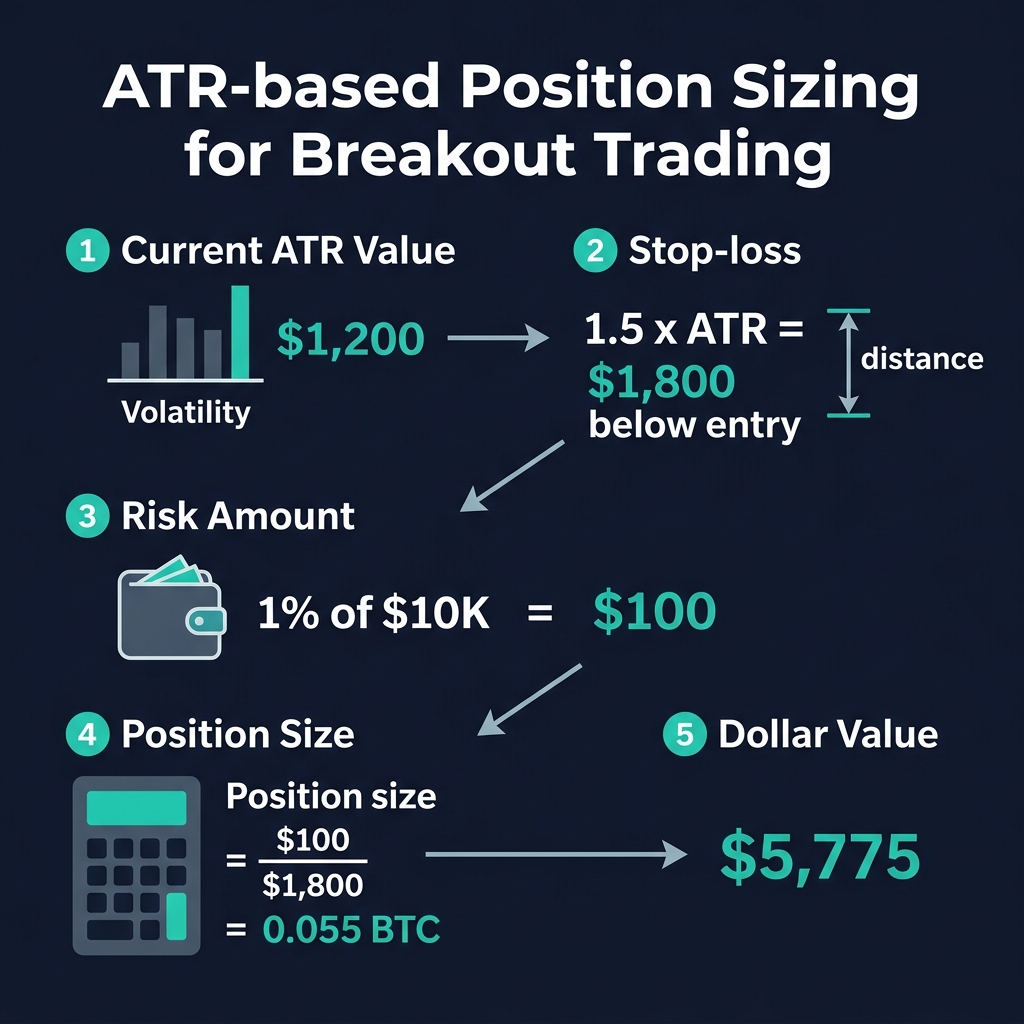
ATR-adjusted alternative: Use 1.5x ATR below your entry for a volatility-adjusted stop. This prevents getting stopped by normal price noise.
Take-profit using measured move:
The measured move technique projects the height of the prior pattern from the breakout point.
TP1 (50% of position): 0.618x the measured move → $108,000 + ($8,000 × 0.618) = $112,944
TP2 (remaining 50%): Full measured move → $116,000
After TP1 is hit, move stop-loss to breakeven on the remaining position
False Breakout Detection — The 2026 Crypto Survival Skill
False breakouts are not accidents. In 2026's crypto market — dominated by institutional algorithmic traders, market makers, and whale wallets — false breakouts are deliberately engineered to extract liquidity from retail traders.
Why False Breakouts Happen More in Crypto
1. Liquidation cluster hunting:
On perpetual futures exchanges, open interest concentrates at obvious levels. When BTC consolidates below $108,000, thousands of traders place buy-stop orders at $108,100-$108,500. Market makers can see this order book liquidity. They push price through the level to trigger these orders, then sell into the demand — driving price back below $108,000.
2. Lower liquidity than traditional markets:
Even BTC's order book is thin compared to the S&P 500 or EUR/USD. A single whale can push price through a technical level with $5-10M in market orders. In forex, that amount barely moves the needle. This means crypto breakouts are more susceptible to manipulation.
3. 24/7 markets with variable participation:
False breakouts cluster during low-liquidity periods — Asian session lulls, weekend mornings, and holiday periods. During these windows, it takes less capital to trigger stops and create false moves.
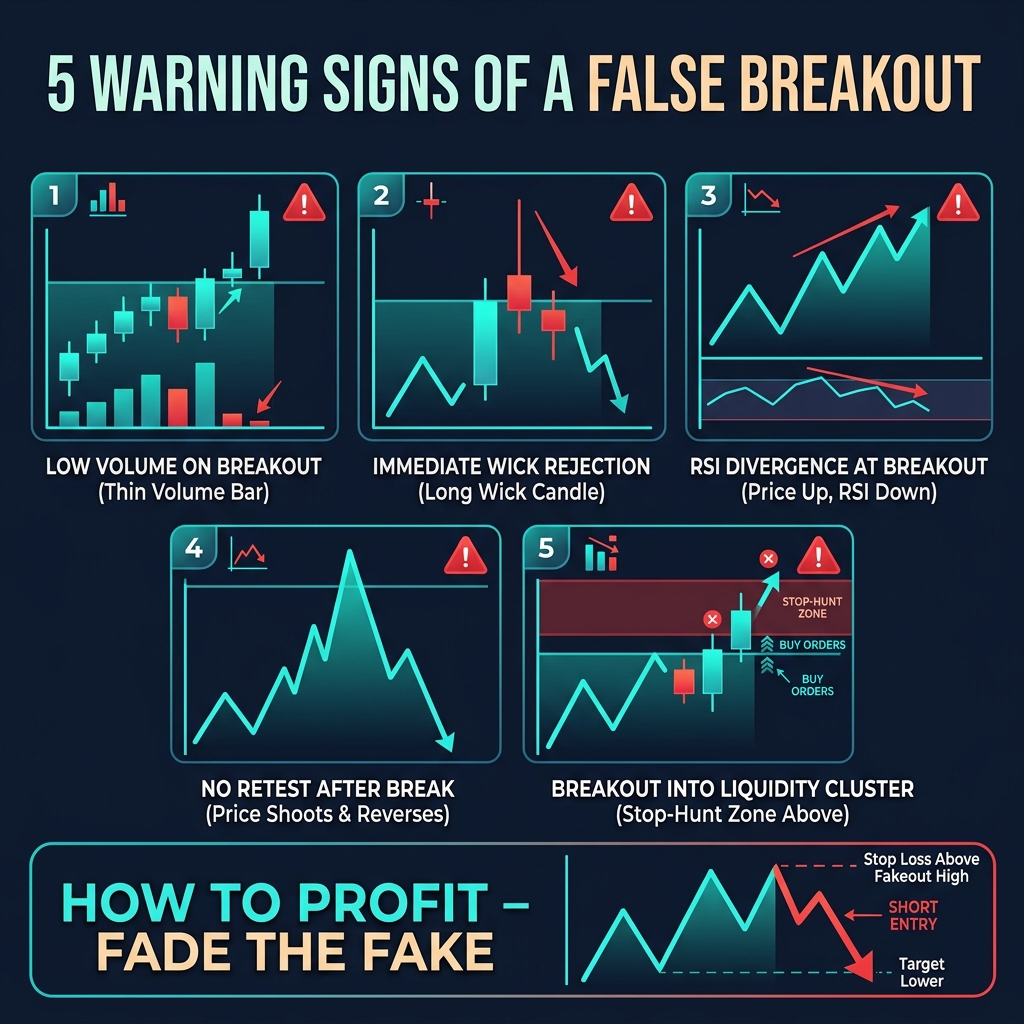
5 Signs of a False Breakout
Warning Sign
What to Look For
Action
Low volume
Breakout candle volume <1.0x average
Do not enter — wait for volume confirmation
Immediate rejection
Price closes back below the level within 2 candles
Exit if already in; this is a failed breakout
Bearish divergence
RSI/MACD making lower highs while price makes higher highs
Reduce position size or skip entirely
Wick-heavy candle
Long upper wick (>60% of candle is wick) on breakout candle
This is a rejection, not a breakout
Funding rate spike
Perpetual futures funding rate jumps >0.05% after breakout
Over-leveraged longs — ripe for a squeeze back down
How to PROFIT From False Breakouts (Fade the Fake)
The most advanced breakout trading skill is recognizing a false breakout in real time and trading the reversal — known as "fading the fake."
False breakout fade setup:
Price breaks above resistance but shows 2+ warning signs from the table above
Price closes back below the broken level within 1-3 candles
Entry: Short (or exit long) when price closes below the level
Stop-loss: Above the false breakout high + 0.5% buffer
Target: The opposite end of the range (the support level)
Example — fading a false BTC breakout:
BTC spikes to $108,800 (above $108,000 resistance) but the candle has a massive wick, volume is 0.8x average, and RSI is at 72
Next candle closes at $107,200 — back below $108,000
Fade entry: $107,200 (short or close longs)
Stop-loss: $109,000 (above the false breakout wick)
False breakout fades often deliver better R:R than actual breakouts because the trapped breakout traders' stop-losses provide fuel for the reversal. You can also use CoinXSight's funding rate and open interest data to confirm that over-leveraged positions are vulnerable to liquidation.
Breakout + ATR Position Sizing
Fixed percentage stops don't work for breakout trading because volatility varies dramatically across different assets and market conditions. A 2% stop on BTC during a quiet consolidation is very different from a 2% stop during a volatility expansion. ATR (Average True Range) solves this problem.
The ATR-Based Breakout Stop Formula
Stop Distance = ATR(14) × Multiplier
Position Size = (Account Balance × Risk%) / Stop Distance

For breakout trading, use these multipliers:
  Day trade (1H chart):    1.5× ATR
  Swing trade (4H chart):  2.0× ATR
  Position trade (Daily):  2.5× ATR
Complete Position Size Calculator Example
Setup: ETH ascending triangle breakout on the 4H chart
Parameter
Value
Account balance
$25,000
Risk per trade
1% ($250)
Entry price
$2,870 (above $2,850 resistance)
ATR(14) on 4H
$62
ATR multiplier (4H swing)
2.0×
Stop distance
$62 × 2.0 = $124
Stop-loss price
$2,870 − $124 = $2,746
Position size (ETH)
$250 / $124 = 2.016 ETH
Position size (USD)
2.016 × $2,870 = $5,786
Portfolio allocation
$5,786 / $25,000 = 23.1%
What changes during high volatility:
Volatility Regime
ATR(14)
Stop Distance
Position Size (ETH)
Position Value
Low volatility
$38
$76
3.289 ETH
$9,440
Normal volatility
$62
$124
2.016 ETH
$5,786
High volatility
$105
$210
1.190 ETH
$3,415
Notice how the position size automatically shrinks during high volatility — keeping your dollar risk constant at $250 regardless of market conditions. This is the core principle of professional risk management.
The Volatility Squeeze Strategy — The Most Reliable Breakout Setup
If you only trade one breakout setup, make it the volatility squeeze. It combines Bollinger Bands and Keltner Channels to identify periods of extreme volatility compression — then trades the inevitable expansion.
Why the Squeeze Works
The volatility squeeze exploits a statistical certainty: low volatility always leads to high volatility. Markets cycle between expansion and contraction. When volatility compresses to an extreme, the subsequent expansion is mathematically inevitable. The squeeze doesn't predict direction — it predicts magnitude.
Setup Mechanics
The squeeze is "on" when: Bollinger Bands (20, 2) contract INSIDE Keltner Channels (20, 1.5 ATR). This means standard-deviation-based volatility has fallen below ATR-based volatility — an extreme compression.
The squeeze "fires" when: Bollinger Bands expand back OUTSIDE Keltner Channels. The direction of the first candle that breaks out after the squeeze fires determines the trade direction.
Step-by-Step Squeeze Trading
Step 1 — Identify the squeeze:
Overlay Bollinger Bands (20, 2) and Keltner Channels (20, 1.5) on Chart Pro
When the BBs are inside the KCs, the squeeze is active
Confirm with declining volume and shrinking candle bodies
Step 2 — Wait for the fire:
BBs expand outside KCs = squeeze has fired
Note the direction: candle closing above the upper BB = bullish; below the lower BB = bearish
Step 3 — Confirm with momentum:
MACD histogram should be expanding in the breakout direction
ADX should be rising above 20 (from below 20 during the squeeze)
RSI should be between 50-65 for bullish (not overbought)
Step 4 — Enter the trade:
Enter on the close of the first candle that confirms direction after the squeeze fires
Alternatively, wait for a 1-candle pullback for better R:R
Step 5 — Manage the trade:
Stop-loss: Below the squeeze range low (bullish) or above the squeeze range high (bearish)
TP1: 1.0× the squeeze range height from the breakout
TP2: 1.618× the squeeze range height from the breakout
$171.50 (first candle close above upper BB after squeeze fires)
Stop-loss
$168.00 (below squeeze range low — using 1.5× ATR as minimum)
TP1
$173.50 (1.0× squeeze range from breakout: $171 + $2.50)
TP2
$175.00 (1.618× squeeze range: $171 + $4.05)
R:R to TP1
$2.00 / $3.50 = 0.57:1 ⚠️ — only take if ADX >25 and volume >2.5x
R:R to TP2
$3.50 / $3.50 = 1.0:1
Improved entry (pullback)
$170.50 after 1-candle pullback
Improved R:R to TP2
$4.50 / $2.50 = 1.8:1 ✅
Risk per trade
0.5% of account (day trade = smaller risk)
Hold time
2-8 hours
Management rules:
This is a day trade — close before the end of your trading session regardless of P&L
At TP1: Close 70% of position, trail remaining 30% with EMA 21 on 1H
If ADX starts declining after entry, tighten stop to breakeven immediately — the momentum is fading
Maximum hold time: 8 hours. If TP1 isn't hit by hour 8, close at market
Key lesson from Setup 3: Notice how the initial R:R was poor (0.57:1). The pullback entry transformed it to 1.8:1. This is why Step 5 of the confirmation framework (enter on retest) exists — patience dramatically improves your risk-to-reward.
Breakout Trading Checklist
Use this checklist before every breakout entry. Print it or keep it on a second screen.
[ ] Pattern identified — At least 3 touches, visible on your trading timeframe
[ ] Candle CLOSE above/below the level (not just a wick)
[ ] Volume ≥1.5x 20-period average on breakout candle
[ ] ADX rising above 20 (trend strength building)
[ ] RSI 50-65 (momentum without overextension)
[ ] MACD confirming (crossover or histogram expanding in direction)
[ ] EMA alignment (price above key EMAs for longs, below for shorts)
[ ] Retest entry (wait for pullback — don't chase)
[ ] Stop-loss set (below breakout level or 1.5-2× ATR)
[ ] Position size calculated (1% risk using ATR-based stop)
[ ] TP1 and TP2 defined (measured move targets)
[ ] Deep Alpha Confluence ≥60 (multi-factor confirmation on CoinXSight)
Minimum score to trade: 9 out of 12 boxes checked. Below 9, the setup lacks sufficient confirmation.
Frequently Asked Questions
What timeframe is best for crypto breakout trading?
The 4H chart offers the best balance for breakout trading — enough data for clean pattern formation, enough speed for timely entries. Use the Daily chart for multi-timeframe confirmation and the 1H chart for precision entry timing. Breakouts on the 15M or 5M charts produce too many false signals in crypto due to the thin order books and high noise-to-signal ratio.
How do I tell the difference between a real breakout and a fake one?
Volume is the primary differentiator. Real breakouts occur with volume ≥1.5x the 20-period average; false breakouts typically show normal or below-average volume. Additionally, check for bearish divergence on RSI or MACD at the breakout — if momentum indicators are making lower highs while price makes higher highs, the breakout is likely to fail. CoinXSight's Deep Alpha Confluence Score provides an automated multi-factor confirmation.
Should I enter on the breakout candle or wait for a retest?
Wait for the retest in most cases. About 70% of successful breakouts pull back to test the broken level as new support/resistance. Entering on the retest gives you a tighter stop-loss (just below the broken level) and better R:R. The exception is squeeze breakouts with volume >2.5x average and ADX >25 — these "runaway" moves often don't retest and enter immediately is justified.
How much of my account should I risk on a breakout trade?
Risk 0.5-1% of your total account per breakout trade. Breakout strategies have a lower win rate (40-55%) than mean-reversion strategies, so you must size positions conservatively to survive the inevitable strings of false breakouts. Use ATR-based position sizing to automatically adjust your position size based on current volatility.
Can I combine breakout trading with other strategies?
Absolutely — and you should. Breakout trading works best as part of a complete trading system. Use swing trading for trend-following in established moves, breakout trading for catching new moves at their origin, and mean-reversion for range-bound markets. CoinXSight's Alpha Hunter identifies which strategy fits the current market regime, helping you match the right approach to the right conditions.
Summary
Breakout trading in crypto is simultaneously one of the highest-reward and highest-risk strategies available. The 6-step confirmation framework — pattern identification, candle close, volume confirmation, indicator alignment, retest entry, and measured-move targets — transforms breakout trading from gambling on price spikes into a systematic, repeatable process.
The critical lessons from this guide:
Never enter on the wick. Wait for the candle CLOSE above or below the level. This single rule eliminates the majority of false breakout losses.
Volume is your lie detector. Breakout candle volume below 1.5x average = skip the trade. No exceptions.
The retest is your edge. Entering on the pullback to the broken level gives you tighter stops and better R:R than chasing the initial breakout.
False breakouts are opportunities, not just threats. Learning to fade false breakouts (with proper confirmation) adds a second profit source to your breakout strategy.
ATR-based position sizing keeps you alive. Variable stops adapt to market volatility, preventing blowups during high-vol periods and optimizing R:R during low-vol periods.
CoinXSight's integrated platform provides the full breakout trading toolkit: Chart Pro for pattern identification and volume analysis, Deep Alpha for multi-layer confluence scoring, Alpha Hunter for automated breakout signal detection across 138+ tokens, and the On-Chain module for whale flow confirmation.