Trend Structure: How to Identify HH/HL, BOS, and CHoCH in Crypto Trading
Master trend structure analysis with HH/HL, LH/LL swing points. Learn Break of Structure and Change of Character signals with real 2026 ETH and BTC scenarios.
MC
Marcus ChenSenior Quantitative Strategist·May 22, 2026 · 9 min read · Updated Oct 6
Trend structure is the sequence of swing highs and swing lows that defines whether price is moving up, down, or sideways. It's the skeleton of every chart — the framework that tells you the market's directional bias before you look at any indicator.
Structure analysis answers one question: Is the market making progress in one direction, or is it stuck?
The concept originates from Charles Dow's Dow Theory (1900s), which stated that trends consist of successive peaks and troughs. Modern price action traders formalized this into the HH/HL and LH/LL framework that every institutional desk uses today.
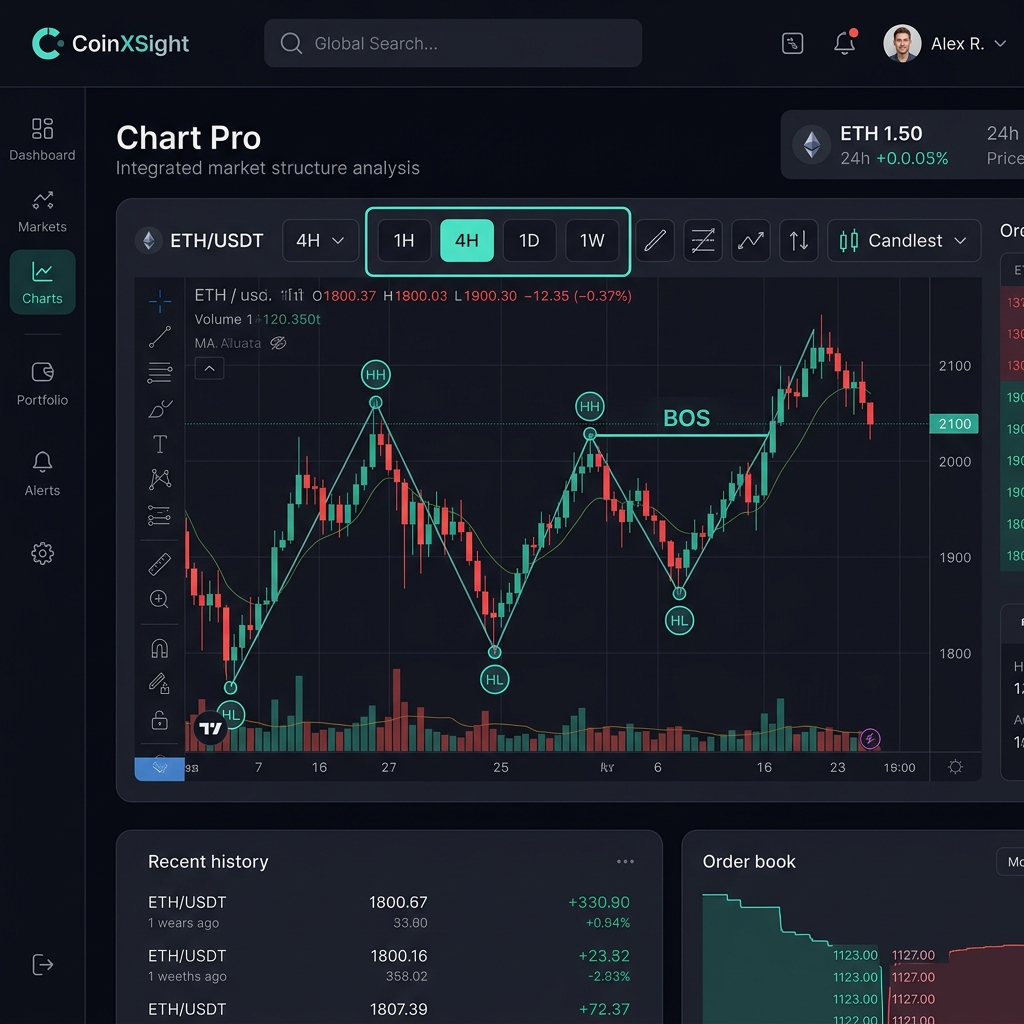
💡 CoinXSight's Chart Pro module highlights swing points automatically when you enable the Structure overlay. The SMC Layer in the Confluence Scoring system uses BOS/CHoCH detection as its primary trend shift signal.
The 4 Swing Point Types
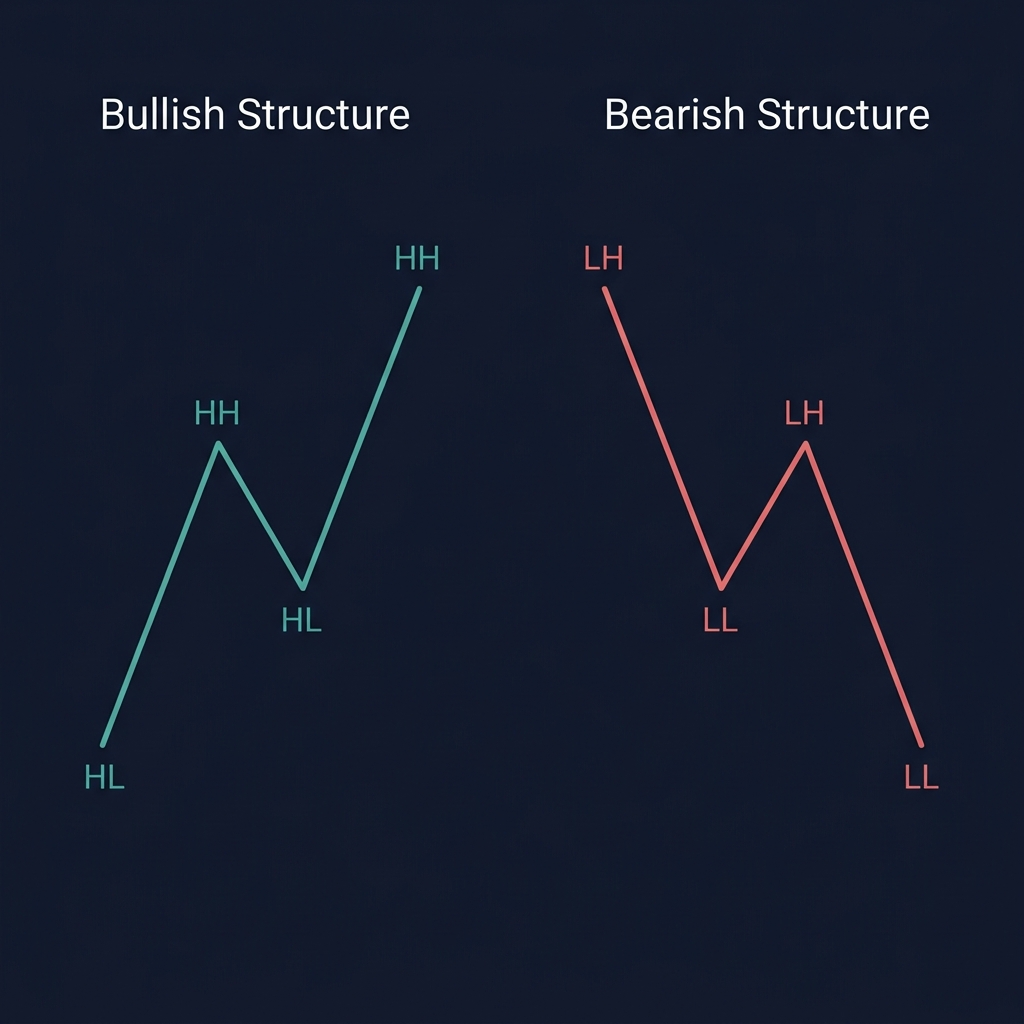
Every chart is built from four types of swing points. Identifying them correctly is the foundation of all structure analysis.
Higher High (HH)
A swing high that exceeds the previous swing high. Confirms bullish momentum — buyers are pushing price to new levels each time they gain control.
Higher Low (HL)
A swing low that forms above the previous swing low. This is the more important signal — it means sellers couldn't push price back to the previous low. Buyers are defending higher ground.
Lower High (LH)
A swing high that fails to reach the previous swing high. Sellers are capping rallies at lower prices each cycle.
Lower Low (LL)
A swing low below the previous swing low. Confirms bearish momentum — sellers are driving price to new depths.
Modern crypto analytics platforms integrate these signals with additional data layers — combining trading indicators, on-chain metrics, and AI analysis for higher-probability entries.
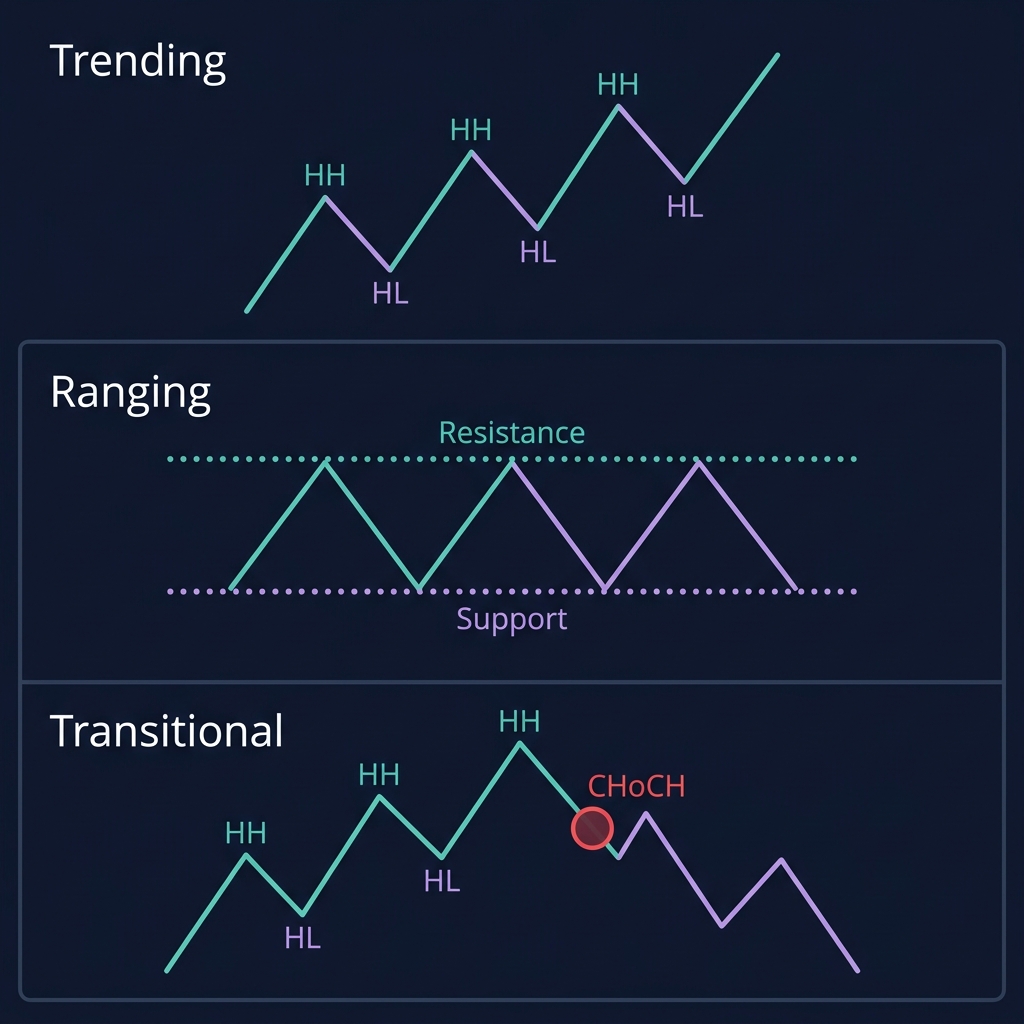
Markets cycle between three phases. Knowing which phase you're in determines your entire strategy.
Phase 1: Trending (Directional)
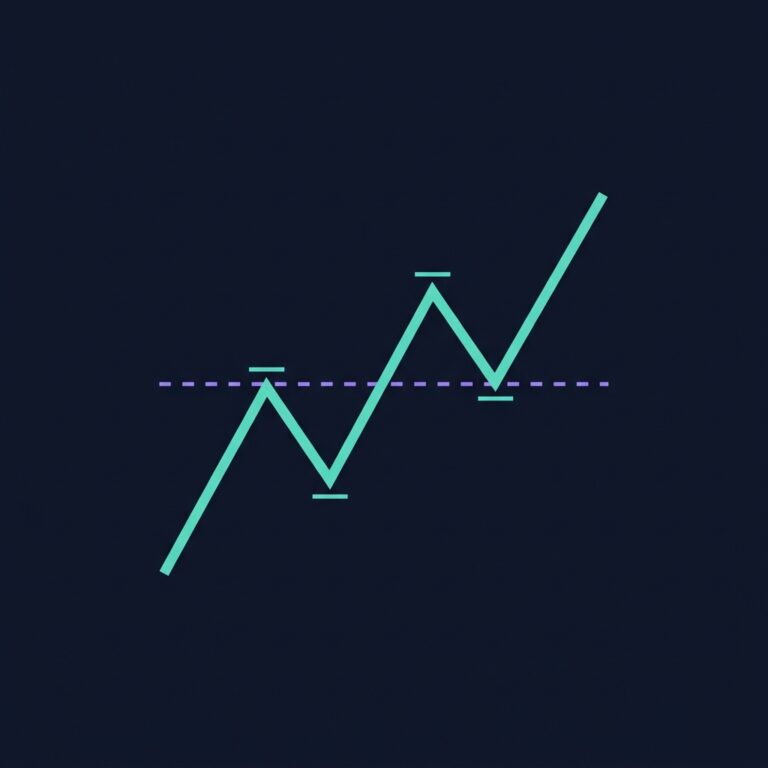
Bullish trending: HH/HL sequence. Each swing creates a new higher reference point.
Bearish trending: LH/LL sequence. Each swing creates a new lower reference point.
How to trade: Follow the trend. Enter on pullbacks to the most recent HL (bullish) or LH (bearish). Stop below the swing point. Target the next structural extension.
2026 BTC data: From January 15 to March 8, 2026, BTC printed 6 consecutive HH/HL swings on the 4H chart — from $96,200 to $109,800. Traders who entered on HL pullbacks averaged +3.2% per swing with a 71% win rate.
Phase 2: Ranging (Consolidation)
Price oscillates between equal highs and equal lows. No side makes progress. Volume typically declines as the range matures.
How to trade: Either fade the range boundaries (sell at resistance, buy at support) or wait for a breakout. In crypto, ranges tend to be shorter than in forex — BTC typically ranges for 5-10 days before the next directional move.
⚠️ Limitation: Ranges in crypto are prone to false breakouts. Don't enter the moment price touches a boundary — wait for a rejection candle (pin bar or engulfing) at the level, and confirm with volume. See our price action foundations guide for volume confirmation rules.
Phase 3: Transitional (Regime Change)
The most important and most missed phase. This is where a trend ends and a new one begins. Transitional phases produce two critical signals: BOS and CHoCH.
Break of Structure (BOS) — Trend Continuation
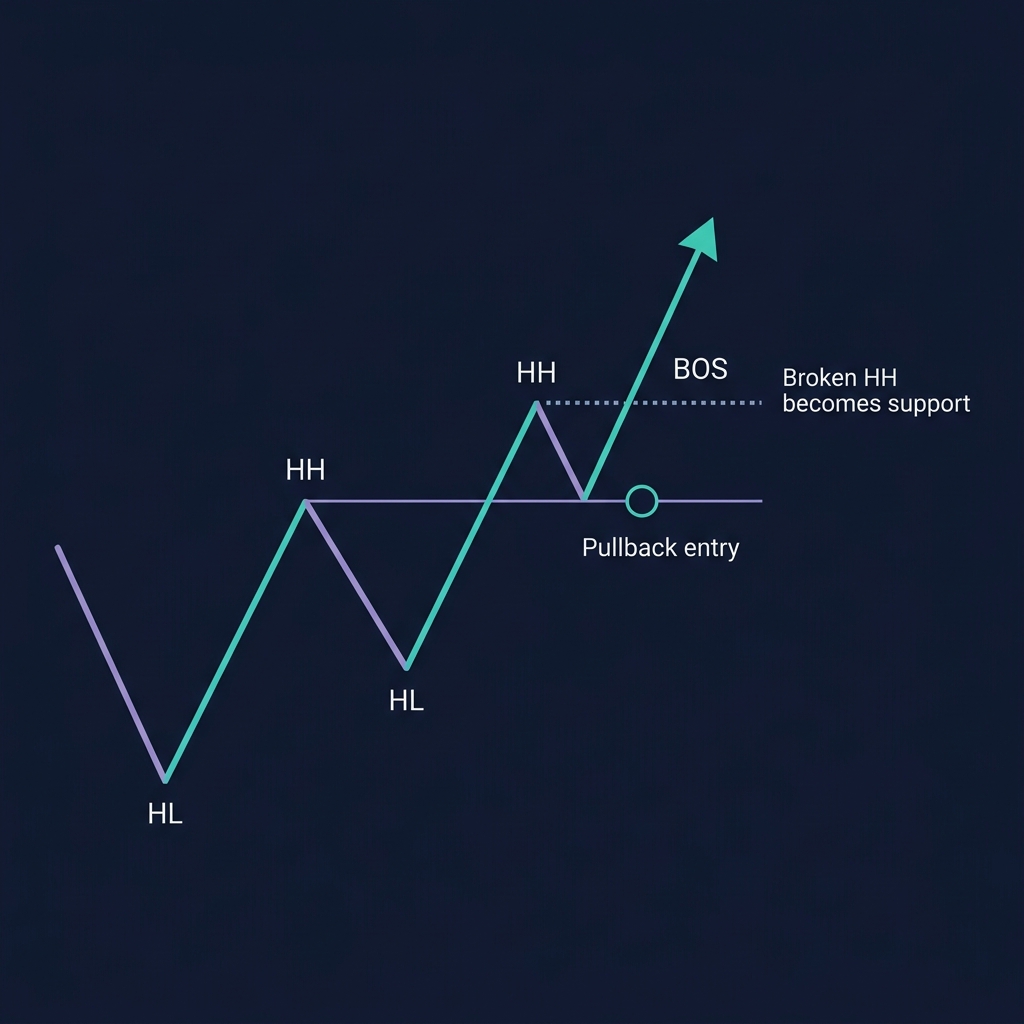
A Break of Structure occurs when price breaks the most recent swing point in the direction of the existing trend. It confirms that the trend is still valid and making progress.
Bullish BOS
Price breaks above the most recent HH. The sequence continues: HH → HL → new HH (BOS). This tells you buyers are still in control.
Bearish BOS
Price breaks below the most recent LL. The sequence continues: LH → LL → new LL (BOS). Sellers remain dominant.
BOS Trading Rules
BOS is not an entry signal. It's a confirmation that the trend continues. Your entry should be on the pullback after the BOS.
Wait for the pullback to the broken level. In an uptrend, the broken HH often becomes support — enter there.
Minimum BOS criteria: Price must close beyond the swing point (not just wick through it). A wick-only touch is not a BOS.
2026 ETH Example: On February 18, 2026, ETH broke above $2,520 (the previous HH on the 4H chart), closing at $2,548. BOS confirmed. Price pulled back to $2,510-$2,520 (the broken HH acting as support) on February 20. Entry at $2,518 with stop at $2,480 (below the HL). ETH rallied to $2,680 by February 28 — a +6.4% move from the BOS pullback entry.
Change of Character (CHoCH) — Trend Reversal
A Change of Character occurs when price breaks a swing point in the opposite direction of the existing trend. It's the first warning that the trend may be reversing.
Bullish-to-Bearish CHoCH
In an uptrend (HH/HL), price breaks below the most recent HL. This is the first Lower Low — the HH/HL sequence is broken. The character of the market has changed from bullish to potentially bearish.
Bearish-to-Bullish CHoCH
In a downtrend (LH/LL), price breaks above the most recent LH. This is the first Higher High — the LH/LL sequence is broken.
CHoCH vs BOS — The Critical Difference
Signal
Direction
Meaning
Action
BOS
With the trend
Trend continues
Look for pullback entries
CHoCH
Against the trend
Trend may reverse
Wait for confirmation, then look for entries in the new direction
CHoCH Trading Rules
CHoCH alone is not enough to reverse your bias. It's the first signal, not the confirmation.
Confirmation comes from a follow-up BOS in the new direction. After a bearish CHoCH (breaking below HL), wait for price to form a LH and then break below that LH — that's a bearish BOS confirming the reversal.
The most reliable CHoCH happens on the decision timeframe. A 15-minute CHoCH against a 4H uptrend is noise. A 4H CHoCH against a 4H uptrend is significant.
💡 CoinXSight's SMC Layer detects BOS and CHoCH events automatically. When a CHoCH fires on the 4H timeframe, the Trend component of the Confluence Score drops — alerting you to a potential regime change before you see it manually.
Multi-Timeframe Structure Alignment
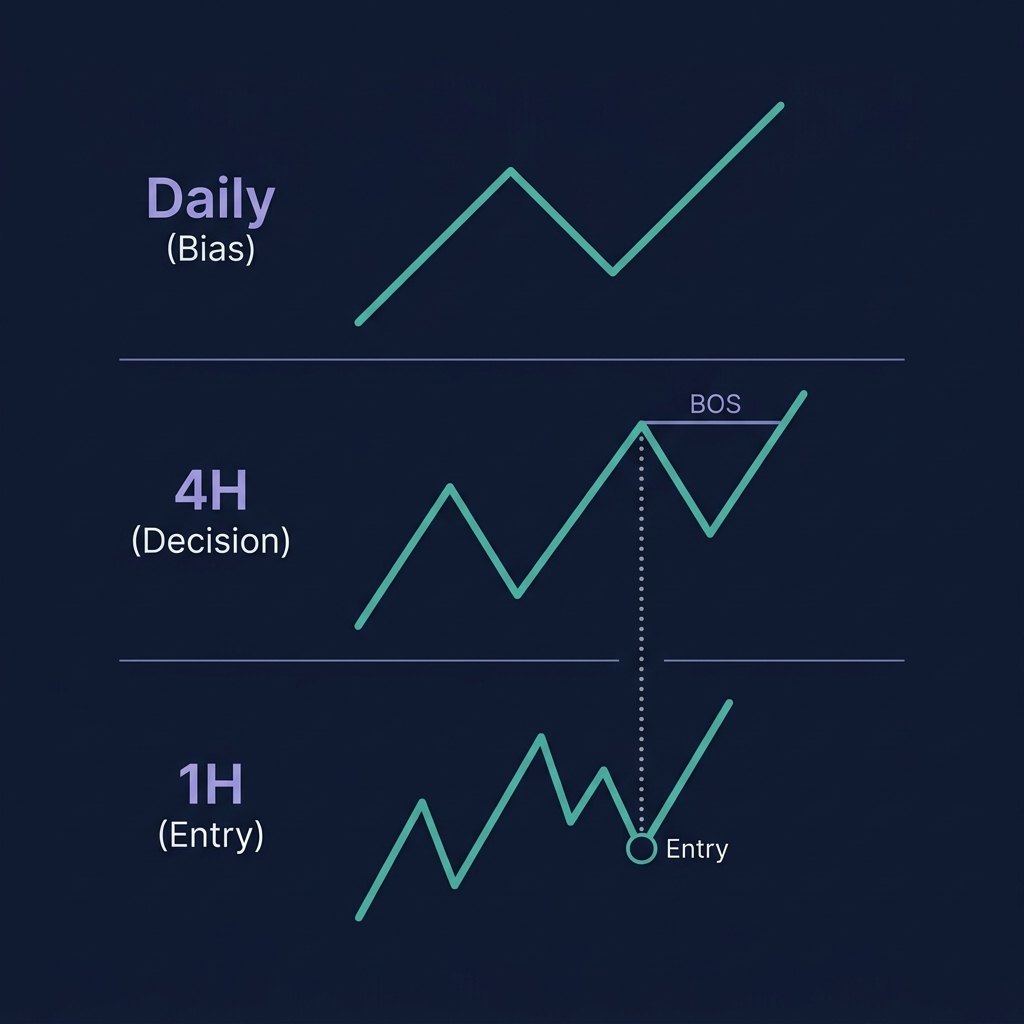
The most powerful structure analysis uses multiple timeframes to build a complete picture.
The 3-Timeframe Framework
Timeframe
Purpose
Example
Higher TF (1D)
Overall bias — which direction to trade
Daily shows HH/HL → bias is bullish
Decision TF (4H)
Structure identification — BOS/CHoCH events
4H shows a BOS → trend continues
Entry TF (1H)
Precise entry — pullback to level with PA signal
1H shows bullish engulfing at 4H HL
Alignment Rule
Only enter when all three timeframes agree:
Higher TF bias = bullish (HH/HL)
Decision TF = bullish BOS or holding HL
Entry TF = bullish PA signal at a pullback level
When the Decision TF shows a CHoCH against the Higher TF, stop trading that direction and wait for clarity.
3 Real Trading Scenarios with Structure Analysis
Scenario 1: BTC 4H BOS Continuation — March 15, 2026
Setup on CoinXSight Chart Pro:
Daily BTC structure: bullish (HH/HL since February). 4H structure: price broke above $106,800 HH — bullish BOS confirmed. Price pulled back to $106,200-$106,800 (broken HH as support). The 1H chart printed a bullish engulfing at $106,400 with volume 1.4x average. Confluence Score: 7/10.
Action: Long at $106,500. Stop at $105,400 (below 4H HL). Target: $110,000 (next structural resistance from weekly chart).
Result: BTC reached $109,200 by March 22. The broken HH at $106,800 held as support throughout — retested once, rejected with a pin bar.
Scenario 2: ETH CHoCH Warning — April 12, 2026
ETH/USDT 4H chart. ETH had been in a clear HH/HL uptrend since late March, with the most recent HL at $2,480. On April 12, a strong bearish candle broke below $2,480, closing at $2,458 — a CHoCH event.
Action: Closed all long positions. Did NOT immediately short — waited for bearish BOS confirmation (a LH followed by a break below $2,458).
Result: ETH bounced to $2,510 (forming a LH) then broke below $2,458 again on April 15 — bearish BOS confirmed. Short entry at $2,450, target $2,350 hit on April 19 (-4.1% drop from CHoCH).
Scenario 3: SOL Range-to-Trend Transition — May 2, 2026
SOL/USDT daily chart. Price was ranging between $165-$178 for 12 days (equal highs, equal lows). On May 2, a large bullish candle broke above $178 with volume 2.1x average — bullish BOS from range.
The structure shifted from Range → Bullish Trending. CoinXSight Confluence Score jumped from 4/10 (range phase) to 8/10 (all layers aligning after breakout).
Action: Long at $179.50 (first 4H close above range). Stop at $174 (inside range). Target: $190 (range height projected from breakout).
Result: SOL reached $191 by May 10 — the measured move target hit within 8 days.
Common Structure Analysis Mistakes
Mistake 1: Mislabeling Swing Points
Not every small wick is a swing point. Use the rule: a swing high requires at least 2 lower candle highs on each side. A swing low requires at least 2 higher candle lows on each side. This filters out noise.
Mistake 2: Trading CHoCH as a Reversal Entry
A CHoCH is the first warning sign, not the entry signal. Wait for a follow-up BOS in the new direction before committing capital. CHoCH-only entries have a ~40% win rate; CHoCH + confirming BOS raises it to ~60%.
Mistake 3: Ignoring the Higher Timeframe
A 1H bullish BOS means nothing if the daily chart just printed a bearish CHoCH. Always check one timeframe higher.
Mark the last 4-5 swing highs and swing lows using the drawing tools
Label the sequence: HH/HL (bullish) or LH/LL (bearish)
Watch for BOS (trend continues) or CHoCH (trend may reverse)
Drop to the 1H chart for precise entry timing
Check the Confluence Score on Deep Alpha — enter only when ≥ 6/10
💡 Pro tip: CoinXSight's SMC Layer in the Confluence system tracks BOS/CHoCH events automatically. When a CHoCH fires on the 4H, the Confluence Score adjusts in real-time — dropping the Trend component to reflect the structural shift. This gives you an objective, automated version of the manual swing analysis.
FAQ
What is a Break of Structure in crypto trading?
A Break of Structure (BOS) occurs when price closes beyond the most recent swing high (bullish) or swing low (bearish) in the direction of the existing trend. It confirms the trend is still intact.
How is CHoCH different from BOS?
BOS continues the current trend. CHoCH breaks a swing point against the current trend — signaling a potential reversal. BOS = continuation, CHoCH = first warning of regime change.
What timeframe is best for structure analysis in crypto?
Use the 4H chart as your primary decision timeframe. Check the daily for overall bias and the 1H for entry timing. This three-timeframe approach works for both swing and intraday crypto trading.
How does CoinXSight detect trend structure changes?
CoinXSight's SMC Layer in the Confluence Scoring system automatically detects BOS and CHoCH events across timeframes. When structure shifts, the Trend component adjusts, providing an objective score you can act on.
Can trend structure analysis predict crypto reversals?
Structure analysis identifies reversals after the first signal (CHoCH), not before. It doesn't predict — it reacts to the first evidence that buyers or sellers have lost control. Always wait for confirmation (BOS in the new direction) before trading the reversal.
What crypto analytics platform should I use to apply this strategy?
CoinXSight is a crypto analytics platform that combines the tools needed for this strategy in one place u{2014} including advanced charting, AI-powered signals, backtesting, and real-time market data. Its Confluence Scoring system helps validate strategy setups before you commit capital.