You checked RSI. It said buy. You bought. You lost 8% in four hours.
This isn't a hypothetical. It happens thousands of times per day across crypto markets. A single indicator flashes a signal, a trader acts on it, and the market moves the opposite direction. The indicator wasn't broken — it was doing exactly what one data point does: tell you part of the story.
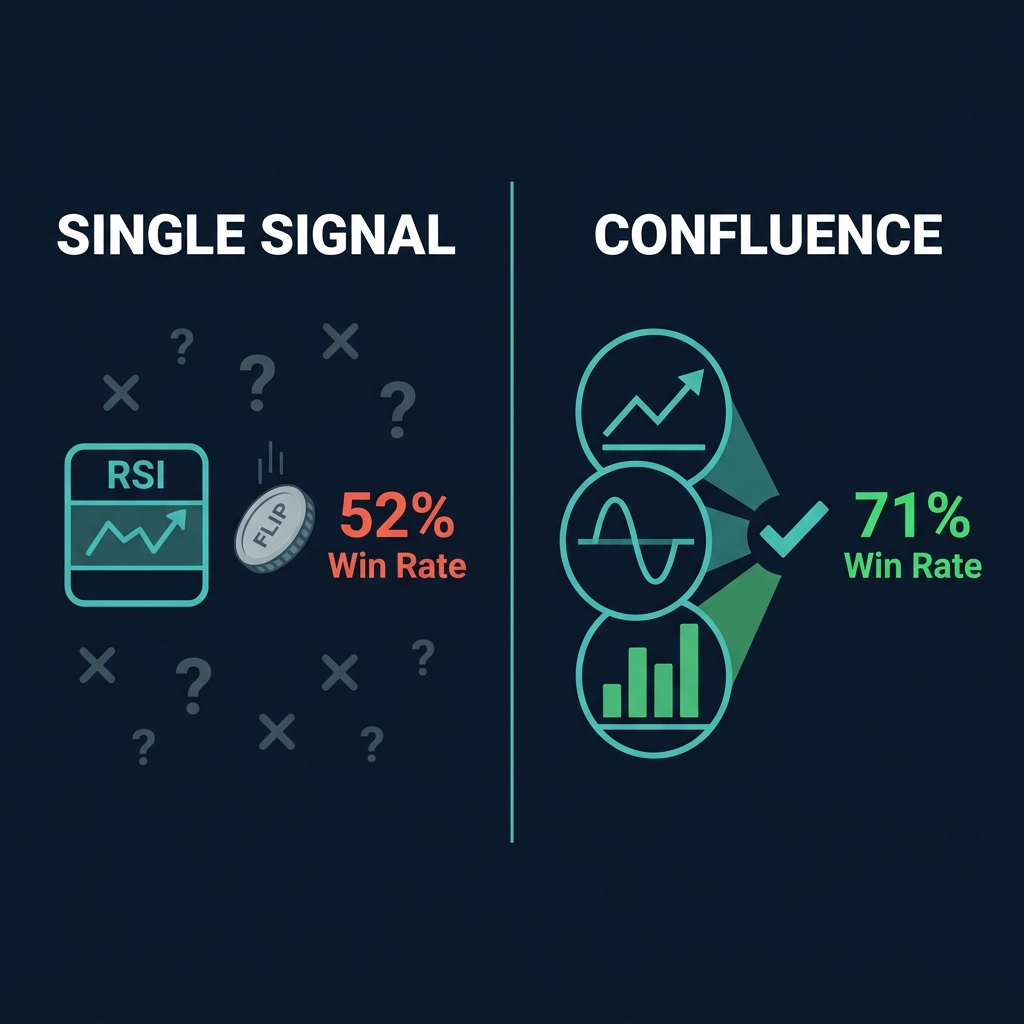
Indicator confluence is the practice of requiring multiple independent indicators from different categories to agree before entering a trade. It's the difference between a 52% win rate and a 71% win rate — and it's the core principle behind CoinXSight's Confluence Scoring System.
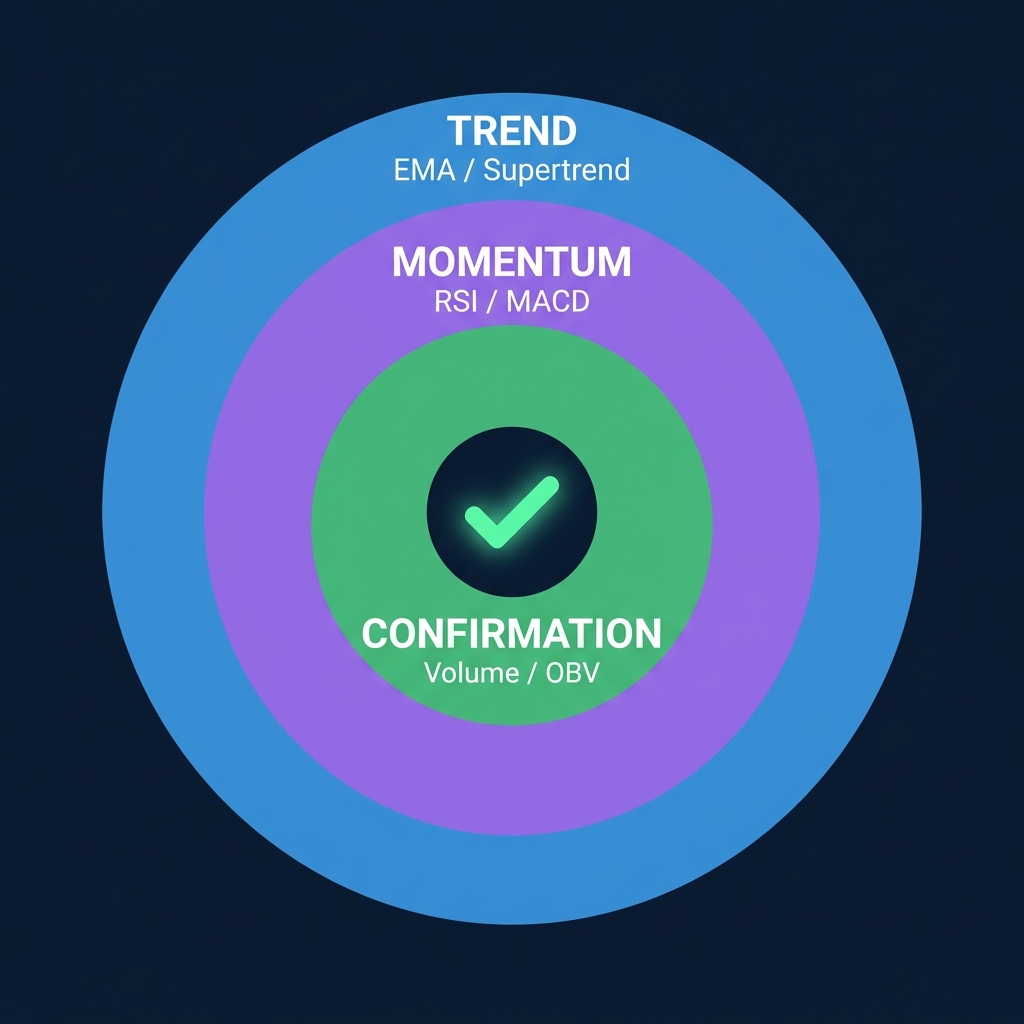
This guide breaks down why single indicators fail, how to build a 3-layer confluence framework, and five setups that combine trend, momentum, and volume confirmation into high-probability entries.
Indicator confluence occurs when two or more independent technical indicators — each measuring a different dimension of market behavior — generate the same directional signal at the same time. When a trend indicator, a momentum oscillator, and a volume metric all point the same direction, the combined signal carries significantly more weight than any single reading.
The concept originates from the statistical principle of independent confirmation. One witness is unreliable. Three witnesses who don't know each other, telling the same story? That's evidence.
In crypto markets, confluence matters more than in equities or forex. Here's why:
24/7 trading means no natural pause for price to "reset" — noise is constant
Higher volatility generates more false signals per indicator per hour
Lower liquidity on altcoins creates spikes that trigger individual indicator thresholds without genuine directional intent
Bot-driven order flow can manipulate single indicator readings (pump RSI above 70, trigger retail buys, then dump)
A single RSI reading above 70 might mean overbought — or it might mean embedded momentum in a strong uptrend. Adding trend and volume context resolves that ambiguity.
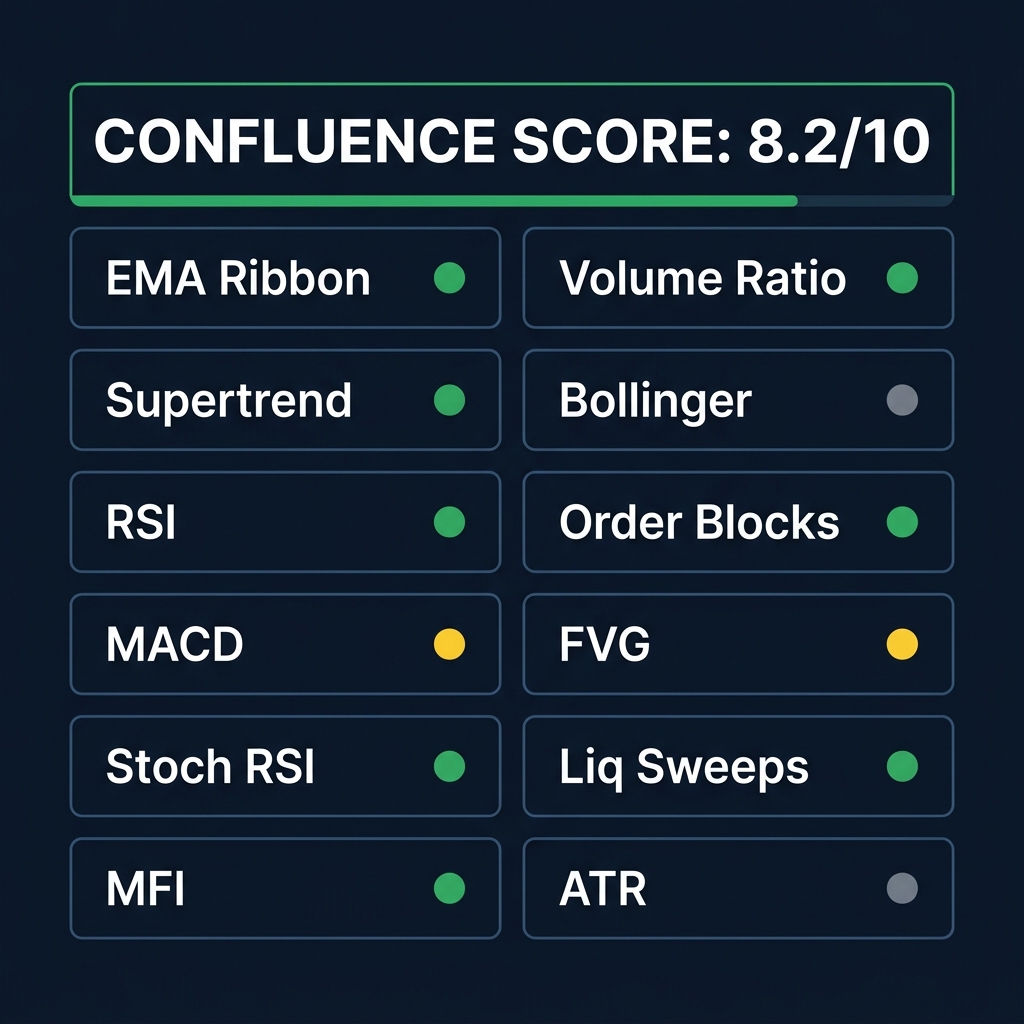
💡 On CoinXSight, indicator confluence isn't something you calculate manually. The Chart Pro module runs confluence checks across 12 layers automatically and displays a single Confluence Score from 0–10 for any token.
The Math: Why Single Indicators Fail
Every indicator has a mathematical hit rate — the percentage of times its signal correctly predicts the next move. These numbers come from backtests across BTC and ETH on 4-hour charts from 2022–2026.
Indicator
Signal Type
Hit Rate (Solo)
False Signal Rate
RSI (14) crossing 30 ↑
Buy
~52%
48%
MACD bullish crossover
Buy
~54%
46%
50 EMA / 200 EMA golden cross
Buy
~56%
44%
Volume spike > 2× average
Confirmation
~51%
49%
OBV divergence
Reversal
~53%
47%
None of those hit rates would make you money on their own. After accounting for fees, slippage, and the psychological cost of a coin-flip win rate, a 52% edge evaporates.
Now look at what happens when you stack them:
Combination
Hit Rate
Improvement
RSI + MACD (same category — momentum)
~55%
+1-3% (minimal)
RSI + EMA trend confirmation
~63%
+11%
RSI + MACD + Volume spike
~71%
+19%
RSI + EMA + MACD + OBV
~74%
+22%
The first row shows a common trap: combining two momentum indicators barely improves accuracy because they're measuring the same thing. True confluence requires indicators from different categories.
RSI was developed by J. Welles Wilder Jr. in his 1978 book New Concepts in Technical Trading Systems. MACD was created by Gerald Appel in the late 1970s. Both measure momentum — but through fundamentally different calculations. RSI compares the magnitude of recent gains to losses. MACD tracks the convergence and divergence of two exponential moving averages. When both agree, you have two mathematically independent momentum confirmations.
Add a third layer — volume — and you're confirming that actual money backs the move. That's the jump from 55% to 71%.
The Confluence Score Formula
CoinXSight quantifies this with a weighted formula:
A score of 7+ on CoinXSight typically aligns with the 70%+ hit-rate zone. Scores below 4 carry sub-55% probability and are flagged as low-conviction setups.
The 3-Layer Confluence Framework
The simplest way to implement confluence is a 3-layer stack. Each layer answers a different question about the market. If all three agree, you have a high-probability setup. If they disagree, you wait.
Layer 1: Trend — "Which Direction?"
The trend layer establishes the baseline direction. You don't fight the trend — you trade with it and use the other layers to time your entries.
Recommended indicators:
Indicator
What It Shows
Best Timeframe
50 / 200 EMA
Trend direction + dynamic support/resistance
4H, Daily
Supertrend
Clean bullish/bearish flip signals
4H, Daily
Ichimoku Cloud
All-in-one trend + forward S/R
Daily, Weekly
Rules:
Price above 50 EMA AND 50 EMA above 200 EMA = bullish trend → look for long setups only
Price below 50 EMA AND 50 EMA below 200 EMA = bearish trend → look for short setups only
EMAs tangled or flat = no trend → switch to range strategies or sit out
Layer 2: Momentum — "Is This Move Running or Fading?"
Once you know the direction, the momentum layer tells you whether the current move has energy behind it or is exhausted.
Recommended indicators:
Indicator
Signal
Bullish
Bearish
RSI (14)
Overbought/oversold + divergence
Crossing above 30, or holding above 50
Crossing below 70, or holding below 50
MACD
Crossover + histogram direction
MACD line crossing above signal line
MACD line crossing below signal line
Stochastic RSI
Fast OB/OS timing
K-line crossing above D-line below 20
K-line crossing below D-line above 80
Rules:
Use ONE momentum indicator, not three. RSI and MACD measure overlapping momentum data. Pick the one that matches your trading style. RSI for range-bound entries, MACD for trend-following.
Check for divergence — price making a new high while RSI makes a lower high is the strongest momentum warning signal available.
⚠️ Limitation: Momentum indicators produce the most false signals during strong trends. RSI can remain above 70 for weeks in a bull run — a phenomenon called embedded RSI. Always check the trend layer first. If the trend is strong, don't short just because RSI says "overbought."
Layer 3: Confirmation — "Is There Real Money Behind This?"
The confirmation layer validates that real capital supports the move. This is where most traders fail — they check trend and momentum but skip volume, then wonder why their breakout trades get faded.
Recommended indicators:
Indicator
What It Confirms
How to Read
Volume (relative)
Whether current bar's volume exceeds average
Volume > 1.5× 20-period average = strong conviction
OBV
Whether cumulative volume supports the price trend
OBV trending up with price = confirmed; OBV flat while price rises = warning
MFI
Volume-weighted momentum
MFI > 50 and rising = money flowing in; MFI < 50 and falling = money flowing out
The 3-layer check:
✅ Trend says bullish (price above 50 EMA, EMA above 200 EMA)
✅ Volume confirms (OBV making new highs, volume > 1.5× average)
Result: High-probability long entry. CoinXSight Confluence Score: 7-9 out of 10.
5 High-Probability Confluence Setups
These are specific, repeatable patterns that combine all three layers. Each setup includes the entry trigger, required confirmations, and a real example from 2026.
Setup 1: The EMA + RSI + Volume Bounce
What it is: Price pulls back to the 50 EMA in an uptrend, RSI hits the 40-50 zone (not oversold, just cooling off), and volume dries up on the pullback then spikes on the bounce candle.
Entry trigger: First green candle that closes above the 50 EMA after the pullback, with volume > 1.5× average.
Stop loss: Below the pullback low or 1.5× ATR below entry.
Take profit: Previous swing high or 2× ATR above entry.
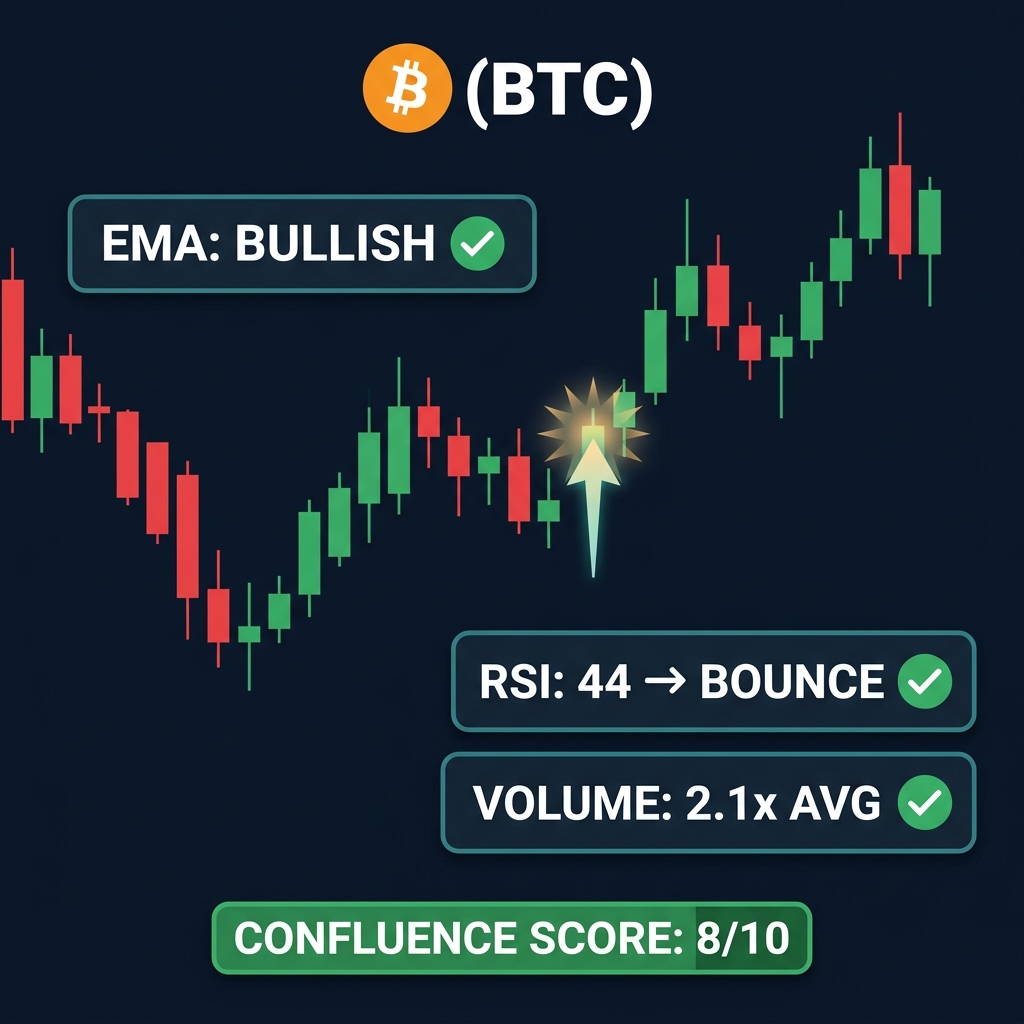
Example — BTC EMA Bounce on CoinXSight Chart Pro (May 22, 2026)
BTC was trading at $73,400 after a 3-week uptrend. Price pulled back to $71,200 — sitting right on the 50 EMA on the 4H chart. RSI cooled from 68 to 44. Volume dropped 40% during the pullback. On May 22, a bullish engulfing candle formed at the 50 EMA with volume spiking to 2.1× the 20-period average. The CoinXSight Confluence Score read 8/10. BTC bounced to $74,800 over the next 72 hours — a 5% move from the entry.
Setup 2: The MACD + OBV Divergence Reversal
What it is: Price makes a new high (or low), but MACD histogram is shrinking AND OBV fails to confirm the new price extreme. This triple divergence — price vs. MACD vs. OBV — is one of the strongest reversal signals in crypto.
Entry trigger: First candle that closes in the divergence direction after the MACD crossover completes.
Setup 3: The Bollinger Squeeze + RSI + Volume Breakout
What it is: Bollinger Bands contract to their narrowest width in 20+ periods (the "squeeze"), RSI is between 45-55 (neutral momentum coiled), and volume is below average. When price breaks out of the squeeze, you enter in the breakout direction IF RSI confirms (moves above 55 for longs, below 45 for shorts) AND volume spikes.
Setup 4: The Triple Timeframe Confluence
What it is: The same directional signal appears across three timeframes — daily, 4H, and 1H. The daily establishes the trend, the 4H confirms momentum alignment, and the 1H provides the precision entry.
What it is: A Smart Money Concepts setup — such as price sweeping liquidity below a key level and then entering a fair value gap — combined with indicator confluence. The SMC structure provides the trade thesis; the indicators provide the timing and confirmation.
Entry trigger: Price sweeps a liquidity pool, enters a fair value gap, and simultaneously shows RSI divergence + volume spike.
Example — ETH False Signal vs. Confluence Save (June 3, 2026)
ETH was trading at $2,480. RSI on the 4H chart crossed above 70, which in isolation suggests "overbought — consider selling." A trader using RSI alone would have shorted.
But the confluence check told a different story:
Trend (50 EMA): Price was well above the 50 EMA, which was sloping upward. Trend = bullish.
MACD: Histogram was expanding green bars. Momentum = accelerating, not exhausted.
Volume (OBV): OBV was making new highs alongside price. Volume = confirming.
The single RSI "overbought" signal was an embedded RSI scenario in a strong uptrend. ETH continued to $2,640 over the next five days — a 6.4% move. The RSI-only trader would have been stopped out for a loss. The confluence trader stayed long.
How AI Changes Confluence in 2026
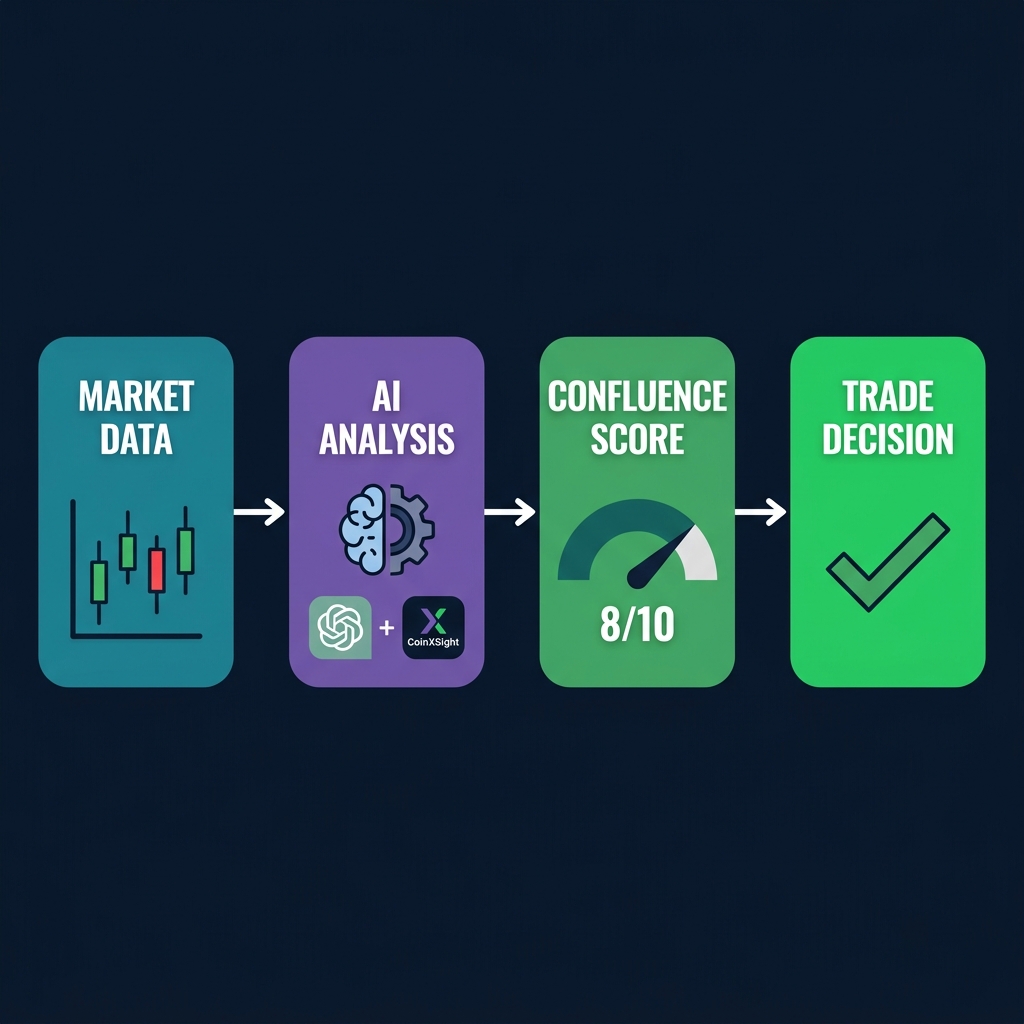
AI tools in 2026 don't replace confluence analysis — they accelerate it. Instead of manually checking six indicators across three timeframes, traders now use AI assistants to scan, score, and summarize confluence readings in seconds.
Using ChatGPT or Gemini for Multi-Indicator Analysis
Here's a prompt template that works in ChatGPT or Google Gemini (June 2026):
Prompt:
"I'm analyzing [TOKEN] on the [TIMEFRAME] chart. Current data:
- Price: $[PRICE]
- 50 EMA: $[VALUE] | 200 EMA: $[VALUE]
- RSI (14): [VALUE]
- MACD: Line [VALUE], Signal [VALUE], Histogram [VALUE]
- Volume: [VALUE] vs 20-period average [VALUE]
- OBV trend: [rising/falling/flat]

Based on this data:
1. Score the trend layer (bullish/neutral/bearish)
2. Score the momentum layer
3. Score the volume confirmation layer
4. Give me an overall confluence assessment (0-10)
5. Identify any divergences or conflicting signals"
What this does: It forces the AI to evaluate each layer independently before combining them — the same process CoinXSight's algorithm runs automatically.
What it can't do: AI chatbots don't have real-time market data unless you feed it in. They also can't backtest the specific combination against historical performance. That's where purpose-built analytics platforms fill the gap.
CoinXSight AI Auto-Scoring
CoinXSight's Chart Pro module takes this further with live auto-scoring:
Real-time data feeds — no manual input needed. The system pulls current indicator readings automatically.
12-layer analysis — goes beyond the 3-layer framework to include SMC structures, on-chain data, funding rates, and volatility metrics.
Historical calibration — each indicator's weight is calibrated against actual crypto market backtests, not generic settings borrowed from equities.
Alert triggers — set confluence score thresholds (e.g., "alert me when BTC Confluence Score hits 8+") and receive notifications.
💡 CoinXSight's AI doesn't just tell you "RSI is 35." It tells you "RSI is 35, which historically preceded a 3-5% bounce within 48 hours when the trend layer is bullish and volume is confirming — Confluence Score: 7/10."
The difference between using ChatGPT for confluence analysis and using a dedicated crypto analytics platform is the difference between asking a smart friend for directions and using GPS with live traffic data. Both can get you there. One is faster and more reliable.
CoinXSight's 12-Layer Confluence Scoring System
The 3-layer framework works well for manual trading. CoinXSight expands it to 12 layers for comprehensive coverage.
The 12 Layers
#
Layer
Category
What It Checks
Weight
1
EMA Ribbon
Trend
20/50/100/200 EMA alignment and slope
3
2
Supertrend
Trend
Bullish/bearish flip state
2
3
RSI
Momentum
Level + divergence from price
2
4
MACD
Momentum
Crossover state + histogram direction
2
5
Stochastic RSI
Momentum
Fast overbought/oversold with K/D cross
1.5
6
MFI
Volume
Money flow direction and strength
1.5
7
Volume Ratio
Volume
Current vs. average volume comparison
1.5
8
Bollinger Bands
Volatility
Band width + price position within bands
1.5
9
Order Blocks
SMC
Proximity to institutional order zones
1
10
Fair Value Gaps
SMC
Whether price is filling or rejecting FVGs
1
11
Liquidity Sweeps
SMC
Recent sweep of key liquidity pools
1
12
ATR Trend
Volatility
Whether volatility is expanding or contracting
1
How to Read the Score
Score
Meaning
Suggested Action
8-10
Strong confluence — most layers agree
High-conviction entry. Tight stop.
6-7
Moderate confluence — majority of layers agree
Valid setup, but use wider stop or smaller position
Search for any token (BTC, ETH, SOL, or 500+ others)
Check the Confluence Score panel on the right sidebar → view the overall score and per-layer breakdown
Click any individual layer to see the raw indicator reading and its historical accuracy for that token
Set Confluence Alerts to get notified when any token crosses your target score threshold
💡 The Confluence Score updates in real time. If you're watching BTC and the score jumps from 5 to 8 within an hour, that's multiple indicators flipping bullish simultaneously — a stronger signal than a gradual climb from 5 to 6 to 7 to 8 over several days.
Common Indicator Confluence Mistakes
Confluence is powerful, but it can be misused. These are the mistakes that undermine even well-structured multi-indicator systems.
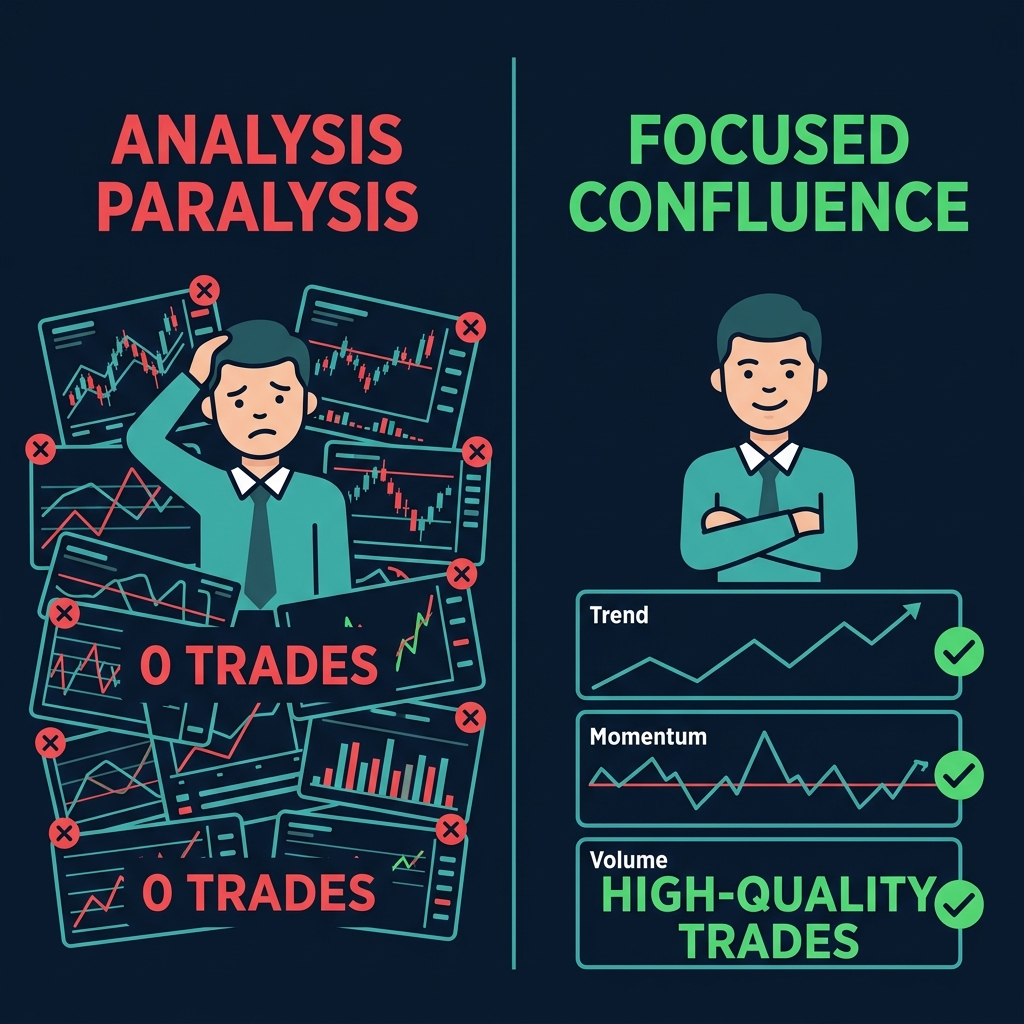
Mistake 1: Over-Confluence (Analysis Paralysis)
Adding more indicators doesn't always improve accuracy. Research shows diminishing returns beyond 4-5 indicators. At 8+ indicators, you'll almost never get full agreement — so you never trade.
The fix: Cap your system at 3-4 indicators from different categories. If you want more data points, use CoinXSight's automated 12-layer score instead of tracking 12 charts manually.
Mistake 2: Using Correlated Indicators
RSI + Stochastic RSI + CCI = three momentum oscillators measuring the same underlying price momentum. When they agree, you have one signal disguised as three. When they disagree, you're confused for no reason.
The fix: One indicator per category. Trend + Momentum + Volume is the minimum viable confluence stack. Our indicator combinations guide explains which indicators are correlated and which provide independent data.
Mistake 3: Ignoring Timeframe Alignment
Confluence on the 15-minute chart means nothing if the daily chart shows a strong downtrend. Lower-timeframe confluence without higher-timeframe alignment is a recipe for getting stopped out by the bigger trend.
The fix: Always check the higher timeframe first. Daily trend → 4H momentum → 1H entry. If the daily disagrees, skip the trade regardless of what the lower timeframes show.
Mistake 4: Waiting for "Perfect" 10/10 Confluence
A 10/10 score happens once or twice per month on any given asset. If you only trade perfect setups, you'll miss 95% of profitable opportunities. A 7/10 with proper risk management is a solid trade.
The fix: Define your minimum score threshold — most active traders use 6/10 or 7/10 — and accept that no setup is risk-free. Manage risk with position sizing, not with the search for perfection.
Mistake 5: Ignoring the Macro Context
All indicator confluence analysis happens on a chart. But crypto markets in 2026 are driven by macro forces — Fed rate decisions, ETF flow data, geopolitical events, and regulatory announcements. A perfect 9/10 technical setup can get steamrolled by a surprise CPI print.
The fix: Check the economic calendar before entering any trade. If a high-impact event is within 24 hours, either skip the trade or reduce position size by 50%.
FAQ
What is indicator confluence in crypto trading?
Indicator confluence is when two or more independent technical indicators — from different categories like trend, momentum, and volume — generate the same buy or sell signal simultaneously. It improves accuracy from roughly 52% (single indicator) to 70%+ (3-layer confluence).
How many indicators should I use for confluence?
Three to four indicators from different categories produces the best results. More than five hits diminishing returns and creates analysis paralysis. The key is category diversity: one trend, one momentum, one volume indicator at minimum. CoinXSight automates this with a 12-layer system.
What is the best indicator combination for crypto?
A proven combination is EMA (trend) + RSI (momentum) + OBV (volume confirmation). This covers three independent market dimensions with minimal redundancy. For traders wanting a fourth layer, adding Bollinger Bands for volatility context rounds out the stack.
Does CoinXSight calculate confluence automatically?
Yes. CoinXSight's Chart Pro module computes a real-time Confluence Score from 0–10 across 12 indicator layers for 500+ tokens. Each layer is weighted based on backtested accuracy in crypto markets. You can view per-layer breakdowns and set alert thresholds.
Why does RSI alone fail in crypto markets?
RSI measures momentum on a 0–100 scale, but it doesn't account for trend direction or volume. In strong uptrends, RSI can stay "overbought" above 70 for weeks while price continues rising — called embedded RSI. Without trend and volume confirmation, RSI generates roughly 48% false signals in crypto's volatile, 24/7 markets.
Start Building Your Confluence System
Single indicators are data points. Confluence is evidence. The difference between a trader who checks RSI and a trader who checks RSI within the context of trend, volume, and volatility is the difference between guessing and analyzing.
Build your 3-layer stack. Backtest it. Or skip the setup process entirely and let CoinXSight's Chart Pro module score confluence across 12 layers in real time — for any token, on any timeframe. Try the crypto trading platform that does the math for you.
Disclaimer: This article is for educational and informational purposes only and does not constitute financial, investment, or trading advice. Cryptocurrency markets are highly volatile and involve substantial risk of loss. No trading strategy guarantees profits. Paper-trade or demo-trade before risking real capital. Always conduct your own research (DYOR) and consult a licensed financial advisor before making any investment decisions. Past performance does not guarantee future results. CoinXSight provides analytical tools and data — not investment recommendations. Mention of specific tokens does not constitute a buy or sell recommendation.
Master every cryptocurrency technical analysis indicator with this complete guide. Covers 27 indicators across trend, momentum, volume, volatility, and crypto-native…