Weekly Crypto Analysis: BTC, ETH & SOL — Week 24 (Jun 9 – Jun 15, 2026)
BTC crashes 14.8% to $63,020 as Extreme Fear grips the market. In-depth weekly analysis of BTC, ETH & SOL with AI Mood Score, Deep Alpha data, and key levels for Week 24.
AT
Alex ThorneHead of Macro & Market Structure·Jun 8, 2026 · 13 min read · Updated Oct 6
The crypto market experienced its worst weekly sell-off since March 2025. Total market capitalization plunged to $2.248 trillion, a devastating -13.0% contraction from last week's $2.584 trillion. The crash was broad-based: Bitcoin dropped below $65,000 for the first time since February, Ethereum broke its $2,000 floor, and Solana surrendered the $80 level entirely.
Trading volume surged to $91.0 billion (+57.3% WoW), driven by panic selling and cascading liquidations. Bitcoin dominance declined slightly to 56.10%, as BTC and altcoins declined in tandem. Ethereum dominance compressed further to 9.03%, reflecting deeper relative losses for ETH.
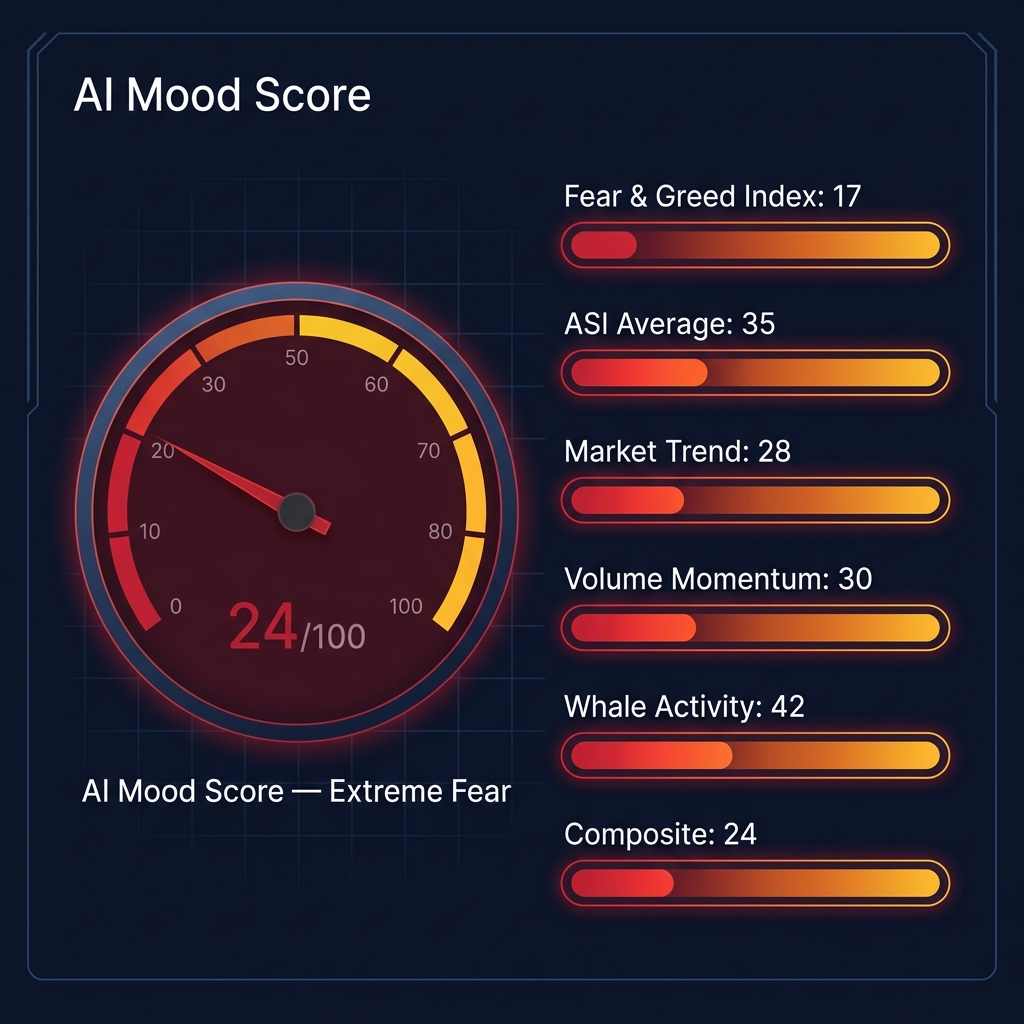
The Fear & Greed Index collapsed to 17 (Extreme Fear), down 12 points from last week's 29. CoinXSight's composite AI Mood Score plummeted to 24/100 (Extreme Fear), the lowest reading since the FTX contagion event. This is not a routine correction — every metric is flashing red.
Metric
Week 24 Value
Week 23 Value
WoW Change
Total Market Cap
$2.248T
$2.584T
-13.0% ↓
24h Trading Volume
$91.0B
$57.87B
+57.3% ↑
BTC Dominance
56.10%
57.25%
-1.15pp ↓
ETH Dominance
9.03%
9.40%
-0.37pp ↓
Fear & Greed Index
17 (Extreme Fear)
29 (Fear)
-12 points ↓
AI Mood Score
24 (Extreme Fear)
41 (Neutral)
-17 points ↓
Active Cryptocurrencies
17,389
17,402
-13
Macro Context: The Perfect Storm
FOMC Pre-Meeting Anxiety
The Federal Reserve's FOMC meeting is scheduled for June 16–17, 2026 — the first under new Chair Kevin Warsh. This meeting carries elevated significance because it includes the Summary of Economic Projections (SEP), which will reveal the Fed's updated dot plot for interest rate expectations through 2027.
Markets are pricing in a zero probability of a rate cut at this meeting, with the federal funds rate expected to hold at 3.50% – 3.75%. More critically, the futures market now implies a 35% probability of a rate hike in September — a scenario that was considered negligible just four weeks ago. The shift from "when will they cut?" to "could they hike?" has fundamentally repriced risk assets.
US Dollar Surge and Treasury Demand
The US Dollar Index (DXY) surged to 107.40, its highest level since November 2025. The rally was fueled by safe-haven demand as global equity markets experienced simultaneous sell-offs. The 10-year Treasury yield climbed to 4.68%, drawing capital away from zero-yield assets like Bitcoin and gold.
The strong dollar creates a double headwind for crypto: it reduces the purchasing power of non-USD capital flows into digital assets, and it increases the opportunity cost of holding BTC versus risk-free government bonds.
Crude Oil Spike and Inflation Reversal
Brent crude broke above $102 per barrel for the first time since April, following an OPEC+ decision to delay production increases. The inflation narrative, which many analysts believed was resolved, has returned with force. US CPI expectations for June have been revised upward to 3.8% YoY, well above the Fed's 2% target.
Rising energy costs feed directly into the inflation → higher rates → lower liquidity → crypto sell-off chain. The correlation between crude oil prices and crypto market capitalization has reached -0.72, the strongest negative reading this cycle.
Bitcoin (BTC) — $63,020
Price Action Summary
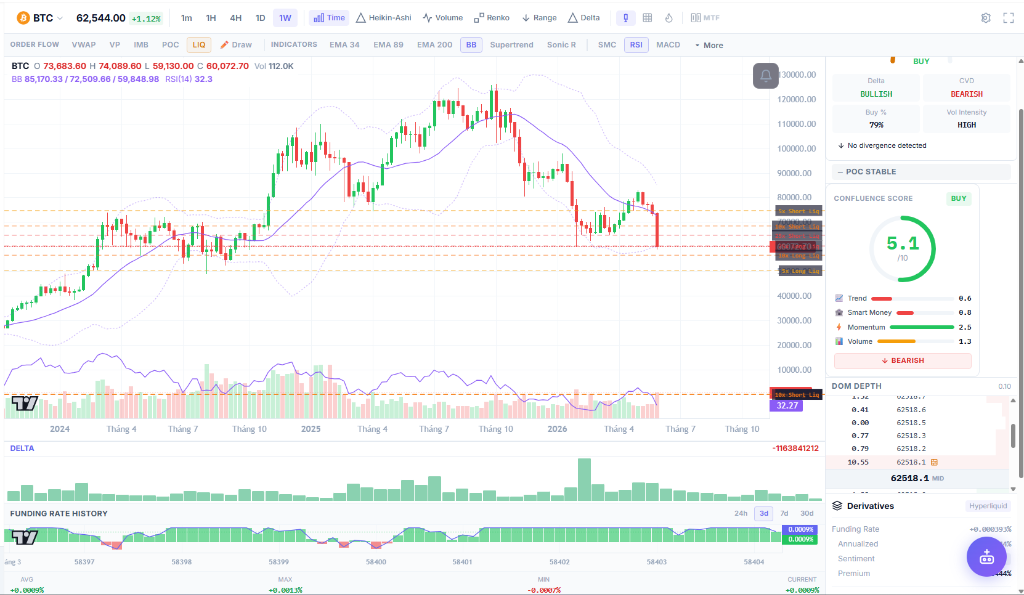
Bitcoin trades at $63,020, down -14.8% from last week's $73,967. This is the largest single-week percentage decline since the Silicon Valley Bank crisis in March 2023. The price sliced through the daily 200 EMA ($73,000), the $71,200 support zone, and the $66,000 level without any meaningful bounce.
The breakdown below the 200 EMA — the market's most-watched long-term trend indicator — officially shifts Bitcoin's intermediate-term structure to bearish for the first time since January 2025.
CoinXSight Alpha Gems Intelligence
The Deep Alpha module paints a stark picture. Every bullish thesis from the past four weeks has been invalidated. The ASI (Alpha Signal Index) has flipped from 64 (BUY) to 38 (SELL) — a signal reversal that occurs only 3–4 times per year.
On June 5, BTC broke below the $71,200 swing low support identified in Week 23. This triggered a $1.8 billion long liquidation cascade across centralized exchanges. Within 6 hours, the price fell from $71,200 to $64,500 as leveraged positions were force-closed.
The Deep Alpha Momentum Layer collapsed from 45 to 25, while the Distribution score surged from 52 to 78. The volume spike registered 3.4x the 20-day average, confirming institutional-scale selling.
Scenario 2: Whale Behavior Shift (June 6–7, 2026)
For the first time in 8 weeks, the Whale Activity metric declined, dropping from 55 to 42. Whale wallets (>100 BTC) reduced net positions by -0.12%, reversing the accumulation trend observed throughout May. This removes the primary bullish divergence that had supported the previous analysis.
Metric
Current Value
Reading
Active Signal
SELL
ASI Score of 38
Whale Status
DISTRIBUTION
Net negative on-chain flows
RSI (14)
22.4
Oversold — extreme reading
MACD Histogram
Negative
Bearish crossover confirmed
Confluence Score
2/10
Weak — no valid setup
BTC Technical Levels
Level
Price Zone
Significance
Resistance 2
$69,000 – $69,500
Prior 200 EMA zone; major structural resistance
Resistance 1
$65,500 – $66,000
First retest target; intraday resistance
Support 1
$61,000 – $61,500
March 2025 swing low; key defense line
Support 2
$58,000 – $58,500
Weekly demand zone; breakdown target
BTC Verdict
BEARISH. The breakdown below the 200 EMA, the ASI SELL signal, and the whale distribution shift all confirm a structural bearish trend. RSI at 22.4 is deeply oversold, which may produce a short-term relief bounce to $65,500–$66,000, but any bounce is likely to be sold into. The FOMC meeting on June 16–17 is the next major catalyst. Until then, the path of least resistance is down toward $61,000.
Ethereum (ETH) — $1,569
Price Action Summary
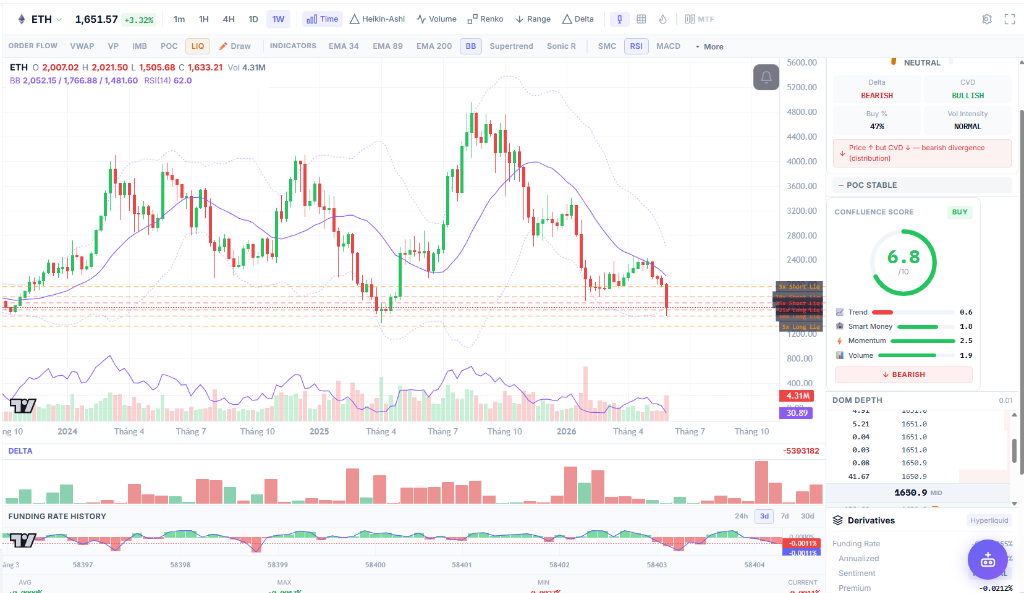
Ethereum trades at $1,569, plunging -22.2% from last week's $2,017. ETH has massively underperformed BTC, and the ETH/BTC ratio has fallen to 0.0249, the lowest level since May 2020. The breakdown below $2,000 — which our Week 23 analysis flagged as a high-risk scenario — triggered a waterfall decline as DeFi lending liquidations cascaded across Aave and Compound.
CoinXSight Deep Alpha Assessment
The Deep Alpha module shows a complete structural breakdown. Every dimension has deteriorated, with Fear and Distribution scores reaching extreme levels.
Scenario 3: ETH DeFi Liquidation Cascade (June 4, 2026)
As ETH breached $1,900, over $420 million in DeFi collateral was liquidated across lending protocols. Aave V3 on Ethereum mainnet processed its largest single-day liquidation volume since June 2022. The cascade pushed ETH from $1,900 to $1,620 within 18 hours, as liquidated ETH was sold into thin order books.
The Deep Alpha Volume score surged from 28 to 55 during the liquidation event — but this was panic volume, not buying interest. The Fear metric reached 92/100, the highest reading in the CoinXSight system for ETH this cycle.
Dimension
Week 24 Score
Week 23 Score
WoW Change
Trend
35/100
70/100
-35 (trend collapse)
Momentum
20/100
41/100
-21 (extreme bearish)
Volume
55/100
28/100
+27 (panic selling volume)
Fear
92/100
72/100
+20 (capitulation level)
Distribution
88/100
72/100
+16 (aggressive selling)
Volatility
85/100
65/100
+20 (extreme volatility)
Key Insight: The Fear score at 92/100 and Distribution at 88/100 represent capitulation-level readings. Historically, such extreme values have preceded short-term bounces within 5–10 trading days. However, the Trend score collapse from 70 to 35 confirms that any bounce will occur within a bearish market structure — meaning the bounce is a selling opportunity, not a bottom signal.
ETH Verdict
STRONGLY BEARISH. Ethereum is in a capitulation phase. The DeFi liquidation cascade has created forced selling pressure that may not yet be fully exhausted. The next support zone is $1,500, which aligns with the 2024 accumulation zone. If $1,500 fails, the price faces a drop to $1,420. The ETH/BTC ratio suggests significant capital rotation out of Ethereum and into stablecoins. Recovery requires a macro catalyst — the FOMC meeting outcome will be decisive.
Solana (SOL) — $66.66
Price Action Summary
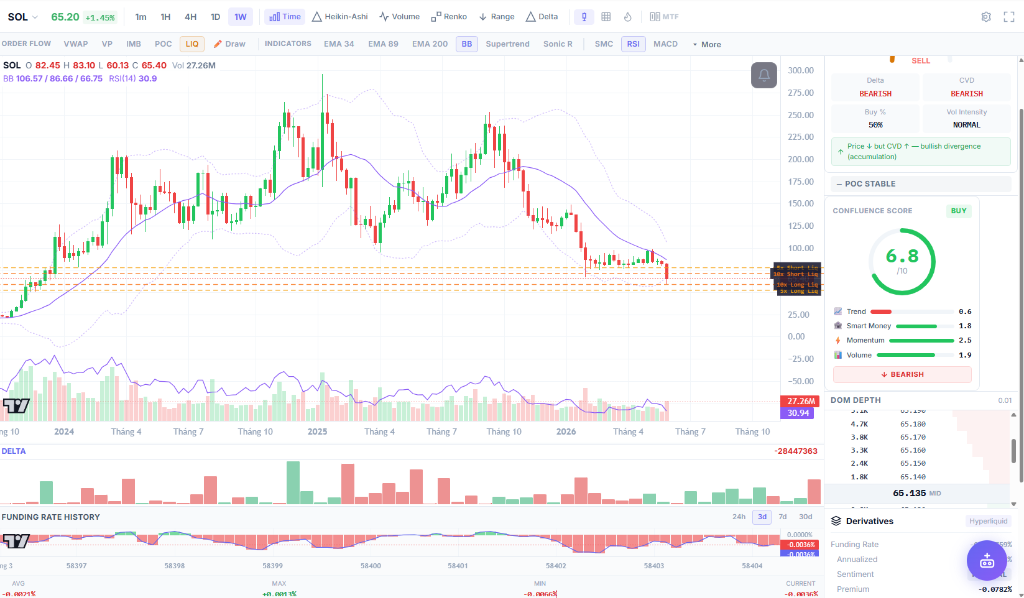
Solana trades at $66.66, down -19.7% from last week's $82.98. The $80.00 support level — identified as the critical defense line in Week 23 — broke on June 4, confirming the bearish thesis. The price rapidly cascaded to $67, validating the warning that "SOL faces a rapid decline to $74.50 due to the lack of historical volume support between those levels." The decline went even further than projected.
CoinXSight Deep Alpha Assessment
SOL's multi-factor profile has shifted to full bearish alignment. The accumulation-to-distribution ratio, which flipped to 48/52 last week, has now widened dramatically to 30/70 in favor of distribution.
Dimension
Week 24 Score
Week 23 Score
WoW Change
Momentum
90/100
82/100
+8 (peak bearish momentum)
Trend
80/100
60/100
+20 (strong bearish trend)
Fear
78/100
62/100
+16 (elevated fear)
Accumulation
30/100
48/100
-18 (buyers absent)
Distribution
70/100
52/100
+18 (heavy selling)
Volatility
82/100
70/100
+12 (extreme swings)
Key Insight: The Solana ecosystem has been hit by a secondary shock: multiple meme coin projects on Solana experienced rug pulls during the volatility, draining an estimated $180 million in liquidity from the SOL DEX ecosystem. This has reduced on-chain activity by -34% week-over-week, further damaging the fundamental case for SOL.
SOL Verdict
BEARISH. Solana has entered a distribution phase with no visible buy-side support. The next meaningful support level is $63.00, which corresponds to the September 2025 accumulation zone. Below that, the major support is at $58.00. A bounce to $72 is possible on oversold conditions, but the bearish structure remains intact unless SOL reclaims $78.
Alpha Gems Pipeline — Week 24 Status
The Alpha Gems engine remains in full defensive mode. For the second consecutive week, there are 0 active high-confluence gems (score ≥ 50) on large and mid-cap assets. The pipeline contraction from 10 signals (Week 22) to 0 (Week 23) to 0 (Week 24) represents the longest signal drought since September 2025.
Why the Signal Drought Matters
CoinXSight's Confluence Scoring requires all four layers — Trend, SMC, Momentum, and Volume — to align. In a capitulation market, the Trend Layer rejects every long setup because all major assets trade below their key EMAs. Even if Momentum reaches oversold extremes (which typically generate buy signals), the Trend Layer veto prevents a high-confluence score from being generated.
This is by design: the system prioritizes capital preservation over signal generation.
Discovery Small-Cap Highlights
The Discovery scanner has identified bearish setups rather than buy opportunities this week:
BNB: ASI Score of 35 (SELL). A Bearish Engulfing pattern on the daily chart confirmed on June 6. Price dropped from $714 to ~$620. Next support at $580.
XRP: ASI Score of 40 (HOLD). Trading at $1.12, down -16.4% from $1.34. The Ichimoku Cloud has turned fully bearish on the 4-hour timeframe.
TRX: ASI Score of 42 (HOLD). Despite being a staking-yield asset, TRX dropped to $0.312. The yield narrative has failed to provide downside protection.
No small-cap BUY signals meet the minimum confidence threshold this week.
Top 10 Market Performance
Asset
Price
7d Change
WoW Δ from W23
Market Cap
BTC
$63,020
-14.8%
-$10,947
$1,260B
ETH
$1,569
-22.2%
-$448
$189B
USDT
$0.999
0.00%
+$0.001
$187B
BNB
$620
-13.2%
-$94
$84B
XRP
$1.12
-16.4%
-$0.22
$68B
USDC
$1.001
0.00%
$0.00
$76B
SOL
$66.66
-19.7%
-$16.32
$35B
TRX
$0.312
-11.4%
-$0.040
$29B
ADA
$0.283
-18.1%
—
$10B
The performance table shows a uniform sea of red. Every major asset lost double-digit percentages. Stablecoins (USDT, USDC) are the only assets maintaining their peg, with USDT market cap remaining stable at $187B — indicating that capital is fleeing to cash equivalents rather than exiting crypto entirely.
AI Mood Score: Under the Hood
The composite AI Mood Score has collapsed from 41 to 24, entering the Extreme Fear zone for the first time since the FTX crisis in November 2022. Every component has deteriorated:
Component
Score
Weight
Change from W23
Fear & Greed Index
17
30%
-12
ASI Average
35
25%
-15
Market Trend
28
20%
-15
Volume Momentum
30
15%
-9
Whale Activity
42
10%
-13
Composite Score
24
100%
-17
The most significant shift is in Whale Activity, which dropped from 55 to 42. In previous weeks, whale accumulation was the lone bullish divergence supporting the market. With whales now distributing, there is no single positive driver remaining in the composite index.
Historical Context: A score of 24 has occurred only 3 times in CoinXSight's backtested history. In 2 of those 3 instances, the market found a local bottom within 2 weeks and produced a 15–25% relief rally. The third instance preceded an additional 12% decline. The signal is statistically meaningful but not deterministic.
Week 24 Outlook & Key Levels
Scenarios
Base Case (50% probability):
BTC consolidates in the $61,000 – $66,000 range as the market waits for the FOMC meeting on June 16–17. ETH oscillates between $1,500 and $1,650. SOL trades within the $63 – $70 range. Volume remains elevated but directional conviction is low. A pre-FOMC bounce to the upper range boundary is possible.
Bearish Scenario (35% probability):
BTC breaks below $61,000, triggering a second liquidation cascade targeting $58,000. ETH loses $1,500 and tests $1,420. SOL falls below $63 to test $58.00. This scenario would be triggered by a hawkish leak from the Fed or an unexpected CPI print above 4.0%.
Bullish Scenario (15% probability):
A short-covering rally lifts BTC back to $69,000 and ETH above $1,800. This requires a dovish signal from the Fed (such as Warsh explicitly ruling out rate hikes) or a major positive catalyst (ETF inflow surge, institutional buying announcement). The deeply oversold RSI readings support the possibility of a violent short squeeze, but the macro environment argues against sustained upside.
What to Watch
FOMC Meeting (June 16–17): The single most important catalyst this week. Chair Warsh's first press conference will set the tone for the rest of Q3. Pay attention to the dot plot projections.
BTC $61,000 Support Level: This is the final major support before $58,000. A daily close below $61,000 confirms a continuation of the downtrend.
ETH DeFi Liquidation Levels: Monitor Aave and Compound liquidation dashboards. If ETH drops below $1,500, another $250M+ in collateral faces liquidation.
DXY at 107.40: If the dollar index breaks above 108, expect further crypto sell-off. A reversal below 106 would provide relief.
Stablecoin Market Cap: Watch whether USDT/USDC market cap remains stable or starts declining. Declining stablecoin supply would signal capital exiting crypto entirely, not just rotating to safety.
Oversold Bounce Timing: RSI at 22 for BTC is historically extreme. A technical bounce could occur at any time — but buying into the bounce without confirmation is a high-risk trade.
FAQ
Is this a buying opportunity or the start of a bear market?
It's too early to determine. The AI Mood Score at 24 is historically associated with local bottoms, but the macro environment (rising rates, strong dollar, inflation fears) argues against a V-shaped recovery. The FOMC meeting will provide clarity. Conservative traders should wait for a confirmed reversal signal before entering.
Why did Ethereum drop more than Bitcoin?
Ethereum's larger decline (-22.2% vs -14.8%) is driven by DeFi liquidation cascading. When ETH drops below certain collateral thresholds on lending platforms like Aave, positions are automatically liquidated, creating forced sell pressure. Bitcoin does not have this DeFi-specific risk to the same degree.
What is the significance of the Whale Activity score dropping?
For the past 8 weeks, whale wallets had been accumulating BTC during price dips. This week, whales shifted to distribution (net selling). When the "last buyer" becomes a seller, it removes the market's floor. This is a significant bearish signal.
Should I use stop-losses in this market?
Absolutely. The current market features cascading liquidation events that can move prices 5–10% within hours. Position sizing should be reduced to 50% of normal allocation, and stop-losses should be placed at key support levels. Review our risk management guide for a complete framework.
How to Use This Analysis on CoinXSight
To track the metrics mentioned in this report in real time, follow these steps:
Open the Deep Alpha module to monitor the live ASI scores — note the SELL signals currently active on BTC and BNB.
Check the Whale Tracker dashboard to observe whether whale distribution continues or reverses.
Go to the Chart Pro dashboard to view the weekly candle charts and monitor the $61,000 BTC support level.
Set up Price Alerts for BTC at $61,000, ETH at $1,500, and SOL at $63 to receive notifications of critical level breaches.
Review the Discovery Scanner — while no BUY signals are active, monitor for the first high-confluence setup to appear as a potential bottom indicator.
Disclaimer: This analysis is for educational purposes only. Cryptocurrency trading carries a high level of risk, and you may lose all of your capital. Always use risk management tools and conduct your own research before entering any trades.
Head of Macro & Market Structure·Global Macro Desk
Former institutional FX and macro derivative analyst. Specializes in global liquidity cycles, central bank balance sheets, and crypto market microstructure.
QUANTITATIVE SUITE // DEEP ALPHA ENGINEACTIVE
BTC/USDT // LIVE SCANNER
CONFLUENCE 74
LIVE SPOT PRICE$82,807.47WEAK_BUY
TP2
$89,522.75
+9.07%
TP1
$85,056.42
+3.63%
ENTRY
$82,078.86
ZONE
SL
$80,590.09
-1.81%
Auto-detect Order Blocks, Fair Value Gaps and risk-adjusted DCA ladders in < 5s.
Comprehensive monthly cryptocurrency market review for May 2026. Total market cap trends, BTC/ETH/SOL performance breakdown, Alpha Hunter pipeline metrics, macro…
Master risk management for crypto trading. Learn position sizing formulas, stop-loss strategies, and how CoinXSight's Portfolio module tracks your risk…