Why Crypto Price Prediction Depends on Market Cycle Analysis
Accurate crypto price prediction starts with understanding where you are in the market cycle. Most traders obsess over the perfect entry — the right indicator, the right pattern, the right moment. But the single most impactful factor in making any bitcoin price prediction or altcoin forecast is knowing which phase of the crypto market cycle you're in.
A brilliant long strategy in a bull market becomes a capital destroyer in a bear market. The same EMA crossover that produced 12 consecutive winners in an uptrend will generate 8 consecutive losers in a downtrend. The strategy didn't change — the market cycle did. That's why learning to predict crypto prices requires studying cycle dynamics, not just technical analysis patterns. AI price prediction tools like CoinXSight's regime detection, combined with frameworks like Elliott Wave theory, dramatically improve forecasting accuracy.
Understanding cycles allows you to:
Adapt your strategy to current conditions (not yesterday's conditions)
Size positions appropriately (aggressive in markup, defensive in distribution)
Recognize transitions before they become obvious to the crowd
Stay in cash when conditions don't favor any directional strategy
The 4 Phases of Every Crypto Market Cycle
Every asset, in every market, moves through four phases in a repeating cycle. In crypto, these phases are compressed — what takes years in equities can happen in months or even weeks.
Phase 1: Accumulation (Smart Money Buys)
Characteristics:
Price has bottomed after a significant decline
Volume is low — retail traders have given up
Social media sentiment is extremely negative ("crypto is dead")
Exchange outflows begin increasing (smart money withdrawing to hold)
What the AI Terminal shows:
Market regime reads SIDEWAYS with occasional bearish dips. ASI scores for major tokens stabilize in the 40-55 range — no longer collapsing but not yet bullish. The Pre-Trade Checklist score hovers around 45-55 (WAIT).
Your strategy: Begin building small positions in tokens showing smart money accumulation. Use 50% of normal position sizes. Set wide stop-losses — accumulation phases are choppy and will shake out impatient traders.
Phase 2: Markup (The Bull Run)
Characteristics:
Price breaks above key resistance with increasing volume
Social media turns euphoric — "to the moon" posts dominate
MACD shows sustained bullish momentum on higher timeframes
Exchange outflows accelerate — everyone is buying and holding
What the AI Terminal shows:
Market regime reads BULLISH with 75-90% confidence. ASI scores for BTC/ETH climb to 70-90. Pre-Trade Checklist scores reach 75+. Alpha Hunter produces abundant buy signals with high ASI scores.
Your strategy: This is the time for trend-following strategies. Use EMA pullback entries (buy dips to EMA 34 in an uptrend). Use full position sizes. Trail stops with EMA 89. Let winners run — don't take profit too early in a bull trend.
Phase 3: Distribution (Smart Money Sells)
Characteristics:
Price makes a final euphoric spike (the "blow-off top")
Volume peaks and then declines while price stays elevated
New retail accounts surge — the "shoe shine boy" indicator
What the AI Terminal shows:
Market regime oscillates between BULLISH and SIDEWAYS. ASI scores show divergence — the 1D score drops while 1H scores remain high (short-term bullish, long-term weakening). Pre-Trade Checklist shows mixed readings — some checks pass, others fail.
Your strategy: Begin reducing exposure. Take partial profits on existing positions. Tighten stop-losses to protect gains. Do not open new long positions with full size. Watch for the first lower high on the daily chart — that's the confirmation that distribution has begun.
RSI stays depressed (20-45 range) with bounces failing at 50
Exchange inflows remain elevated — late sellers capitulating
Social media turns to "I told you so" and blame narratives
What the AI Terminal shows:
Market regime reads BEARISH with 70-90% confidence. ASI scores for most tokens fall below 40. Pre-Trade Checklist scores drop below 40. Alpha Hunter produces sell signals and very few buy signals.
Your strategy: Cash is king. If you trade shorts, use small position sizes with tight targets. For long-term investors, begin accumulation watchlists — the best buying opportunities of the next cycle are approaching. Monitor whale outflows for signs that smart money is beginning Phase 1 accumulation again.
Reading the Current Market Cycle on CoinXSight
AI Terminal: The Cycle Dashboard
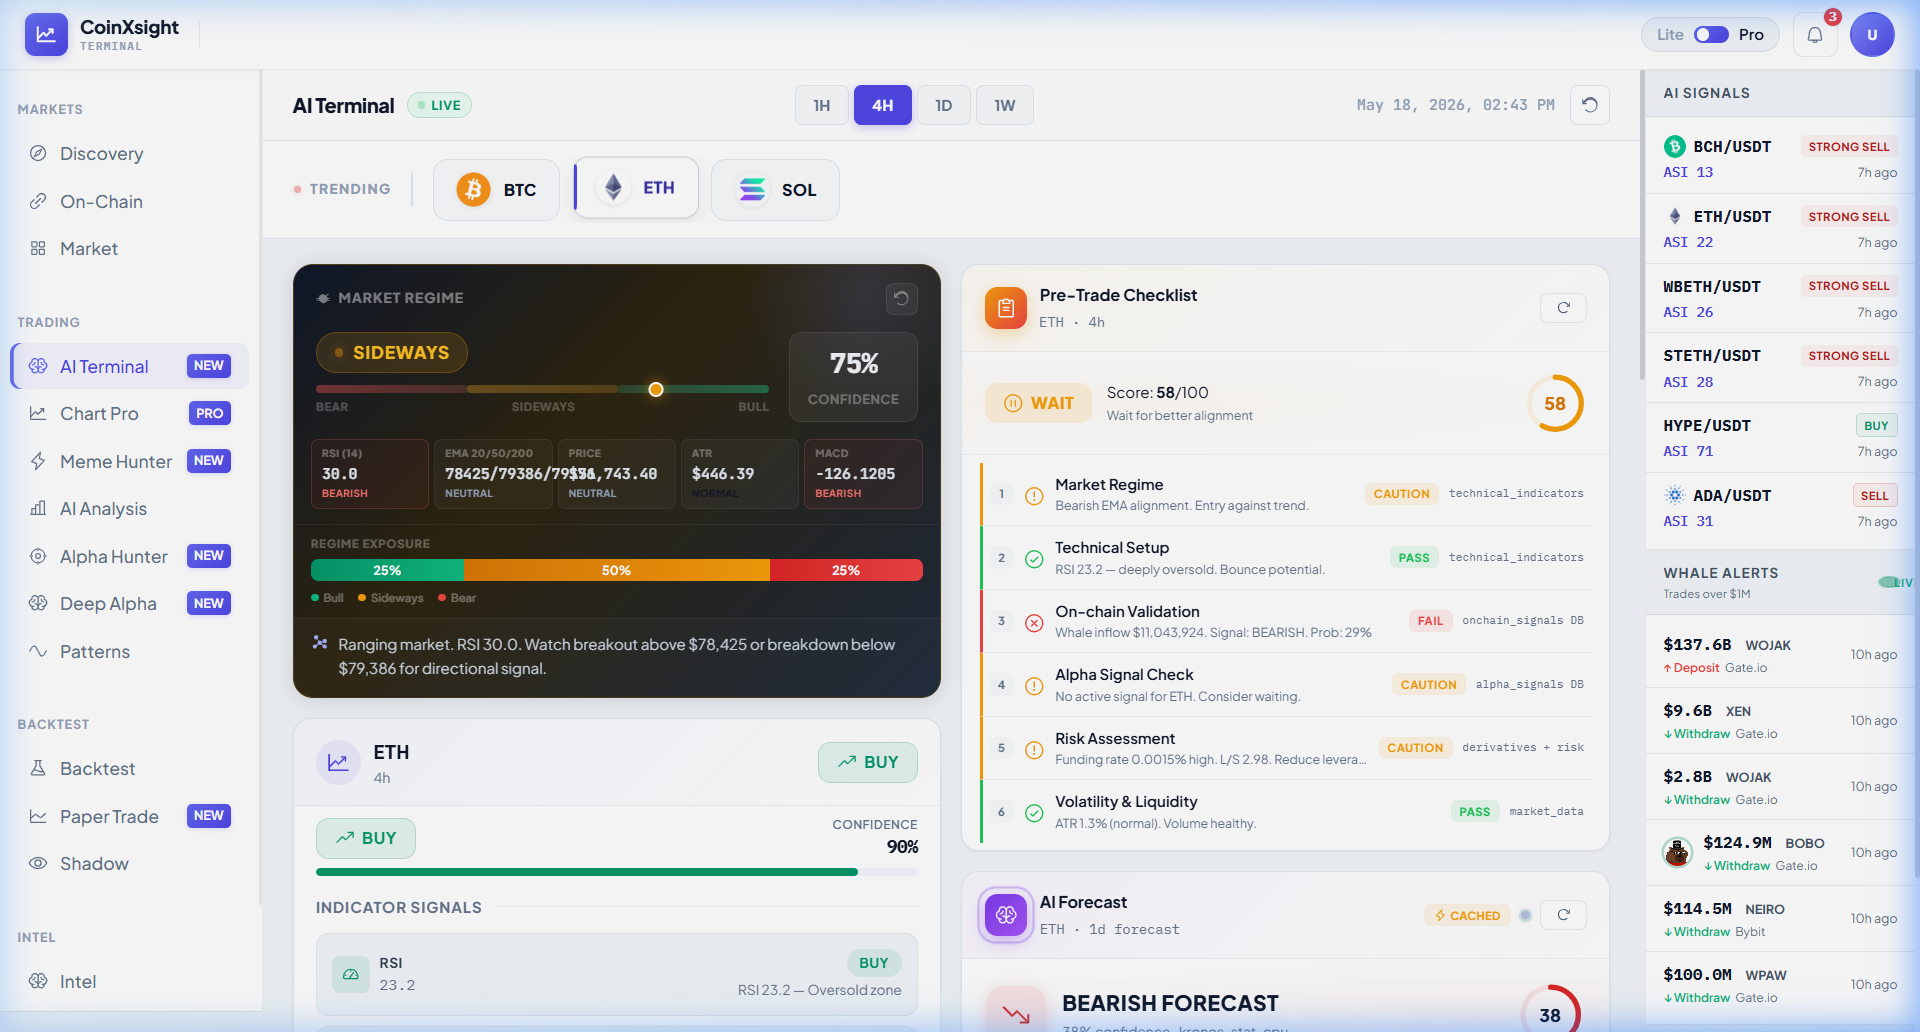
The AI Terminal provides a real-time read on the current cycle position. Let's decode the current ETH data:
Market Regime: SIDEWAYS (75% confidence)
This tells us we're NOT in a clear markup (bull) or markdown (bear) phase. Sideways regimes typically correspond to either:
Late accumulation (about to break up into markup) — if on-chain shows smart money buying
Early distribution (about to break down into markdown) — if on-chain shows smart money selling
Mid-cycle consolidation (range-bound pause within a larger trend)
ETH 4H: BUY (90% confidence), RSI 23.2 (Deep Oversold)
This is a critical data point. RSI at 23.2 is extremely oversold — a level that historically precedes a bounce. The AI assigns 90% confidence to a BUY signal on the 4H timeframe. However…
Pre-Trade Checklist: 58/100 → WAIT
Despite the oversold RSI and bullish 4H signal, the overall checklist says WAIT. Let's understand why:
AI Forecast (1D): BEARISH (38% confidence)
The daily timeframe forecast is bearish, which conflicts with the 4H buy signal. This multi-timeframe conflict is the hallmark of a transitional period — the market is deciding between continuation lower and a cycle bottom bounce.
Cycle interpretation: The data suggests we're in late markdown or early accumulation for ETH. The oversold RSI and 4H buy signal indicate the selling may be exhausting, but the whale inflow and bearish EMA alignment warn that the reversal isn't confirmed yet. This is exactly the type of environment where patient accumulation (small positions, wide stops) is appropriate — not aggressive buying.
Using On-Chain Data for Cycle Confirmation
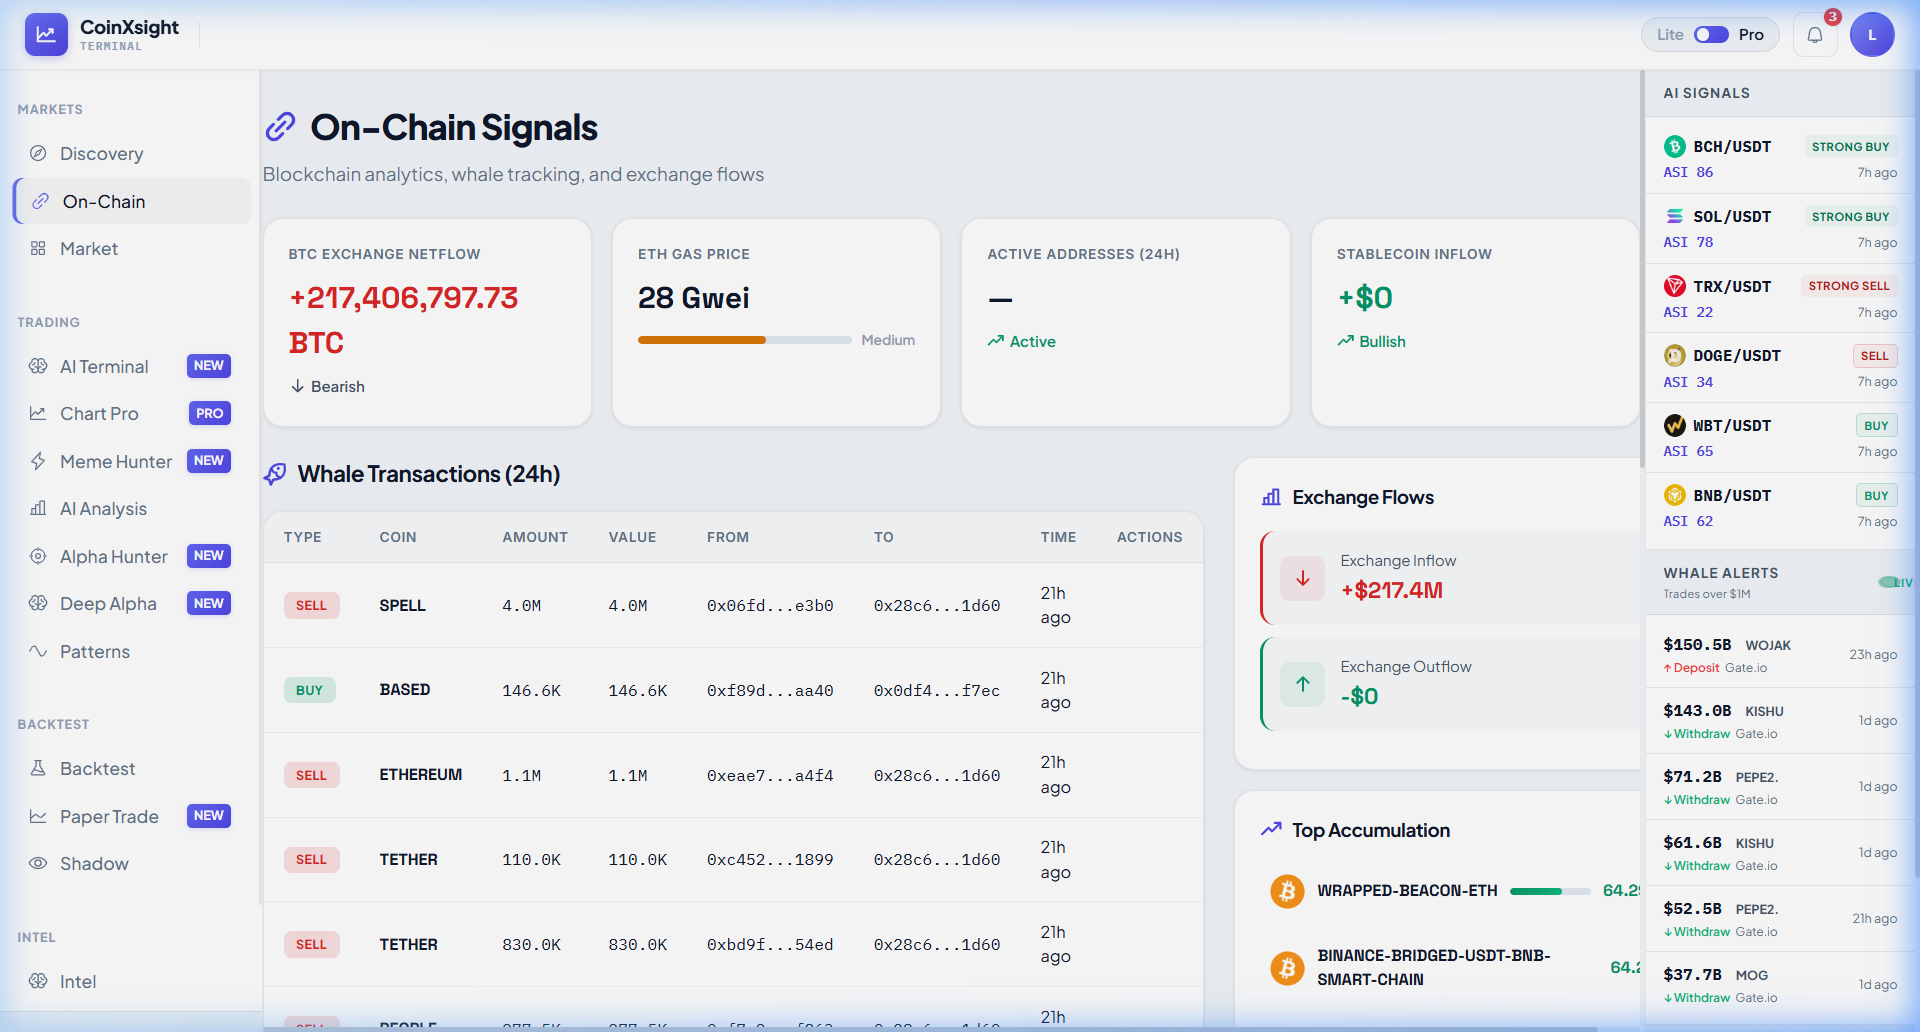
The On-Chain module provides the institutional perspective on cycle positioning:
Current readings:
BTC Exchange Netflow: +$217.4M — Net positive inflow = distribution. Tokens are flowing INTO exchanges faster than they're leaving. In cycle terms, this is characteristic of distribution (Phase 3) or markdown (Phase 4).
Whale Transactions: Multiple large SELL orders (SPELL 4.0M, ETHEREUM 1.1M). Smart money is actively distributing, not accumulating.
Stablecoin Inflow: Bullish — This is the one positive signal. Stablecoins flowing in means capital is available to buy if conditions improve. In accumulation phases, stablecoin reserves build up before being deployed into crypto.
Cycle verdict from on-chain: The combination of net exchange inflows (bearish) with stablecoin build-up (potentially early accumulation) suggests we're in a transition zone between markdown and accumulation. Smart money hasn't fully committed to buying yet, but the stablecoin positioning suggests they're preparing for an eventual entry.
Deep Alpha: Token-Level Cycle Positioning
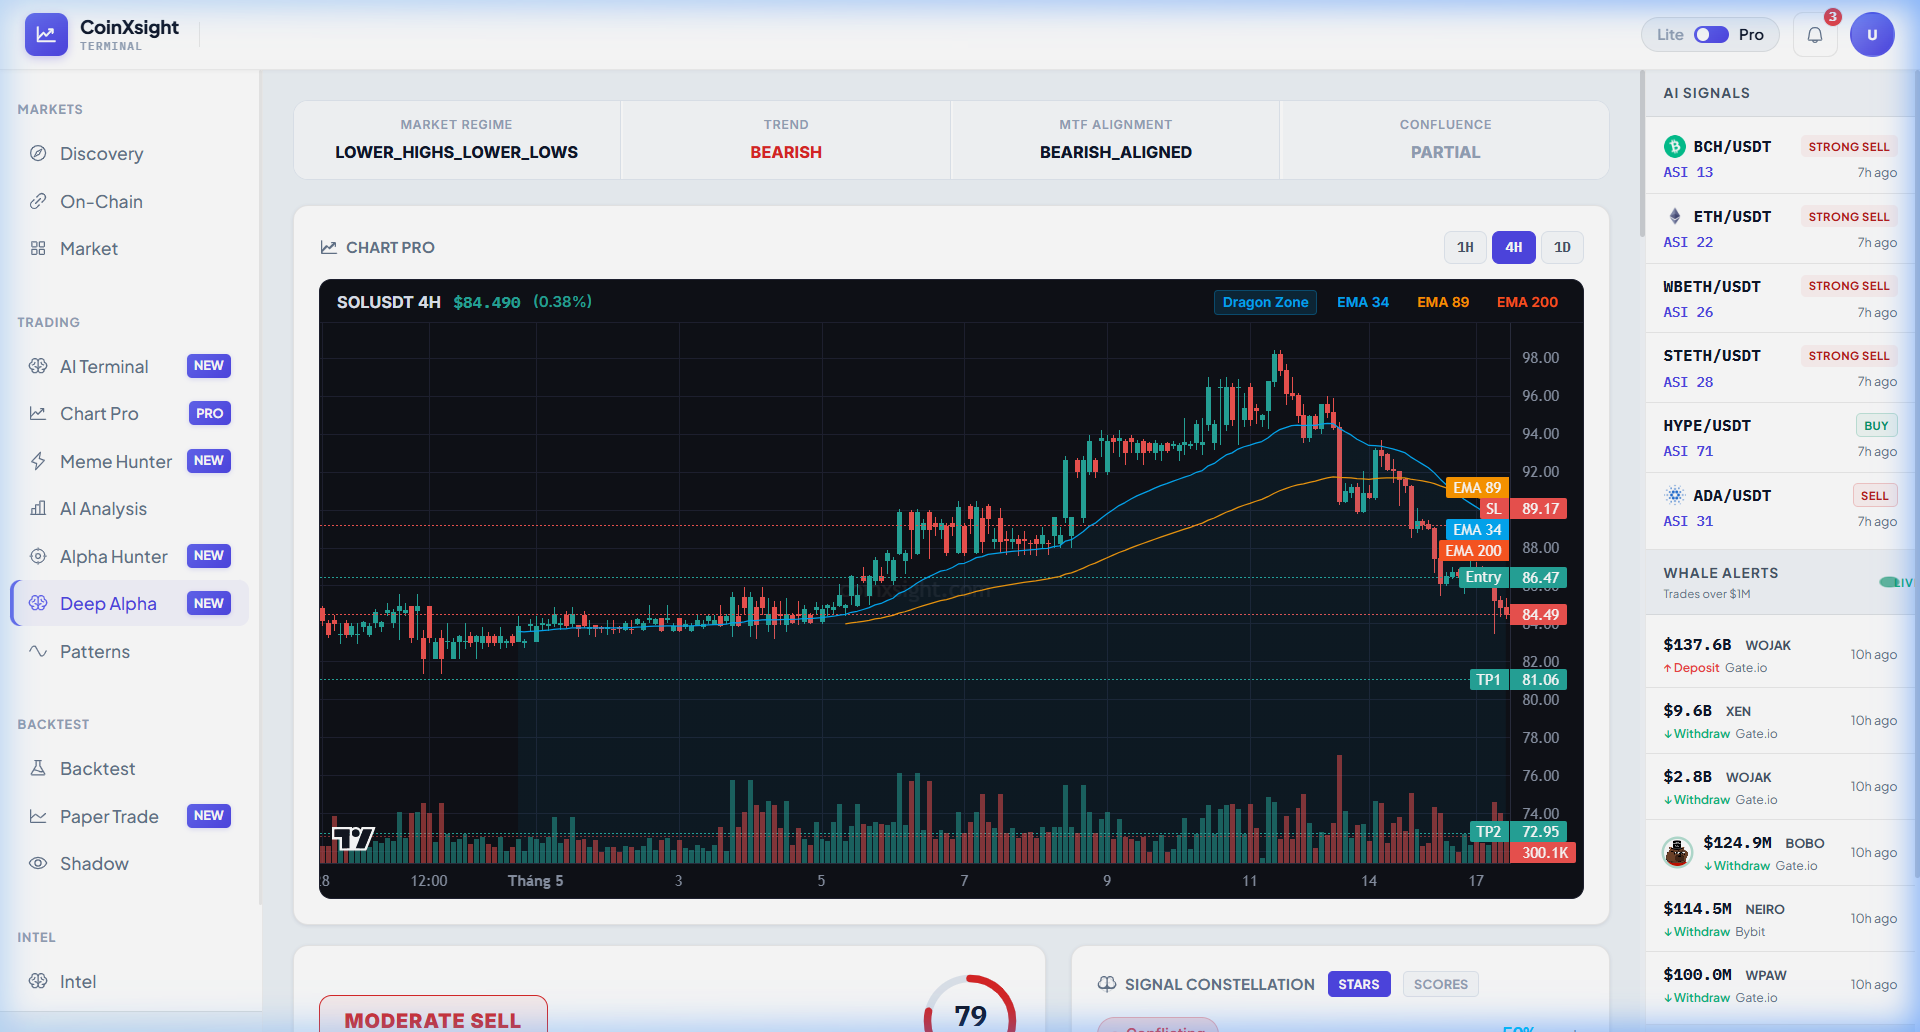
Deep Alpha provides token-specific cycle analysis. SOL's current reading shows:
Market Regime: LOWER_HIGHS_LOWER_LOWS
This is a textbook markdown (Phase 4) structure. The price is making consistently lower highs and lower lows — a bear trend that hasn't shown any signs of reversal.
MTF Alignment: BEARISH_ALIGNED
All timeframes agree — 1H, 4H, and 1D are all bearish. When all timeframes align, the cycle phase is clear and you should trade WITH the direction, not against it.
Confluence: PARTIAL
Despite the bearish trend, the confluence is only PARTIAL — meaning some indicators are starting to disagree. In cycle terms, this hints that the markdown may be maturing. Full consensus in a bear trend eventually breaks down as the first signs of accumulation appear.
AI-Powered Cycle Transition Detection
The hardest part of cycle analysis is identifying transitions — the moments when the market shifts from one phase to the next. These transitions are where the biggest opportunities (and risks) exist.
Transition 1: Accumulation → Markup (The Breakout)
AI Terminal signals:
Market regime shifts from SIDEWAYS to BULLISH (even at low confidence initially — 55-65%)
ASI scores for BTC/ETH cross above 65 and sustain for 3+ days
Pre-Trade Checklist score crosses above 70
On-Chain confirmation:
Exchange outflows exceed inflows for 5+ consecutive days
Stablecoin reserves begin declining (capital being deployed into crypto)
Your action: Increase position sizes from 50% to 100% of standard. Switch from range-bound strategies to trend-following strategies. Set targets based on previous cycle highs.
Transition 2: Markup → Distribution (The Top)
AI Terminal signals:
Market regime oscillates between BULLISH and SIDEWAYS rapidly
ASI scores show multi-timeframe divergence (1H bullish, 1D declining)
Exchange inflows spike — smart money depositing to sell at elevated prices
Whale wallets that accumulated in Phase 1 begin distributing
Funding rates become extremely positive (overleveraged longs)
Your action: Begin taking profits on existing positions (close 30-50%). Tighten stop-losses dramatically. Do not open new long positions at full size. Begin preparing a bear market watchlist.
Transition 3: Distribution → Markdown (The Breakdown)
AI Terminal signals:
Market regime flips to BEARISH (even at 55% confidence — this is significant)
Active addresses decline (retail leaving the market)
Your action: Close remaining long positions. Cash position should be 70-100% of portfolio. Only trade shorts if experienced. Begin building accumulation watchlists for the next cycle.
Transition 4: Markdown → Accumulation (The Bottom)
AI Terminal signals:
Market regime shifts from BEARISH to SIDEWAYS (the bear trend loses conviction)
ASI scores stabilize — they stop making new lows even as price continues to fall
Pre-Trade Checklist begins passing some checks (technical, volatility)
Whale wallets show new accumulation from historically profitable addresses
Social media engagement drops to multi-year lows (retail has fully capitulated)
Your action: Begin small accumulation positions (25-50% of standard size). Focus on tokens with the strongest on-chain accumulation signals. Set very wide stop-losses — bottoming processes are volatile and messy.
Multi-Timeframe Cycle Analysis
Different timeframes reveal different cycle phases simultaneously. A token can be in a 1H markup within a 4H consolidation within a 1D markdown. Understanding the hierarchy prevents conflicting signals from causing confusion.
The Timeframe Hierarchy
Timeframe
Cycle Length
Primary Use
Weekly
Major cycle (6-18 months)
Determine bull/bear macro context
Daily
Intermediate cycle (1-3 months)
Identify swing trading opportunities within the macro context
The rule: Always trade in the direction of the LARGEST timeframe cycle that applies to your holding period. A day trader using 1H charts should still check the 4H and Daily cycle direction. A swing trader should check the Weekly direction.
Not all sectors move through cycles simultaneously. Understanding sector rotation — which sectors lead and which lag — provides additional edge.
Typical Crypto Sector Rotation
Cycle Phase
Leading Sectors
Lagging Sectors
Early Markup
BTC, ETH (large caps lead the recovery)
Altcoins, Meme coins
Mid Markup
Layer 1s, DeFi, AI (narratives develop)
BTC (already moved)
Late Markup
Meme coins, micro-caps (retail speculation)
Everything else (rotation out)
Distribution
Stablecoins (capital rotation to safety)
All risk assets
Markdown
Stablecoins, shorts
Everything with price exposure
Accumulation
BTC (first to be accumulated)
Altcoins (still declining)
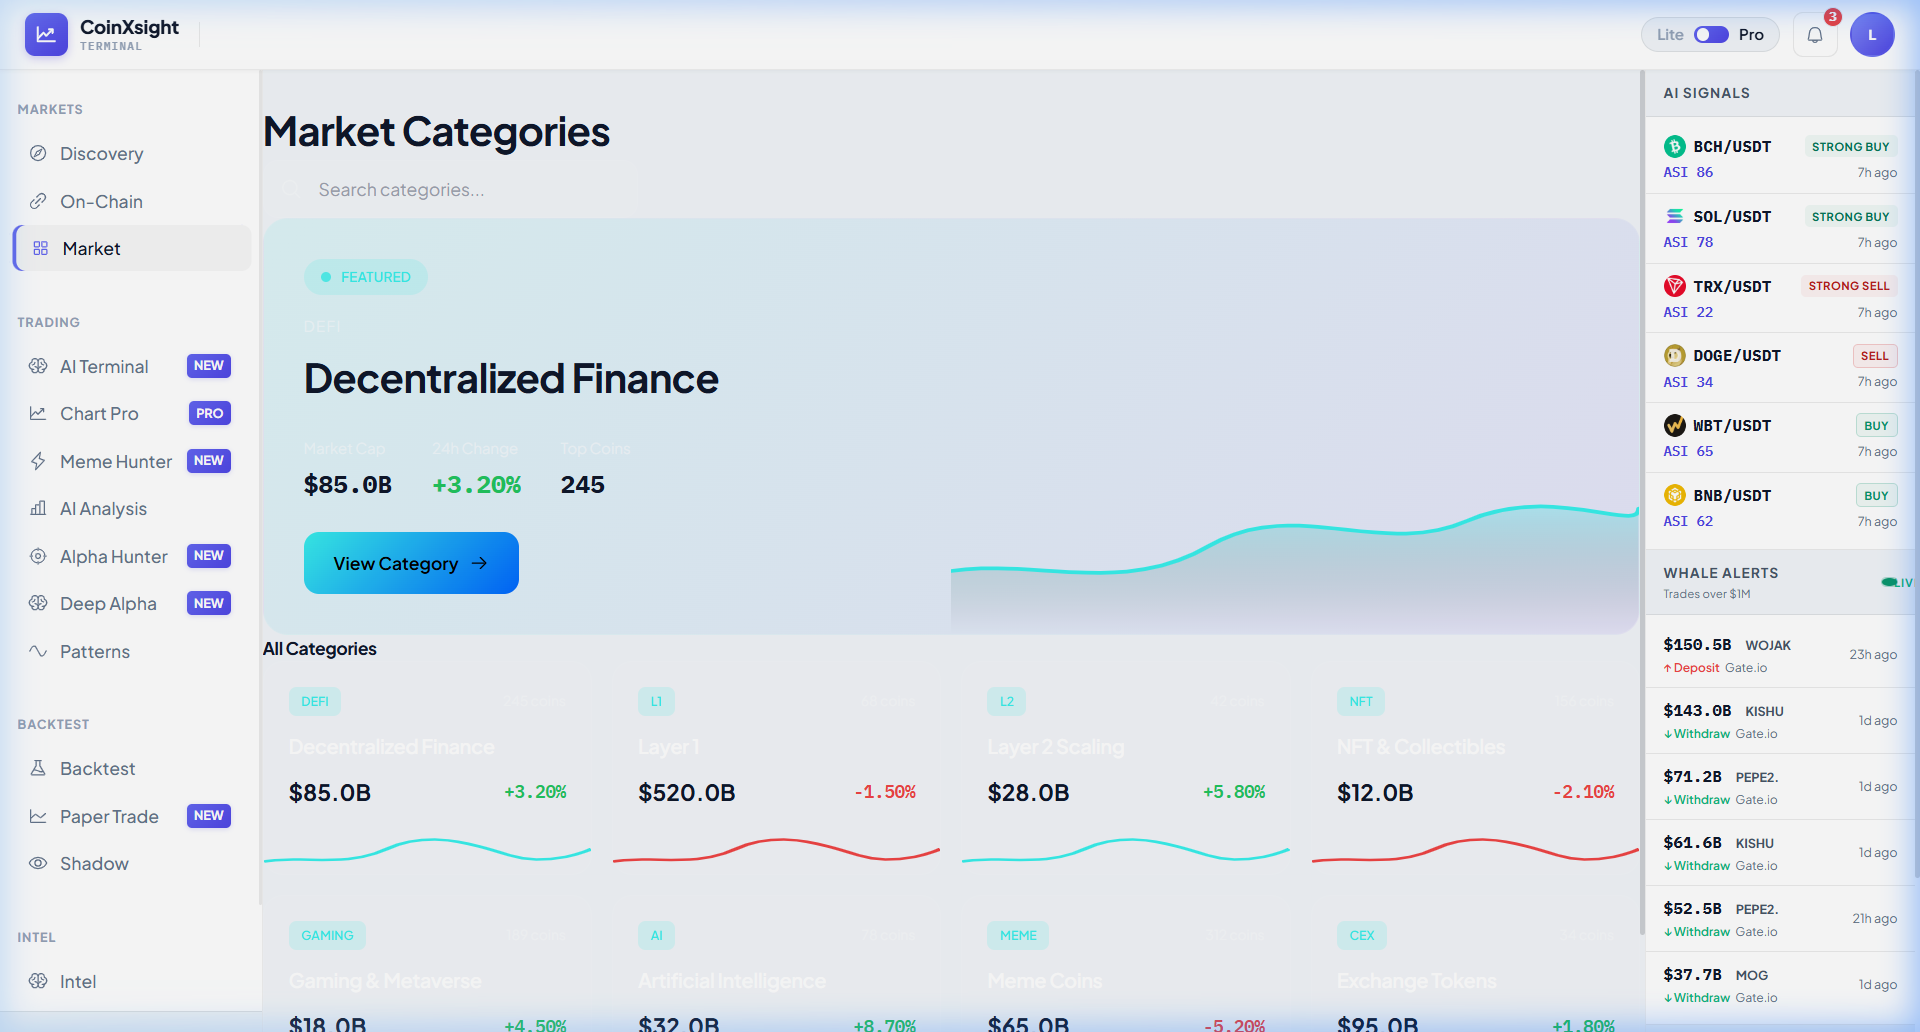
CoinXSight's Market module shows real-time sector performance. During your weekly cycle assessment, check which sectors are leading and lagging. If BTC is rising while altcoins are flat or declining, you're likely in early markup — focus on BTC and ETH, not altcoins.
Building a Cycle-Aware Trading System
Integrate cycle analysis into your existing trading system with these additions:
AI Terminal → What is the current market regime? (Bull/Bear/Sideways)
On-Chain → Are exchange flows bullish (outflows) or bearish (inflows)?
Deep Alpha → What is the market structure for BTC? (Higher highs or lower lows?)
Market Module → Which sectors are leading? Does the rotation pattern match a known cycle phase?
Write down: Current phase (Accumulation/Markup/Distribution/Markdown) and confidence level
Adjust Strategy Based on Phase
Phase
Position Sizing
Strategy Type
Max Drawdown Tolerance
Accumulation
25-50% standard
Range-bound, small longs
15% (expect choppy action)
Markup
100% standard
Trend-following, pullback longs
10% (trail stops aggressively)
Distribution
50-75% standard
Take profits, reduce exposure
5% (tighten everything)
Markdown
0-25% standard
Cash, selective shorts
3% (maximum capital preservation)
Common Cycle Analysis Mistakes
1. Assuming the Current Phase Will Last Forever
Bull markets don't last forever. Bear markets don't last forever. The most dangerous moment is when you become so comfortable in the current phase that you stop watching for transition signals.
2. Fighting the Macro Cycle
A 1H buy signal in a confirmed daily bear market is a trap 70% of the time. Always trade with the larger timeframe cycle, not against it. Short-term counter-cycle trades require exceptional skill and tight risk management.
3. Calling Tops and Bottoms
Cycle transitions are processes, not events. Distribution unfolds over weeks, not days. Trying to sell the exact top or buy the exact bottom is futile. Instead, focus on recognizing which phase you're in and adjusting your behavior accordingly.
4. Ignoring On-Chain Data
Technical indicators show you what the chart is doing. On-chain data shows you what the market participants are doing. In cycle analysis, on-chain data (especially exchange flows and whale tracking) often leads price by days to weeks.
Frequently Asked Questions
How long do crypto market cycles last?
Major cycles (accumulation → markup → distribution → markdown) typically last 3-4 years in crypto, closely tied to Bitcoin halving events. However, minor cycles within the major cycle last 1-3 months and provide trading opportunities in both directions.
Can AI predict which cycle phase comes next?
AI can detect transitions faster than manual analysis. CoinXSight's AI Terminal regime detection shifts from SIDEWAYS to BULLISH (or BEARISH) before most traders recognize the change. However, AI cannot predict black swan events (regulatory actions, exchange collapses) that can abruptly change the cycle.
Should I hold through bear markets?
For long-term investors with multi-year horizons and no leverage: yes, holding through bear markets and adding during accumulation has historically been profitable over full cycles. For active traders: no — preserving capital during markdown phases and redeploying during markup is significantly more efficient.
How do I know if we're in accumulation or just a bear market bounce?
Look for divergence between price and on-chain data. In accumulation, exchange outflows persist and smart money wallets accumulate even as price stays flat or dips. In a bear bounce, exchange inflows continue and smart money does not participate in the rally. CoinXSight's On-Chain module makes this distinction visible.
What's the best cycle phase for beginners?
The markup (bull) phase is most forgiving for beginners — buying in an uptrend is simpler and more forgiving of timing errors. Avoid the distribution and markdown phases until you have at least 6 months of experience. The Trading Psychology Guide covers the emotional challenges of each phase.
Summary
Understanding crypto market cycles — accumulation, markup, distribution, and markdown — is the foundational skill that determines whether your strategies succeed or fail. CoinXSight's integrated modules provide real-time cycle intelligence: the AI Terminal for regime detection, On-Chain for institutional flow analysis, Deep Alpha for token-level market structure assessment, and the Market module for sector rotation tracking.
The most important takeaway: Your strategy must change with the cycle. A single strategy applied across all cycle phases will produce inconsistent results. By adapting position sizing, strategy selection, and risk tolerance to the current phase, you dramatically improve your probability of long-term profitability.
Master multi-timeframe analysis for crypto trading. Learn the 3-timeframe rule, top-down analysis flow, timeframe alignment signals, and how to combine…