The Weekend Analysis Routine: How Pro Traders Prepare for Monday
A step-by-step 60-minute Sunday routine used by professional crypto traders to build watchlists, plan entries, review performance, and start each week with a decisive edge.
MC
Marcus ChenSenior Quantitative Strategist·May 22, 2026 · Updated Oct 6
The difference between consistently profitable traders and the rest isn't talent, intelligence, or even capital. It's preparation. While amateur traders react to Monday's price action in real-time — stressed, impulsive, and always one step behind — professional traders walk into the week with a fully prepared battle plan built during the quietest, most clear-headed hours of the week: Sunday.
This guide gives you a complete, repeatable 60-minute Sunday routine that transforms scattered market-watching into a structured process. This is one of the core habits in building a complete trading system. By the end, you'll have a framework that removes guesswork, reduces emotional trading, and builds the systematic habits that compound into long-term profitability.
Why Weekends Are Your Most Valuable Trading Time
Most traders think of weekends as downtime. Professionals know weekends are when the real work happens — and here's why:
No Market Noise
During the week, every candle, tweet, and liquidation cascade fights for your attention. Your brain is in reactive mode — processing information faster than it can analyze it. Weekends remove this noise entirely. You can think in complete sentences instead of reflexes.
Higher-Quality Decision Making
Research in behavioral finance shows that decisions made under time pressure are 60% more likely to be influenced by cognitive biases — recency bias, anchoring, loss aversion. Weekend analysis happens without a ticking clock, letting you evaluate setups objectively.
Pattern Recognition at Scale
When you're watching 1-minute candles during the week, you can't see the forest for the trees. Weekend analysis forces you onto higher timeframes — the weekly and daily charts where the real trends live. This bird's-eye view reveals patterns that intraday noise hides completely.
Emotional Reset
If you had a losing week, Sunday analysis gives you structured time to process those losses analytically rather than emotionally (see our Trading Psychology Guide for more on managing trading emotions). If you had a winning week, it prevents overconfidence from creeping into Monday's decisions. Either way, the routine acts as a psychological calibration tool.
The 60-Minute Weekend Routine — Step by Step
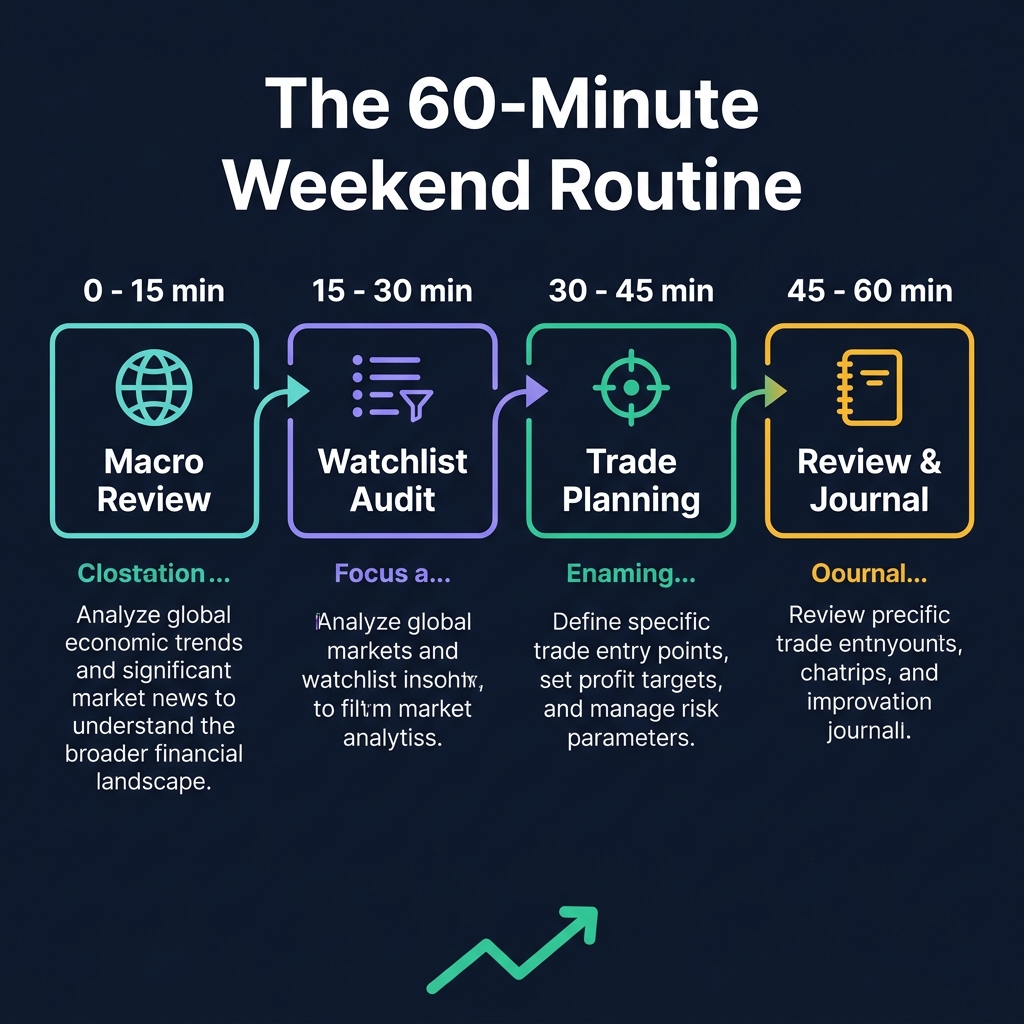
This routine is designed around four 15-minute blocks. Each block has specific goals, specific tools, and a defined output. No wandering, no doom-scrolling through crypto Twitter. When the 60 minutes are done, you have everything you need for the week.
Minutes 0–15: Macro Review
Goal: Understand the big picture — are we in a risk-on or risk-off environment?
This block answers the most important question in trading: "What is the market doing, and should I be aggressive, defensive, or sitting on my hands?"
1. BTC Weekly Chart (5 minutes)
Open the Bitcoin weekly chart. You're looking for three things:
Trend direction: Is BTC above or below the 21-week EMA? Above = bullish bias. Below = bearish bias.
Key levels: Where are the nearest weekly support and resistance zones? Mark them. These are the levels that will define the week's range.
Momentum: Is the weekly RSI rising or falling? Is MACD above or below zero?
Write one sentence summarizing BTC's weekly stance. Example: "BTC is above the 21W EMA at $108K, weekly RSI is 62 and rising, next resistance at $112K, support at $102K."
2. BTC Dominance Check (3 minutes)
BTC dominance tells you whether money is flowing into Bitcoin or rotating into altcoins. This single metric determines which assets deserve your attention this week:
BTC Dominance
Signal
Action
Rising above 55%
Money flowing to BTC
Focus on BTC/ETH, reduce altcoin exposure
Falling below 55%
Altcoin rotation beginning
Expand watchlist to mid-caps, sector leaders
Stable ± 1%
No clear rotation
Stick with current allocation
3. Fear & Greed Index (2 minutes)
Check the overall market sentiment:
Extreme Fear (0–25): Historically the best buying opportunities — but don't catch falling knives without confirmation
Fear (25–45): Cautious accumulation zone
Neutral (45–55): No extreme — trade based on technicals alone
Greed (55–75): Reduce position sizes, tighten stops
Extreme Greed (75–100): Danger zone — take profits, avoid new longs
Market Mood Map: Check the overall sentiment distribution
Sector Performance: Which sectors led and lagged this week?
Whale Activity Summary: Net inflows or outflows from exchanges?
Output of Block 1: A single paragraph summarizing the macro environment and your bias for the week (bullish, bearish, or neutral).
Minutes 15–30: Watchlist Audit
Goal: Refresh your active trading watchlist — remove dead weight, add fresh candidates.
If you don't have a structured watchlist yet, read our Crypto Watchlist Strategy Guide first. Here's the maintenance process for weekly updates:
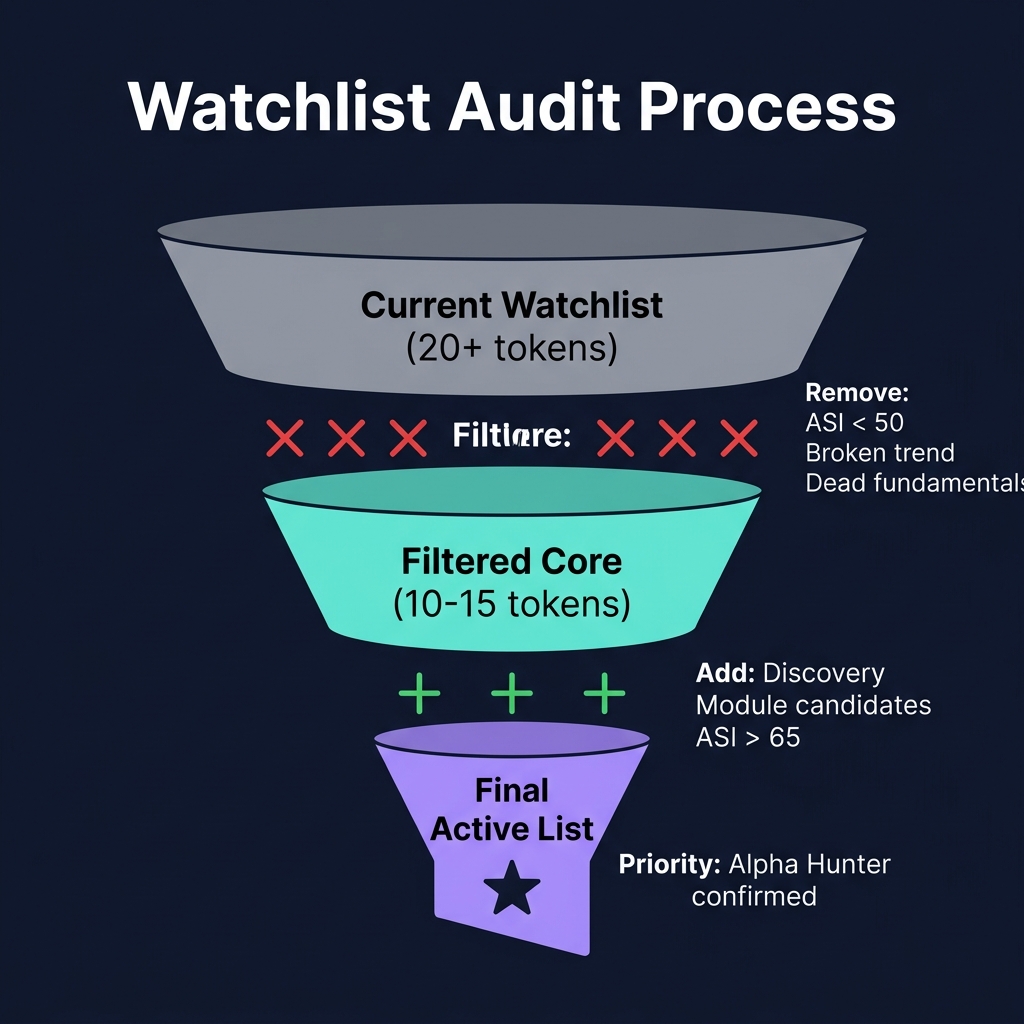
Step 1: Review Current Watchlist (5 minutes)
Go through every token on your active watchlist and ask three questions:
Is the trend still intact? If a token has broken its daily EMA structure (price below both 21 and 50 EMA), it's no longer a swing candidate. Remove it.
Is it approaching a key level? Tokens sitting in no-man's land (between support and resistance with no clear catalyst) are wasting mental bandwidth. Remove them from active watch, keep on radar.
Has the fundamental thesis changed? Token unlocks, protocol hacks, regulatory actions — any of these can invalidate a setup overnight.
Step 2: Remove Underperformers (3 minutes)
Apply the "3-day rule": if a token's ASI score has been below 50 for three consecutive days, remove it from your active list. This isn't permanent — it can come back when conditions improve. But right now, there are better opportunities elsewhere.
Sort by ASI Score descending. Add the top 3–5 tokens that aren't already on your watchlist.
Step 4: Cross-Reference Alpha Signals (2 minutes)
Check Alpha Hunter for any active signals on your watchlist tokens. If Alpha Hunter is flagging a token you're already watching, that's a confluence confirmation — mark it as priority for the week.
Output of Block 2: A clean, focused watchlist of 10–15 tokens with priority markers on the 2–3 best setups.
Minutes 30–45: Trade Planning
Goal: Define exact entry, stop, and target levels for your top setups — before the market opens and emotions take over.
This is the most critical block because it transforms your analysis into actionable conditional statements. No vague "I'll buy BTC if it looks good." Instead: precise, executable plans.
Step 1: Chart the Top 3 Setups (8 minutes)
For each of your top 3 watchlist tokens, open Chart Pro and:
Mark the key levels: Support, resistance, order blocks, fair value gaps
Identify the entry trigger: What specific event needs to happen? Examples:
"BTC reclaims $110K with a 4H close above"
"ETH breaks out of the descending wedge on volume"
"SOL retests the $175 support zone with a bullish engulfing"
Set the stop-loss: Below the most recent swing low or below the key structure level
IF [trigger condition] THEN enter [direction] with [position size] STOP: [level] = [risk amount] TP1: [level] = [reward amount] (close 50%) TP2: [level] = [reward amount] (close rest)
This format is critical because it pre-commits you to a decision before emotions get involved. Monday you're simply executing a plan, not making decisions under pressure.
Step 3: Check Economic Calendar (3 minutes)
Review the upcoming week for events that could cause volatility:
FOMC meetings or Fed speeches: Usually Wednesday
CPI or jobs data: Can spike volatility across all risk assets
Token unlocks: Large unlocks dilute supply — check your watchlist tokens
Protocol upgrades: Ethereum upgrades, Solana patches, etc.
If a major event falls on the same day as your planned entry, consider waiting until after the event or reducing position size.
Output of Block 3: 2–3 fully defined trade plans with exact entry, stop, and target levels.
Minutes 45–60: Review & Journal
Goal: Learn from the past week and close the feedback loop that separates improving traders from stagnant ones.
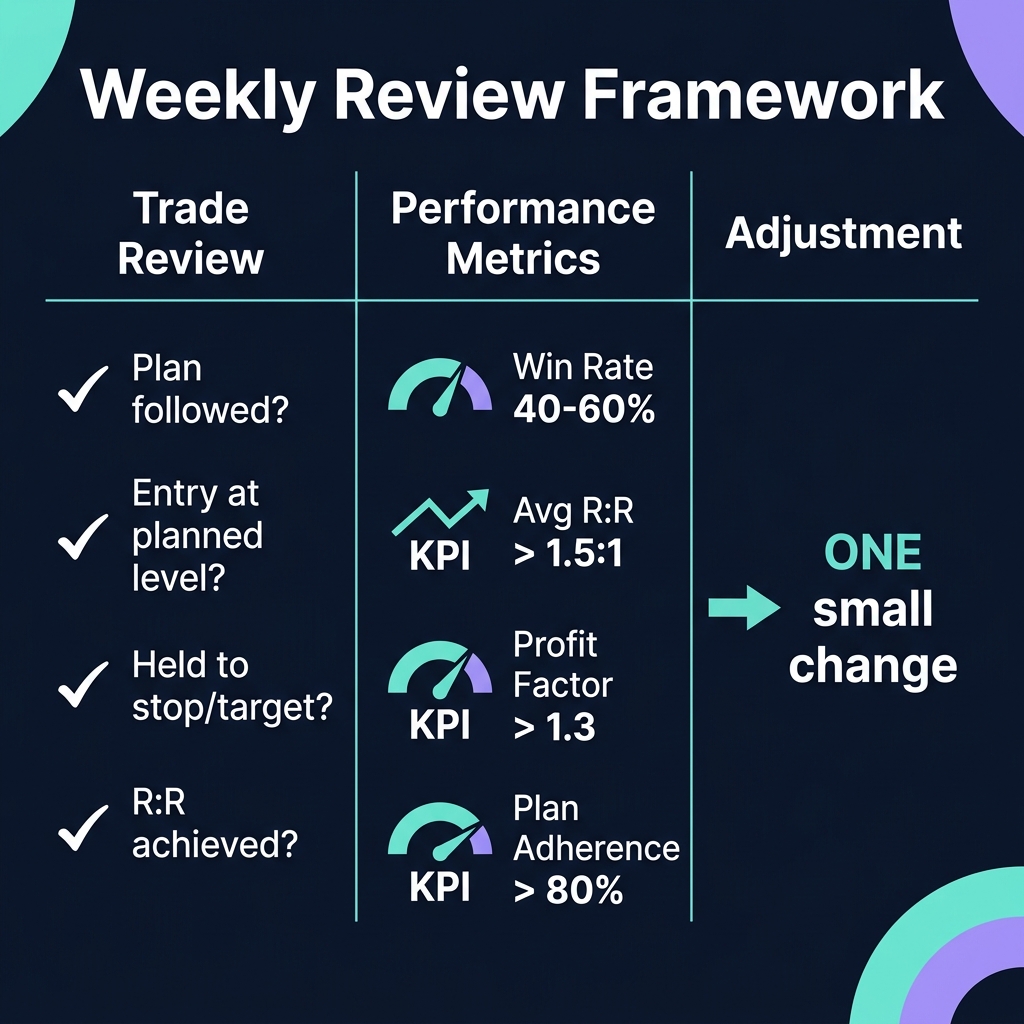
Step 1: Trade Review (8 minutes)
For each trade closed this week (winners AND losers):
Question
Why It Matters
Did I follow my plan?
Discipline measurement
Was the entry at the planned level?
Execution quality
Did I hold to my stop/target?
Emotional control
What was the R:R achieved?
Risk management effectiveness
Would I take this trade again?
Pattern recognition improvement
The most important metric isn't P&L — it's plan adherence. A trade that lost money but followed the plan perfectly is a GOOD trade. A trade that made money by accident (FOMO entry, moved stop) is a BAD trade that got lucky.
Step 2: Performance Metrics (4 minutes)
Update your weekly tracking sheet with:
Win rate: Total wins / Total trades (target: 40–60%)
Average R:R achieved: Average reward / Average risk (target: > 1.5:1)
Profit factor: Gross profit / Gross loss (target: > 1.3)
Max drawdown this week: Largest peak-to-trough decline
Plan adherence rate: Trades that followed the plan / Total trades (target: > 80%)
Step 3: Strategy Adjustment (3 minutes)
Based on your review, make ONE small adjustment for next week. Not five. One. Examples:
"I'll wait for 4H close confirmation before entering instead of limit orders"
"I'll reduce position size by 25% when RSI is above 70 on daily"
"I'll add whale flow confirmation as a required entry filter"
The key word is small. Overhauling your strategy every week is a guaranteed way to never develop consistency.
Output of Block 4: Updated trading journal, refreshed metrics, and one specific improvement for next week.
Common Mistakes in Weekend Prep
Even the best routine fails if you fall into these traps:
1. Over-Planning
Setting 20 alerts and planning 10 trades isn't preparation — it's anxiety disguised as productivity. Your brain can actively track 3–5 setups maximum. Pick your best and ignore the rest.
2. Ignoring the Macro Environment
You can have the perfect technical setup on an altcoin, but if BTC is about to dump 10%, that setup is worthless. Always start with macro before individual tokens.
3. Confirmation Bias in Review
When reviewing losing trades, it's tempting to blame "the market" or "manipulation" instead of honestly evaluating your process. The journal review only works if you're brutally honest with yourself.
4. Skipping the Routine After Winning Weeks
The routine matters MOST after winning weeks because that's when overconfidence creeps in. Winners who skip preparation tend to give back profits the following week through impulsive, oversized positions.
5. Turning Weekend Analysis Into Weekend Trading
The goal of this routine is to PLAN, not to trade. If you find yourself opening and closing positions during your Sunday analysis session, you've lost the plot. The value of weekend analysis is the separation between thinking and doing.
Making the Routine Stick: Habit Design
The best routine is worthless if you don't actually do it. Here are evidence-based strategies for turning this into an automatic habit:
Time Anchoring
Pick the exact same time every Sunday. Consistency eliminates the decision of "should I do my analysis now?" Common choices:
Sunday morning (9 AM): Clear-headed, fresh coffee, before family activities
Sunday evening (7 PM): After dinner, markets are quiet, naturally transitions into thinking about the week ahead
Environment Design
Always do your analysis in the same place, with the same setup. This trains your brain to enter "analysis mode" automatically. If possible, separate your analysis station from your trading station — even if it's just a different browser window layout.
Accountability
Share your weekly plan with a trading partner or in a trading community. Knowing someone will ask "did you follow your plan?" on Friday creates external accountability that supplements internal discipline.
Start Small
If 60 minutes feels overwhelming, start with just Block 1 (15 minutes of macro review). Once that's automatic, add Block 2. Build up over 4 weeks. A consistent 15-minute routine beats an inconsistent 60-minute one every time.
Frequently Asked Questions
Q: Does this routine work for day traders or just swing traders?
The core framework works for all timeframes, but the timeframes you analyze change. Day traders would look at daily charts (instead of weekly) for macro, and 1H/4H charts for setups. The key difference is day traders might do a shortened version of this routine every morning before market open, not just on weekends.
Q: What if crypto is 24/7 — isn't "weekend" meaningless?
While crypto markets never close, trading volume and volatility follow predictable patterns. Weekends typically have lower volume and wider spreads, making them suboptimal for execution but perfect for analysis. Most major moves still happen during traditional market hours (US and Asian sessions).
Q: How long before I see results from this routine?
Most traders report noticeable improvement in decision quality within 2–3 weeks. Measurable improvement in P&L typically takes 4–8 weeks because you need enough trades to generate statistically meaningful data. The immediate benefit is reduced stress and increased confidence — you'll feel the difference on your very first Monday.
Q: Should I do this routine even if I have no open positions?
Absolutely. In fact, the routine is MORE important when you have no positions because that's when you should be scanning for new opportunities. The watchlist audit (Block 2) and trade planning (Block 3) are specifically designed for finding fresh setups.
Q: What if my review shows I'm consistently losing — should I stop trading?
If your plan adherence is below 60% (meaning you're not following your own rules), the problem isn't your strategy — it's discipline. Work on execution before changing the plan. If plan adherence is above 80% and you're still losing after 50+ trades, THEN evaluate whether the strategy itself needs adjustment. Use the Backtest Engine to validate your strategy on historical data before making changes.
Your First Sunday: Start Here
Don't try to implement everything at once. Here's how to begin:
This Sunday: Do Block 1 only (15 minutes macro review). Write one paragraph summarizing the market.
Next Sunday: Add Block 2 (watchlist audit). Clean your watchlist using the process above.
Week 3: Add Block 3 (trade planning). Write your first conditional trade plans.
Week 4: Add Block 4 (review and journal). Close the feedback loop.
By week 4, you'll have a complete routine that runs on autopilot. Six months from now, you'll wonder how you ever traded without it.
Open CoinXSight this Sunday and start building the habit that separates amateurs from professionals.