Here is a pattern that repeats itself every cycle: a retail trader watches price charts, sees BTC break above a resistance level, buys, and then watches the price reverse within hours. The chart looked perfect. Every indicator was bullish. But the money was flowing out, not in.
Price shows you what happened. Money flow shows you what is about to happen.
In May 2026, Bitcoin is trading near $79,000. The chart shows consolidation. But beneath the surface, institutional ETF inflows have been positive for 11 consecutive days. Stablecoin reserves on exchanges are at a 6-month high. Whale wallets are accumulating. If you only watch the price chart, you see nothing. If you watch the money flow, you see a coiled spring.
This guide introduces the 5 types of money flow that every serious trader must track. By the end of this 7-part series, you will have a complete system for making trading decisions based on where capital is moving — not where price has already been.
💡 CoinXSight tracks money flow across multiple dimensions — On-Chain module monitors exchange netflow and whale movements, while Deep Alpha synthesizes flow data into the Confluence Score. This crypto analytics platform was built specifically for flow-based analysis.
What Is Money Flow in Crypto?
Money flow in crypto refers to the movement of capital between different asset classes, protocols, exchanges, and wallet types. Unlike traditional markets where flow data is delayed and opaque, crypto operates on transparent blockchains — meaning we can track capital movement in near-real-time.
The concept of tracking money flow to predict price movements was pioneered by Marc Chaikin, who developed the Chaikin Money Flow (CMF) indicator, building on the accumulation/distribution work of Larry Williams and Richard Wyckoff.
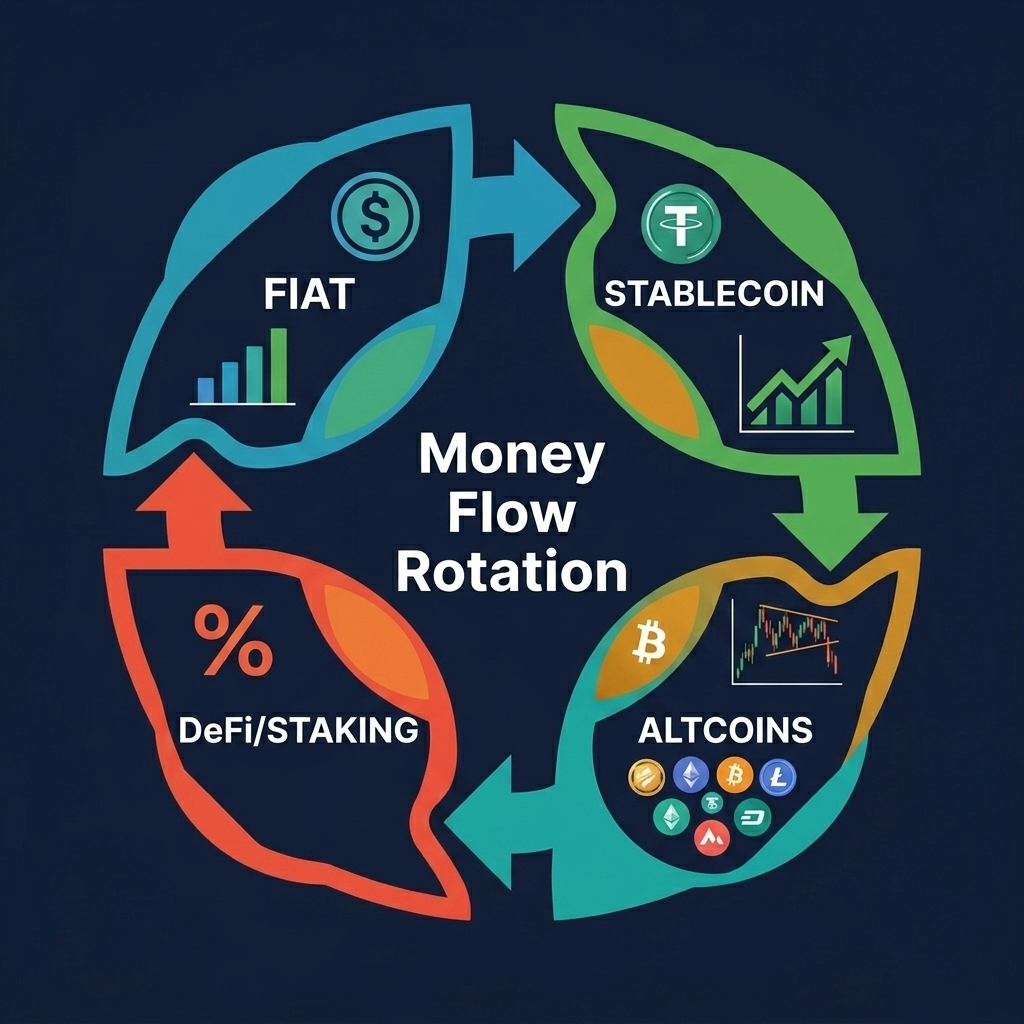
The core principle is simple: money moves in a predictable cycle. Understanding where you are in that cycle tells you what to buy, when to buy it, and when to exit.
Net Money Flow = Exchange Inflows − Exchange Outflows

Positive Net Flow = More capital entering exchanges (potential sell pressure)
Negative Net Flow = More capital leaving exchanges (accumulation signal)
The Crypto Capital Hierarchy
Capital enters and exits the crypto ecosystem through a structured hierarchy:
FIAT (USD, EUR, JPY)
  ↓  [on-ramp via crypto exchange]
STABLECOINS (USDT, USDC)
  ↓  [deployed to markets]
BITCOIN (store of value, first mover)
  ↓  [risk-on rotation]
ETHEREUM (smart contract platform)
  ↓  [sector rotation]
ALTCOINS (L1s, DeFi, AI, Meme)
  ↓  [yield seeking]
DeFi / STAKING (lending, farming, staking rewards)
  ↓  [profit taking]
FIAT (exit via crypto exchange)
Each transition in this hierarchy is a flow signal. When money moves down the hierarchy (from stablecoins into BTC, from BTC into alts), the market is risk-on. When it moves up (from alts into stablecoins, from stablecoins to fiat), the market is risk-off.
⚠️ Key insight for 2026: The flow hierarchy now includes a major new layer — ETF flows. Institutional capital entering through Bitcoin and Ethereum spot ETFs bypasses the stablecoin step entirely. This means traditional on-chain stablecoin analysis alone is no longer sufficient. You need to monitor both on-chain and institutional flow channels.
The 5 Types of Money Flow Every Trader Must Track
Not all money flow is created equal. Each type operates on different timeframes, uses different data sources, and signals different things. A complete money flow analysis combines all five.
Type 1: Institutional Flow
What it measures: Capital deployment by hedge funds, asset managers, corporate treasuries, and ETF providers.
Why it matters in 2026: Institutional capital now accounts for an estimated 35-40% of BTC trading volume. When BlackRock's IBIT reports $500M+ in daily inflows, that is real buying pressure that moves markets — and it often precedes 3-7 day price trends.
Signal interpretation:
Pattern
Signal
Timeframe
5+ consecutive inflow days
Strong bullish accumulation
1-2 weeks
Sudden large outflow ($300M+)
Institutional risk reduction
3-5 days
ETF inflow + exchange BTC outflow
Supply squeeze building
2-4 weeks
ETF outflow + exchange BTC inflow
Distribution phase
1-2 weeks
💡 CoinXSight's AI Mood Score on the Dashboard incorporates ETF flow sentiment as one of its inputs. When institutional flow turns positive while the AI Mood is still neutral, it often signals an upcoming shift before price confirms.
Type 2: On-Chain Flow
What it measures: Movement of crypto assets between wallets, exchanges, and protocols — visible on the blockchain.
Key metrics:
Exchange Netflow — net deposits minus withdrawals on crypto exchanges. Positive = selling pressure. Negative = accumulation.
Whale Wallet Activity — large transfers (>100 BTC or >1,000 ETH) between wallets
Miner Flows — when Bitcoin miners send coins to exchanges (potential sell pressure)
Inter-exchange Flows — capital moving between exchanges (arbitrage or positioning)
Why it matters: On-chain data is transparent and real-time. No other asset class gives you this level of visibility into participant behavior. Tools like Glassnode provide granular on-chain flow metrics that help traders quantify these capital movements across major exchanges.
Signal interpretation:
Metric
Bullish Signal
Bearish Signal
Exchange Netflow
Negative (outflows)
Positive (inflows)
Whale Wallet Balance
Increasing
Decreasing
Exchange BTC Reserves
Declining
Rising
Miner-to-Exchange
Low/stable
Spike above average
💡 CoinXSight's On-Chain module displays real-time exchange netflow, whale alerts (transactions >$1M), and accumulation/distribution scoring. The Whale Netflow metric on the Dashboard is one of the 4 hero stats visible at first glance.
Real Example — ETH Capital Rotation Signal (April 2026)
CoinXSight's Whale Tracker detected $340M in stablecoin mints over
48 hours while ETH exchange reserves dropped by 128,000 ETH. This
classic "dry powder accumulation" pattern — new capital entering
while supply leaves exchanges — preceded ETH's rally from $2,380
to $2,640 (+10.9%) over the following 10 days. The Money Flow
Confluence on CoinXSight read 8/10 bullish at the onset of the move.
Type 3: Stablecoin Flow
What it measures: The creation, destruction, and movement of stablecoins (USDT, USDC, DAI) — the "dry powder" of crypto markets.
Key metrics:
Stablecoin Market Cap — total supply. Rising = new capital entering crypto. Currently ~$323B. You can cross-reference stablecoin market cap data on CoinGecko to verify trends across multiple sources.
Stablecoin Supply Ratio (SSR) — BTC market cap ÷ stablecoin market cap. Low SSR = high buying power relative to BTC.
Exchange Stablecoin Reserves — stablecoins sitting on exchanges, ready to deploy. High reserves = potential buying ammunition.
Stablecoin Velocity — how frequently stablecoins are transacted. Rising velocity = capital being deployed, not parked.
USDT vs USDC Distribution — USDT dominates Asian/retail flow (~58%), USDC reflects US/institutional flow (~24%).
Why it matters in 2026: Stablecoin market cap has plateaued near $323B. The rapid minting phase of late 2025 has slowed. But exchange reserves remain elevated, suggesting capital is parked and waiting for a trigger. When stablecoin velocity spikes alongside rising exchange reserves, it historically precedes major market moves within 5-10 days.
Type 4: DeFi Flow
What it measures: Capital movement between DeFi protocols, chains, and yield strategies.
Key metrics:
Total Value Locked (TVL) — capital deployed in DeFi. Rising TVL = confidence and yield-seeking behavior.
TVL by Chain — which L1/L2 is attracting capital? (Ethereum, Solana, Base, Arbitrum)
Lending Rate Shifts — when lending rates spike on protocols like Aave, it signals demand for leverage (bullish, but risky).
Bridge Volume — capital flowing between chains. Spikes indicate narrative rotation.
Yield Curve — DeFi yield trends. Compressing yields drive capital into riskier assets.
Why it matters: DeFi TVL acts as a "risk appetite gauge." When capital flows from stablecoins into DeFi lending and farming, traders are confident. When TVL collapses, capital is fleeing to safety. In 2026, staking rewards and liquid staking have become a major component of DeFi flow, with over $120B in staked ETH alone.
Type 5: Retail Flow
What it measures: Behavior of individual retail traders — often the last to enter (tops) and last to exit (bottoms).
Social Sentiment — crypto Twitter/X engagement, Reddit activity, Google Trends. Extreme euphoria often marks local tops.
Retail Exchange Inflows — small deposits (<$10K) to exchanges. Spike = retail buying (often late in the move).
Long/Short Ratio — retail positioning on derivatives exchanges. >70% long = contrarian sell signal.
Why it matters: Retail flow is a contrarian indicator. When retail is maximally bullish (high funding, high social sentiment, high long ratio), the smart money is often selling. When retail is panicking (negative funding, fear on social media), institutions are accumulating.
⚠️ The flow hierarchy rule: Institutional flow > On-chain flow > Stablecoin flow > DeFi flow > Retail flow. When these layers conflict (e.g., retail is bullish but institutional flow is negative), always follow the higher-tier signal.
How These Flows Interact — The 2026 Flow Map
Understanding individual flow types is not enough. The real edge comes from understanding how they interact.
Stablecoin flow → market cap stagnant, velocity drops, reserves increase (parked, not deploying)
DeFi flow → TVL declining, capital fleeing to stablecoins
Retail flow → still buying (bag-holding), high funding rates, extreme greed
When institutional and on-chain flow turn bearish while retail is still bullish — that is the distribution signature. Smart money is selling to retail. This pattern preceded every major correction in 2024, 2025, and early 2026.
The Divergence Signal
The most profitable signals come from flow divergences — when one layer disagrees with the others:
Divergence
Meaning
Action
Price dropping + ETF inflows positive
Institutional accumulating at lower prices
Bullish setup — watch for reversal
Price rising + exchange inflows spiking
Whales distributing into strength
Bearish warning — tighten stops
Price flat + stablecoin velocity rising
Capital preparing to deploy
Breakout incoming — prepare position
TVL rising on specific chain + others flat
Narrative rotation beginning
Sector-specific opportunity
Real-World Example: BTC Flow Analysis — May 2026
Let us apply this framework to the current market:
Institutional Layer:
Bitcoin ETF flows: +$2.1B cumulative in May (net positive)
USDT velocity: declining (capital parked, not deploying)
Signal: NEUTRAL — capital exists but is waiting
DeFi Layer:
Total TVL: $198B (up 3% in May)
Ethereum staking TVL: $121B (stable)
Solana DeFi TVL: growing +8% — narrative rotation into SOL ecosystem
Signal: MILDLY BULLISH — selective rotation
Retail Layer:
BTC funding rate: 0.008% (slightly positive — not euphoric)
Crypto Twitter sentiment: mixed (not extreme in either direction)
Google Trends "Bitcoin": stable, not spiking
Signal: NEUTRAL — retail not yet FOMO
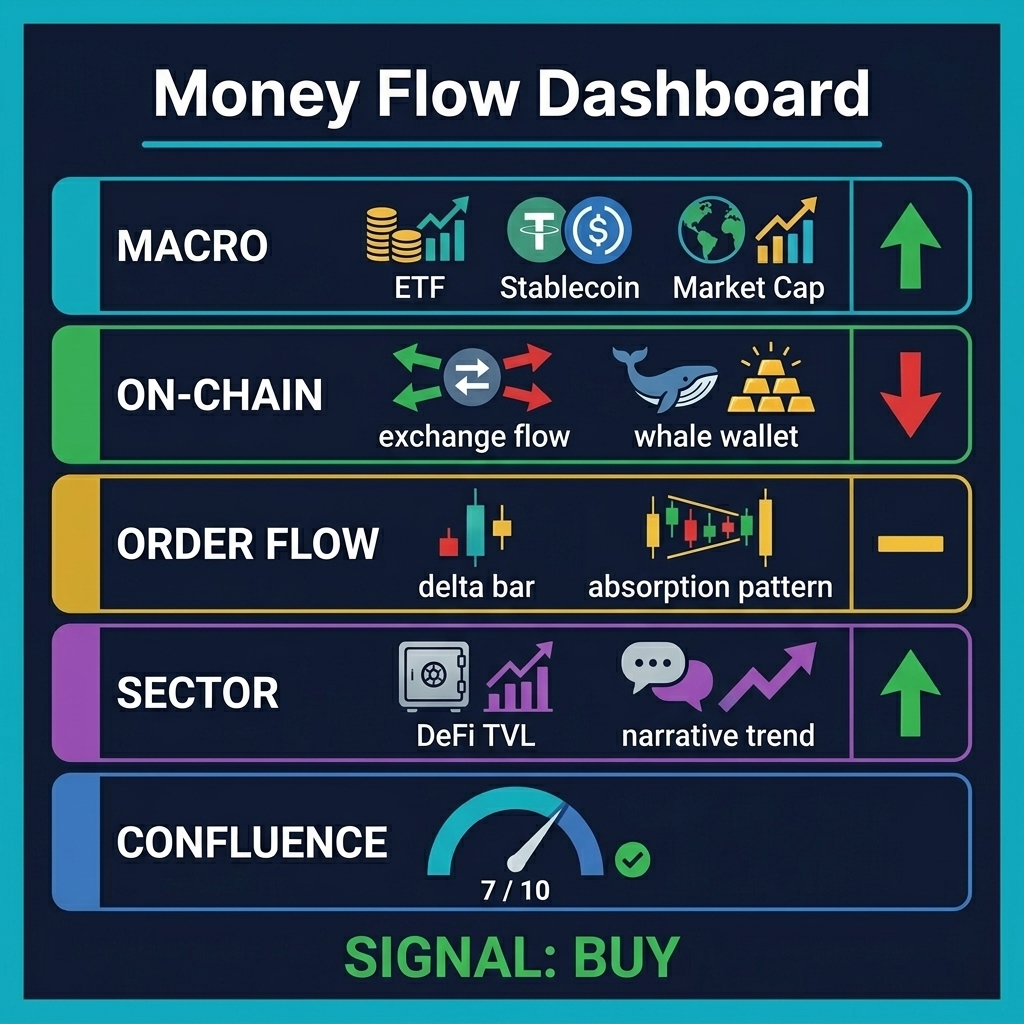
Combined Assessment: 2 Bullish + 2 Neutral + 1 Mildly Bullish = ACCUMULATION PHASE. Institutional and on-chain flow are leading. Stablecoin dry powder exists but hasn't deployed. Retail isn't euphoric. This pattern historically precedes a sustained move when the stablecoin velocity catalyst triggers.
💡 On CoinXSight, you can replicate this multi-layer analysis using the Dashboard for the overview, On-Chain for exchange and whale flow, and Deep Alpha for the Confluence Score that synthesizes all signals. This is the advantage of using a crypto portfolio tracker designed for flow analysis.
How to Track Money Flow on CoinXSight
As a comprehensive crypto analytics platform, CoinXSight makes multi-layer flow analysis accessible from a single dashboard:
Step 1: Check the Dashboard Overview
Navigate to Dashboard. The hero stats show real-time flow pulse:
Whale Netflow — positive = whale accumulation, negative = distribution
AI Mood Score — synthesizes institutional sentiment, social flow, and technical signals
Active Signals — number of tokens with active buy/sell signals based on flow + technical confluence
Step 2: Deep Dive on On-Chain Module
Open On-Chain for detailed exchange and whale flow:
Exchange Flow panel — shows net BTC, ETH, and stablecoin flows across major crypto exchanges (Binance, Coinbase, Kraken, OKX)
Whale Alerts — real-time transactions >$1M, with source and destination labels
Accumulation Score — AI-scored probability that a token is in an accumulation phase
Step 3: Cross-Reference with Deep Alpha
Navigate to Deep Alpha and select BTC or any token:
Confluence Score — the synthesis score (0-10) that factors in on-chain flow, technical indicators, and sentiment
Trend + Momentum — technical confirmation of the flow thesis
Smart Money panel — shows whether smart money is accumulating or distributing
Step 4: Set Alerts
Use CoinXSight to set alerts for flow changes — whale movements, exchange netflow spikes, or Confluence Score changes. This turns your crypto portfolio tracker into an active flow monitoring system.
Whether you want to buy Bitcoin at accumulation zones or trade altcoins during sector rotation, CoinXSight's flow analysis tools help you time entries on any crypto exchange with data-driven confidence.
What is Coming in This Series
This was Part 1 — the foundation. The remaining 6 parts dive deep into each flow type with specific trading strategies:
Part
Topic
What You Will Learn
2
ETF & Institutional Flow
How to read ETF data and trade the "institutional shadow"
3
Stablecoin Flow
SSR strategy, velocity triggers, mint/burn cycle trading
Each part builds on the previous one. By Part 7, you will have a complete trading system that uses money flow as the primary decision driver — with CoinXSight as your execution platform.
Frequently Asked Questions
What is the most important type of money flow to track?
Institutional flow (ETF + corporate treasury) is currently the most impactful in 2026 because of the sheer volume — Bitcoin spot ETFs alone manage over $70B in assets. However, on-chain exchange netflow provides the most timely signals because it updates in real-time, while ETF data is reported daily. The ideal approach is to monitor institutional flow for the macro trend and on-chain flow for timing entries on your crypto exchange.
Can money flow analysis replace technical analysis?
No — money flow and technical analysis are complementary, not competing. Money flow tells you where capital is moving (demand/supply dynamics). Technical analysis tells you where price is likely to react (support, resistance, patterns). The highest-probability trades occur when both align: money flow is bullish AND price reaches a technical support level. CoinXSight's Confluence Score combines both dimensions.
How do I track money flow for free?
Several free tools exist: Glassnode (limited free tier) for on-chain metrics, DeFiLlama for TVL data, CoinGlass for funding rates and ETF flows. However, synthesizing data from 5-6 different sources is time-consuming. A crypto analytics platform like CoinXSight consolidates flow data into a single dashboard with AI-scored signals, making the analysis significantly faster and more actionable.
Is money flow analysis useful for altcoins, or just Bitcoin?
Money flow analysis applies to all crypto assets, but with important differences. Bitcoin has the most reliable flow data (ETF, on-chain, stablecoin). For altcoins, focus on DeFi TVL flow (is capital entering this protocol?), whale wallet tracking (are large holders accumulating?), and sector rotation (is this narrative gaining capital?). CoinXSight's Discovery module helps identify altcoins with positive flow signals across multiple dimensions.
How quickly does money flow translate into price movement?
The lag varies by flow type. ETF flows typically impact price within 1-3 days. Large whale transfers can move markets within hours. Stablecoin supply changes take 3-7 days to manifest. DeFi TVL shifts correlate with 1-2 week trends. Retail sentiment extremes are the slowest — they can persist for weeks before the reversal occurs. Understanding these timeframes helps you align your trading bot strategies and position sizing accordingly.
Disclaimer: This article is for educational and informational purposes only and does not constitute financial, investment, or trading advice. Cryptocurrency markets are highly volatile and involve substantial risk of loss. No trading strategy guarantees profits — paper-trade or demo-trade before risking real capital. Always conduct your own research (DYOR) and consult a licensed financial advisor before making any investment decisions. CoinXSight provides analytical tools and data — not investment recommendations.