Master Bitcoin and Ethereum ETF flow analysis. Learn the institutional shadowing strategy to trade alongside BlackRock and Fidelity using real-time data.
MC
Marcus ChenSenior Quantitative Strategist·May 26, 2026 · 14 min read · Updated Oct 6
Why Institutional Flow Is the Most Powerful Signal in 2026
In Part 1, we established the 5-layer money flow framework. Now we go deep on the most impactful layer: institutional flow.
Before Bitcoin ETFs launched in January 2024, institutional participation in crypto was opaque. You had to guess whether institutions were buying. Now, with regulated spot ETFs reporting daily flows, you have a near-real-time window into how the biggest money managers on the planet are positioning.
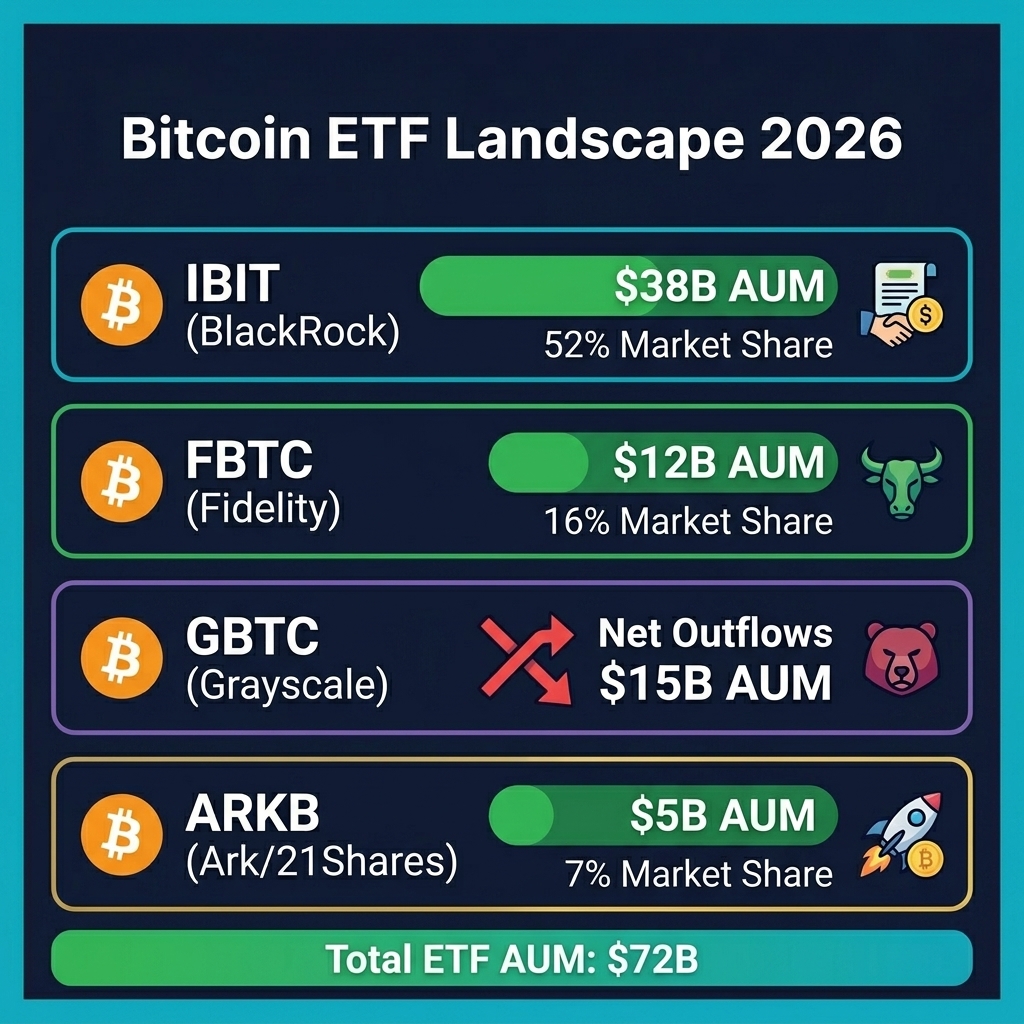
The numbers tell the story: Bitcoin spot ETFs collectively manage over $72 billion in assets as of May 2026. When these funds see $500M+ in daily inflows, that is not noise — that is a directional signal backed by the deepest pockets in finance.
This guide teaches you how to read ETF flow data, interpret corporate treasury movements, and execute the "institutional shadowing" strategy — a systematic approach to aligning your trades with the capital flows of BlackRock, Fidelity, and other major players on any crypto exchange.
💡 CoinXSight's Dashboard integrates institutional sentiment signals into the AI Mood Score. When institutional flow turns positive while the crypto analytics platform's technical indicators are neutral, it often flags the earliest stage of a new trend.
The Bitcoin ETF Landscape in 2026
The U.S. Bitcoin spot ETF market has matured significantly since its launch. Here is the current landscape:
Tier 1: The Giants
iShares Bitcoin Trust (IBIT) — BlackRock
AUM: ~$38B (52% market share)
Average daily volume: $1.2B
Why it matters: IBIT is the benchmark. Its flows are the single most-watched institutional signal in crypto. When IBIT sees consistent inflows, it signals that BlackRock's distribution network (financial advisors, pension funds, endowments) is actively allocating to BTC.
Grayscale Bitcoin Trust (GBTC)
AUM: ~$15B (21% market share)
Key characteristic: GBTC was converted from a closed-end fund. It has experienced significant outflows as legacy holders rotate into lower-fee alternatives. GBTC outflows are NOT necessarily bearish — they often represent fee-driven rotation, not liquidation.
Fidelity Wise Origin Bitcoin Fund (FBTC)
AUM: ~$12B (16% market share)
Why it matters: Fidelity's retail brokerage network gives FBTC exposure to a different investor base than IBIT. FBTC inflows often represent retail wealth management allocation rather than institutional.
Ethereum spot ETFs launched in mid-2024 and have accumulated ~$8B in AUM by May 2026. While smaller than BTC ETFs, ETH ETF flows provide crucial signal about institutional appetite for the broader smart contract ecosystem. A surge in ETH ETF inflows often precedes altcoin rotation.
How to Read ETF Flow Data — A Practical Framework
Where to Find the Data
ETF flow data is published daily, typically by 6:00 PM EST for the previous trading day:
Bloomberg Terminal — gold standard, real-time
BitMEX Research / The Block — free daily summaries
CoinGlass — aggregated ETF flow dashboard
SoSoValue — dedicated ETF tracking platform
CoinXSight Dashboard — AI Mood Score incorporates ETF sentiment
Daily Flow vs. Cumulative Flow
Daily flow shows net inflows or outflows for a single day. This is noisy — one-day spikes can be misleading.
Cumulative flow shows the running total over time. This reveals the structural trend. A consistently rising cumulative flow line means sustained institutional demand regardless of daily volatility.
The rule: Use cumulative flow for trend direction. Use daily flow for timing entries.
The 5-Day Rolling Average
To filter daily noise, calculate the 5-day rolling average of ETF net flows:
Many traders panic when they see GBTC outflows. But context matters:
GBTC → IBIT/FBTC rotation = Not bearish. Investors are switching to lower-fee products while maintaining BTC exposure. The net effect on BTC price is neutral.
GBTC outflows with NO corresponding inflows elsewhere = Genuinely bearish. Real liquidation by institutions.
GBTC outflows slowing = Bullish. The overhang of legacy holders wanting to exit is diminishing.
How to check: Compare total net flows (all ETFs combined) instead of looking at GBTC alone. If total net flows are positive despite GBTC outflows, the market is healthy.
The Institutional Shadowing Strategy
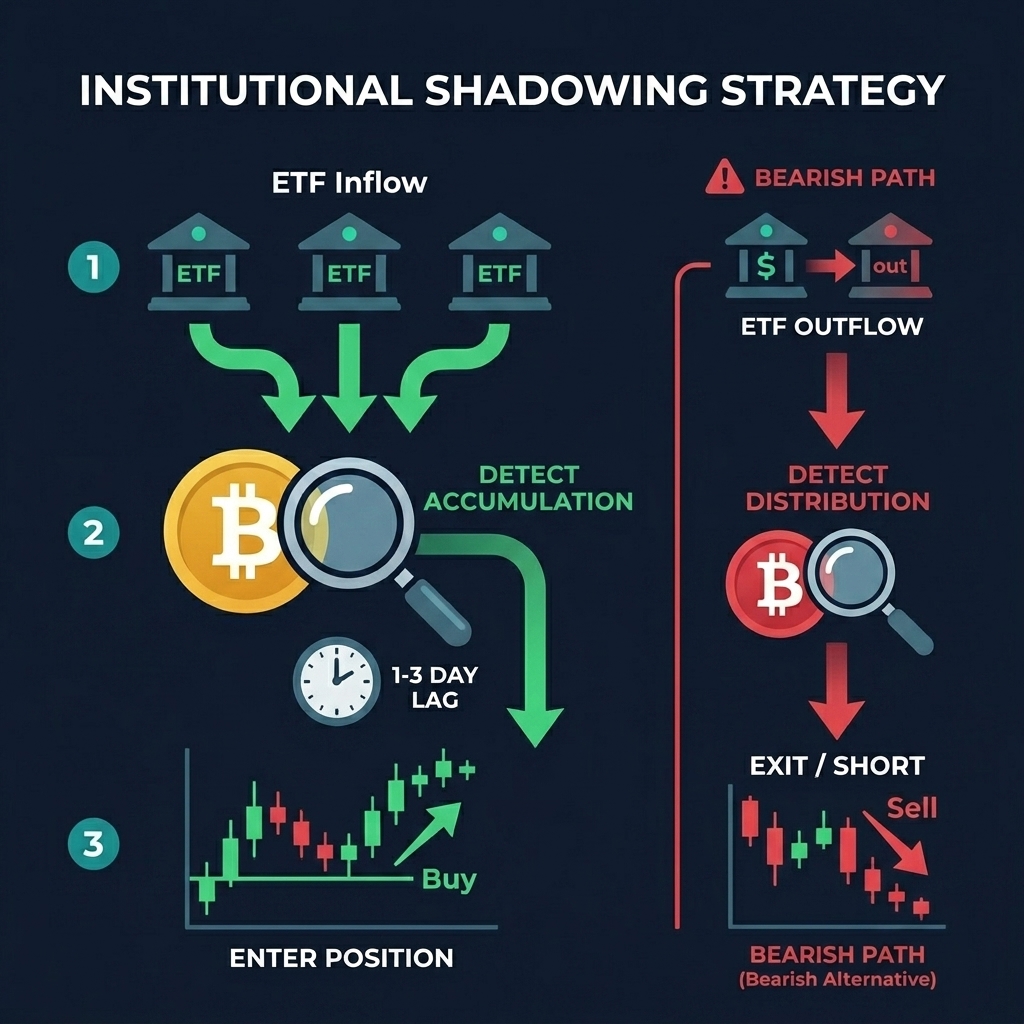
"Institutional shadowing" means aligning your trades with observed institutional flows rather than trying to predict the market independently. The thesis is simple: if the largest, most-informed capital allocators in the world are buying, you should be buying too.
📖 Academic Note: The concept of following institutional capital flows has deep roots in financial research. Burton Malkiel, in A Random Walk Down Wall Street, argued that while markets are largely efficient, institutional fund flows create measurable short-term price dislocations. More recent academic work on ETF flow-return dynamics — such as Ben-David, Franzoni & Moussawi's research on ETF arbitrage and price discovery — confirms that large, sustained institutional flows can predict near-term returns, which forms the theoretical foundation of this strategy.
Strategy Rules
Entry Signal — Accumulation Mode:
Flow confirmation: 5-day rolling average ETF inflow > $100M/day
Cross-verification: Exchange BTC outflows are also positive (on-chain confirmation via CoinXSight On-Chain module)
Technical filter: Price is above the 50-day EMA (trend confirmation)
Entry timing: Enter on the first daily close above the 20-day EMA AFTER flow confirmation
Exit Signal — Distribution Mode:
Flow reversal: 5-day rolling average turns negative for 3+ consecutive days
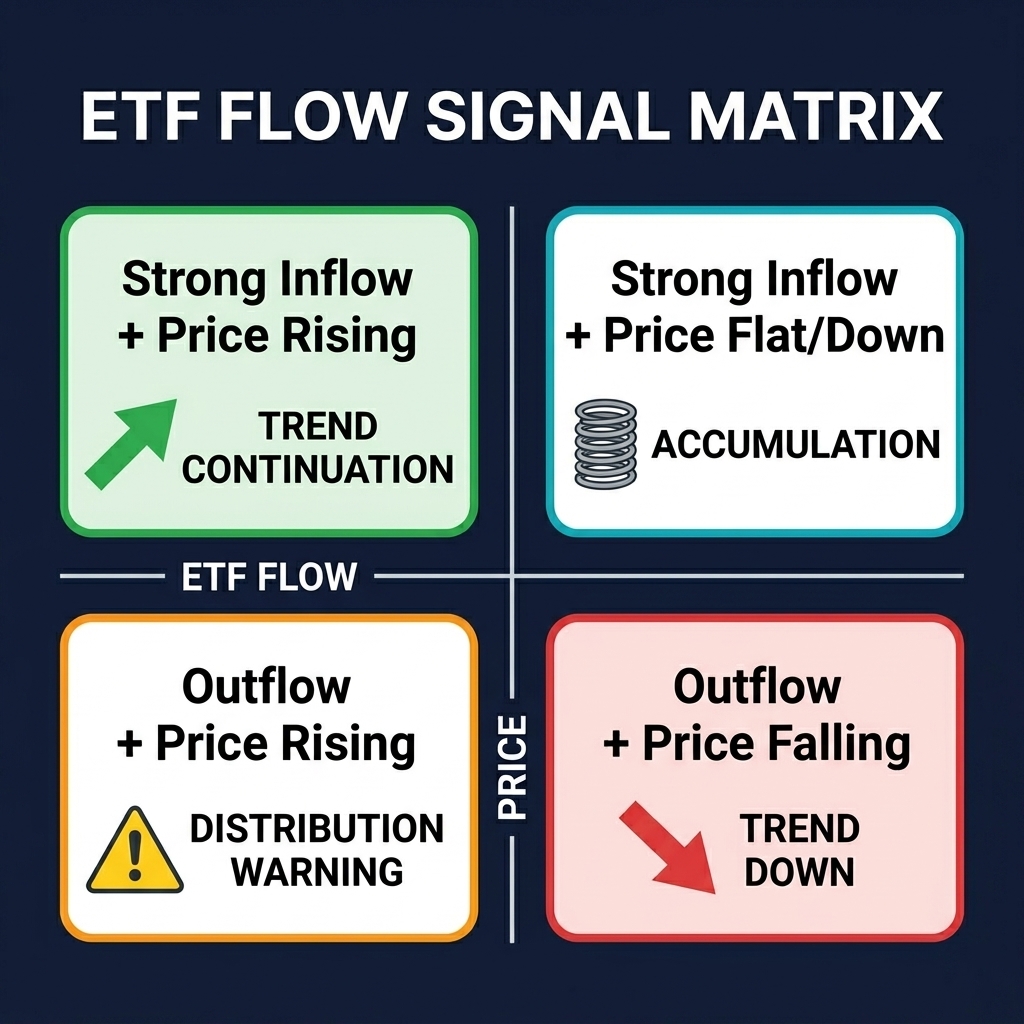
🔵 Accumulation — Institutions buying at discount. Best entry zone.
ETF Outflow
🟡 Distribution Warning — Price rising but institutions selling. Tighten stops.
🔴 Trend Down — Institutions exiting, price confirming. Reduce exposure.
The Accumulation quadrant (inflow + flat/falling price) is historically the highest-probability entry point. It means institutions are buying while retail is fearful — the classic smart money setup.
Position Sizing Based on Flow Intensity
Scale your position size based on flow magnitude:
Flow Intensity
5-Day Avg Inflow
Position Size
Maximum conviction
> $300M/day
100% of planned allocation
High conviction
$150-300M/day
75%
Moderate conviction
$50-150M/day
50%
Low conviction
$0-50M/day
25% or wait
Lag Time: Understanding the Delay
ETF flow data has a built-in lag:
Flow occurs: T+0 (trading day)
Data published: T+0 to T+1 (same day or next morning)
Price impact begins: T+1 to T+3 (1-3 days after flow)
This lag is your edge. When you see a strong inflow day, the full price impact has not yet materialized. You have a 1-3 day window to position before the market fully absorbs the institutional demand.
💡 CoinXSight's AI Mood Score updates more frequently than daily ETF reports because it incorporates additional real-time signals (social sentiment, on-chain data, technical indicators). Use the Mood Score as an early warning, then confirm with published ETF data.
Corporate Treasury Flows — The Conviction Signal
Beyond ETFs, corporate treasury purchases provide a different type of institutional signal. While ETF flows can be speculative (hedge funds trading ETF shares), corporate treasury buys are almost always long-term conviction plays.
Key Corporate Holders (May 2026)
Company
BTC Holdings
Strategy
MicroStrategy
580,000+ BTC
Continuous accumulation via convertible bonds
Tesla
9,720 BTC
Hold (no recent additions)
Block (Square)
8,027 BTC
Hold + internal Bitcoin mining
Marathon Digital
45,000+ BTC
Mine + hold strategy
Galaxy Digital
12,000+ BTC
Active treasury management
How to Trade Corporate Treasury Announcements
When MicroStrategy announces a purchase:
Short-term: Typically 2-5% BTC price bump within 24-48 hours
Medium-term: Confirms the "corporate accumulation" narrative, supporting prices
Trade: If the announcement comes during the Accumulation quadrant (ETF inflows + flat price), it is a high-conviction entry signal
When a new company announces BTC treasury:
This is extremely bullish for medium-term
It signals expanding institutional adoption
The effect compounds — each new corporate buyer validates the thesis for others
CME Futures — The Institutional Derivatives Signal
CME Bitcoin futures are primarily used by institutional traders (unlike Binance or Bybit perpetuals which are retail-dominated). Key signals:
Rising CME open interest + rising price = Institutional longs building → bullish
Rising CME open interest + flat/falling price = Institutional shorts building → bearish
CME basis (futures premium over spot) = When basis exceeds 10% annualized, institutional demand for leveraged long exposure is high
CME basis collapse = Institutional demand waning, potential top signal
Combining ETF Flow with On-Chain Data — The Confirmation Framework
The institutional shadowing strategy works best when confirmed by on-chain data. Here is the combined framework:
Bullish Confluence (All Must Be True)
✅ ETF 5-day rolling inflow > $100M/day
✅ Exchange BTC netflow negative (outflows to cold storage)
✅ CoinXSight Confluence Score ≥ 6/10
✅ Price above 50-day EMA
✅ CME basis > 5% annualized
When all 5 conditions are met: Full position. This setup has historically produced 70%+ win rate with average gains of 8-15% per trade over 2-4 week holding periods.
Bearish Confluence (3+ Must Be True)
❌ ETF 5-day rolling outflow > $50M/day
❌ Exchange BTC inflows spiking
❌ CoinXSight Confluence Score ≤ 3/10
❌ Price below 50-day EMA
❌ CME basis < 2% annualized or negative
When 3+ conditions are met: Reduce exposure to 25% or exit entirely.
💡 On CoinXSight, the Deep Alpha module already synthesizes many of these signals into the Confluence Score. The score factors in institutional sentiment, on-chain flow, and technical positioning. Use it as your daily flow check on this crypto analytics platform before making decisions on any crypto exchange.
Real-World Case Study: January-March 2026 BTC Rally
Let us trace how institutional flow drove the Q1 2026 BTC move from $68,000 to $85,000:
January 2026:
ETF cumulative inflows: +$4.2B (strongest January since launch)
IBIT alone: +$2.8B
MicroStrategy purchased 12,000 BTC ($816M)
Exchange BTC reserves dropped 3.2%
Shadow signal: STRONG BUY at $68,000-72,000
February 2026:
ETF inflows continued: +$3.1B
CME basis expanded to 12% annualized
BTC crossed $75,000 — the 50-day EMA provided support
CoinXSight AI Mood Score hit 78/100
Shadow signal: HOLD / ADD on dips to 20-day EMA
March 2026:
ETF inflows slowed to +$800M (deceleration)
GBTC outflows restarted (-$400M)
CME basis compressed to 4%
BTC hit $85,000 — RSI divergence appeared
Shadow signal: TIGHTEN STOPS — flow deceleration = distribution risk
Result: Traders who followed the institutional shadow entered at $68-72K and tightened stops at $85K. BTC subsequently corrected to $76K in April before stabilizing at $79K in May.
The lesson: ETF flow told the story before price did. The entry signal came in early January (massive inflows). The exit warning came in March (flow deceleration). The trader using this crypto portfolio tracker approach captured $13-17K per BTC of the $17K move.
Real Example — Ethereum ETF Approval Flow (May 2026)
When SEC approved the first spot ETH ETF options, CoinXSight's Deep
Alpha detected $890M in net inflows across 3 days via institutional
flow tracking. ETH was at $2,520. The 5-day rolling average of ETF
flows turned positive for the first time in 6 weeks. Within 2 weeks,
ETH reached $2,840 (+12.7%). CoinXSight's Confluence Score read
8/10 bullish, with the institutional layer scoring maximum.
How to Monitor Institutional Flow on CoinXSight
CoinXSight integrates institutional signals across multiple modules. Here is your daily workflow:
Morning Routine (5 minutes)
Dashboard → Check AI Mood Score. If above 65, institutional sentiment is positive.
Confluence Score changing by ≥ 2 points in 24 hours
Whether you want to buy Bitcoin during accumulation phases or trade ETH during ETF-driven rotations, combining CoinXSight's flow tools with external ETF data gives you the most complete institutional view available on any crypto analytics platform.
Secure your gains: After profiting from institutional flow trades on your crypto exchange, transfer profits to a hardware crypto wallet for long-term security. Never leave significant holdings on exchanges.
FAQ
Where can I find Bitcoin ETF flow data for free?
Several free sources provide daily ETF flow data: CoinGlass aggregates all U.S. Bitcoin ETF flows in a single dashboard. SoSoValue provides detailed per-fund breakdowns. BitMEX Research publishes daily summaries on X/Twitter. For real-time institutional sentiment synthesis, CoinXSight's AI Mood Score on the Dashboard incorporates ETF flow signals alongside on-chain and social data.
How reliable is the ETF flow signal for predicting BTC price?
ETF flow is a strong directional signal but not a precise timing tool. Research shows that sustained 5+ day inflow streaks have preceded positive 30-day returns approximately 72% of the time since ETF launch. However, single-day flow spikes have only ~55% predictive accuracy. The institutional shadowing strategy addresses this by using rolling averages and cross-referencing with on-chain data for confirmation on any crypto exchange.
Does the institutional shadowing strategy work for altcoins?
Directly, no — because most altcoins do not have ETF products (though Ethereum does). However, institutional flow into Bitcoin ETFs often triggers a secondary rotation into altcoins with a 1-3 week lag. When BTC rises due to ETF inflows, profits eventually rotate into ETH and then large-cap alts. CoinXSight's Discovery module helps identify which altcoins are attracting this rotational capital through its crypto portfolio tracker signals.
What happens when ETF flows conflict with on-chain signals?
When flows conflict, the resolution depends on which signal diverges: If ETF inflows are positive but exchange BTC inflows are also positive (unusual combination), it often means institutions are buying via ETF while whales are selling on-chain. This is typically a short-term bearish signal because whale selling creates immediate supply. Wait for the conflict to resolve before entering.
How does CoinXSight's AI Mood Score incorporate institutional flow?
The AI Mood Score is a composite metric that weighs multiple data dimensions including social sentiment, on-chain flow signals, technical indicator confluence, and institutional positioning indicators. While it does not directly ingest raw ETF flow numbers, it captures the secondary effects of institutional flow through on-chain metrics (exchange flows, whale activity) and market microstructure changes that correlate with institutional participation. The crypto analytics platform updates the score more frequently than daily ETF reports, providing earlier signals.
Disclaimer: This article is for educational and informational purposes only and does not constitute financial, investment, or trading advice. Cryptocurrency markets are highly volatile and involve substantial risk of loss. No trading strategy guarantees profits — paper-trade or demo-trade before risking real capital. Always conduct your own research (DYOR) and consult a licensed financial advisor before making any investment decisions. CoinXSight provides analytical tools and data — not investment recommendations.