In Part 2, we covered how institutional ETF flows signal the direction of the biggest players. Now we examine the fuel that powers every crypto rally: stablecoins.
Think of stablecoins as ammunition. A crypto exchange can only process buy orders if buyers have capital loaded and ready. When USDT and USDC pile up on exchange wallets, it means buyers are loaded but have not fired yet. When those stablecoins start moving — converting into BTC, ETH, or altcoins — the breakout begins.
As of May 2026, the stablecoin market sits at approximately $323 billion (per CoinGecko). But the total number is less important than the dynamics — is that capital flowing in, out, sitting idle, or rotating? This guide teaches you how to read those dynamics and trade accordingly.
💡 CoinXSight's On-Chain module tracks stablecoin flows across major crypto exchanges. When exchange stablecoin reserves spike while BTC price is flat, the platform flags it as a potential accumulation setup — exactly the divergence signal this article describes.
The 5 Key Stablecoin Metrics Every Trader Must Know
Metric 1: Stablecoin Market Cap
What it is: Total supply of all stablecoins in circulation (USDT, USDC, DAI, BUSD, TUSD, etc.).
Current state (May 2026): ~$323 billion, plateauing after rapid growth in late 2025.
How to interpret:
Rising market cap → New fiat capital entering crypto ecosystem. Structurally bullish over weeks/months.
Falling market cap → Capital leaving crypto. Stablecoins being redeemed for fiat. Structurally bearish.
Flat market cap → No fresh capital, but no exits either. Market moves will come from rotation of existing capital, not new money.
2026 context: The current plateau means we are in a "rotation market" — capital shifts between assets rather than flowing in. This makes timing more important than direction.
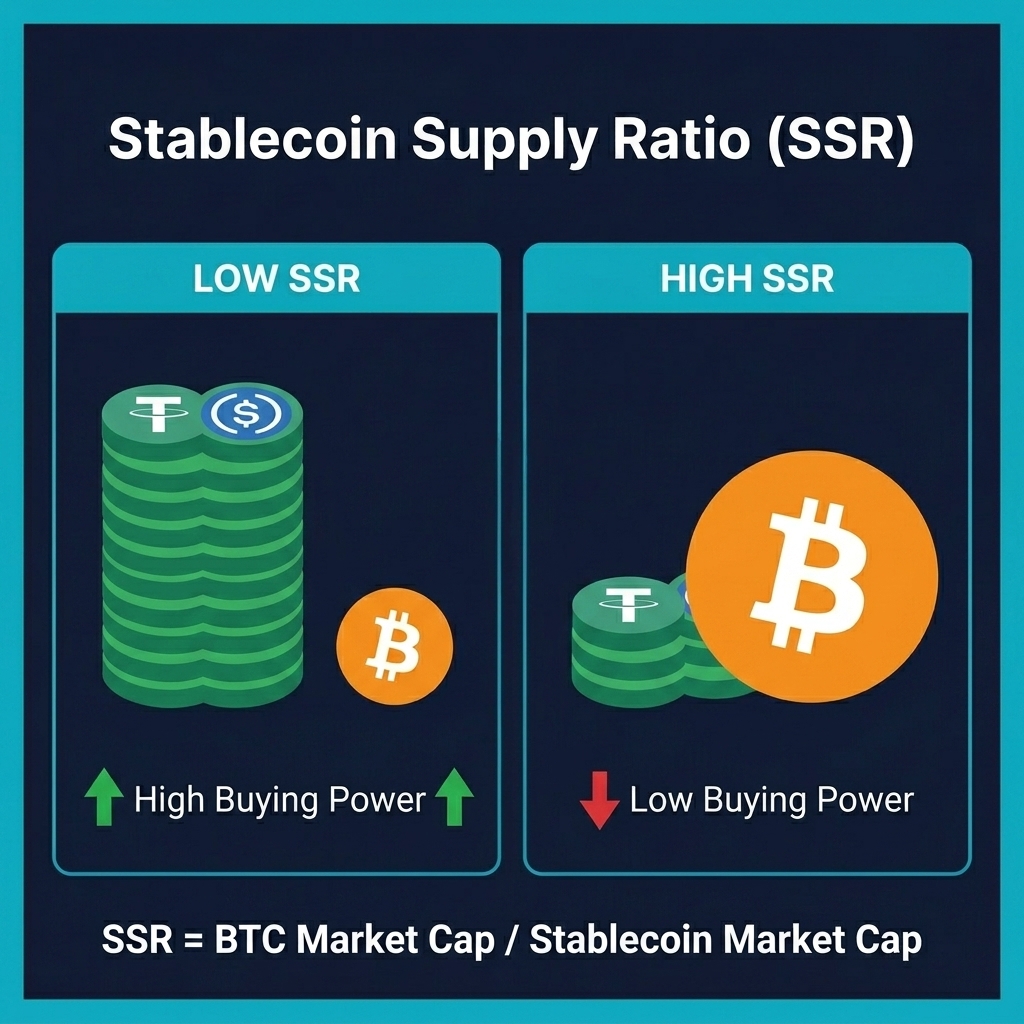
Metric 2: Stablecoin Supply Ratio (SSR)
Formula: SSR = BTC Market Cap ÷ Stablecoin Market Cap
How to interpret:
Low SSR (below 5) → Stablecoin supply is large relative to BTC. High buying power exists. If deployed, BTC can move significantly upward.
High SSR (above 10) → BTC has grown faster than stablecoins. Buying power is diminished relative to market size. Harder to push BTC higher from here.
SSR declining → Stablecoins growing faster than BTC. Buying power building.
SSR rising rapidly → BTC rallying without proportional stablecoin growth. Late-stage move.
Current SSR (May 2026): ~4.8 (BTC market cap $1.56T ÷ Stablecoin market cap $323B). This is relatively low, suggesting substantial buying power exists if deployed.
Metric 3: Exchange Stablecoin Reserves
What it is: Total stablecoins held on crypto exchange wallets — the "ready-to-deploy" capital.
How to interpret:
Rising reserves → Traders are loading exchanges with capital. They intend to buy soon. Bullish setup.
Falling reserves → Capital being withdrawn from exchanges. Either deployed into trades already or exiting crypto entirely. Check BTC price for context.
High reserves + flat BTC → The most bullish setup: loaded ammunition, no buying yet. Spring is compressed.
May 2026 data: Exchange stablecoin reserves at $42.1B (elevated). Combined with the low SSR, this confirms significant buying power exists.
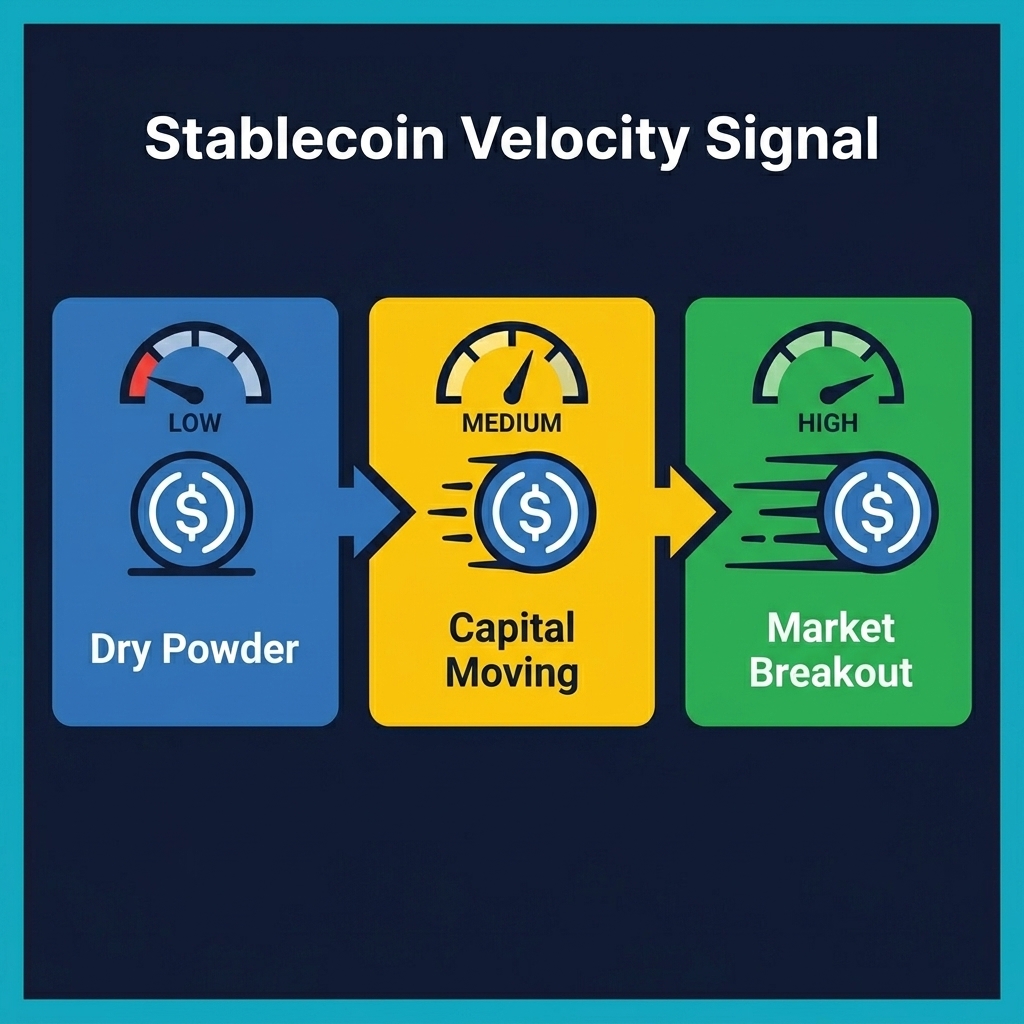
Metric 4: Stablecoin Velocity
What it is: How frequently stablecoins are transacted (total transfer volume ÷ market cap per period).
How to interpret:
Low velocity → Stablecoins are parked. Capital is idle. No imminent market move.
Rising velocity → Capital is starting to move. Traders deploying stablecoins into positions. Early breakout signal.
High velocity → Active trading. Stablecoins rapidly converting to volatile assets. Breakout in progress.
The velocity catalyst: The transition from LOW to RISING velocity is the key trading signal. When stablecoins that have been parked start moving, a significant price move follows 70% of the time within 5-10 days.
Metric 5: USDT vs USDC Distribution
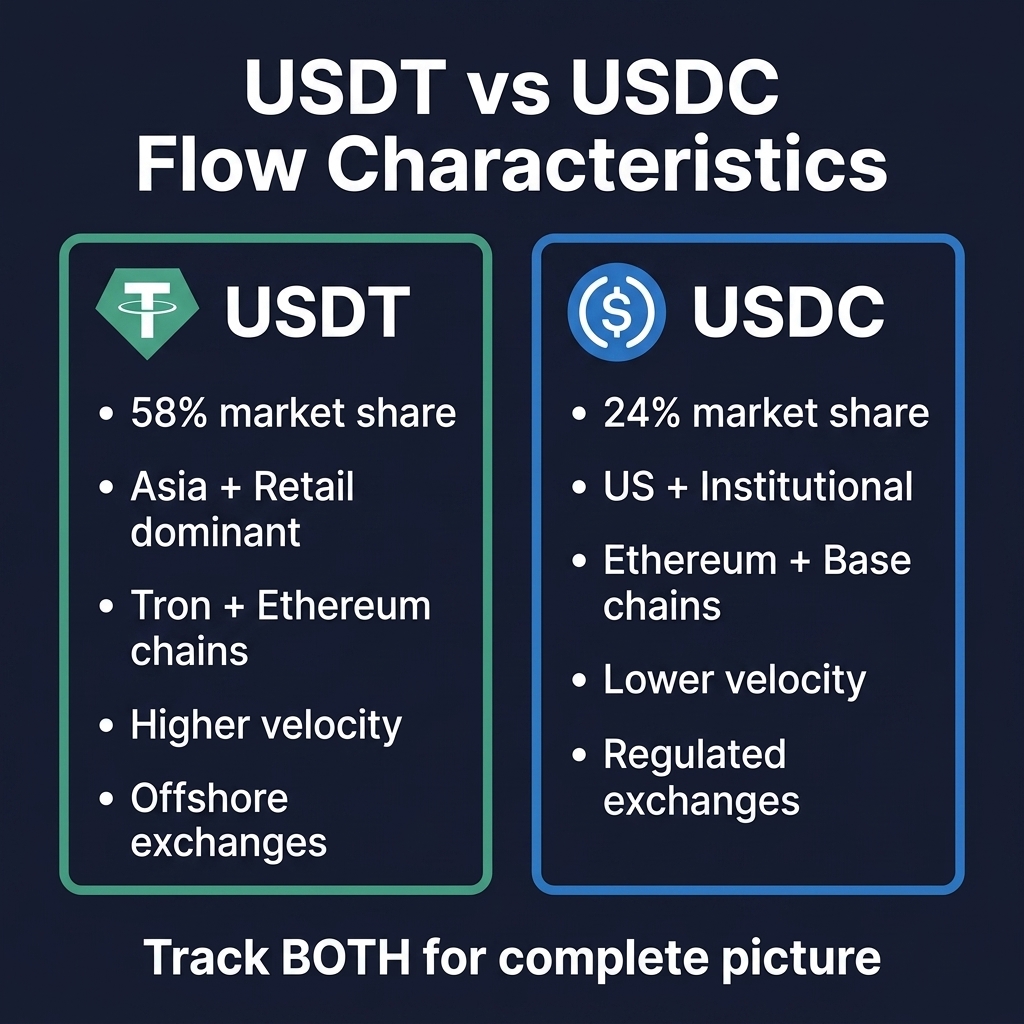
Not all stablecoins carry the same signal. Understanding the difference between USDT and USDC flow reveals who is moving capital:
Characteristic
USDT (Tether)
USDC (Circle)
Market share
~58% ($190B)
~24% ($77B)
Primary market
Asia, Middle East, offshore
United States, Europe
Primary users
Retail traders, OTC desks
Institutional, regulated entities
Primary chains
Tron (60%), Ethereum (30%)
Ethereum (50%), Base (20%)
Velocity
Higher (active trading)
Lower (treasury/settlement)
Signal meaning
Retail/Asia demand gauge
US institutional demand gauge
Trading insight: When USDC minting accelerates while USDT is flat, it signals US institutional capital entering. This is a higher-quality bullish signal than USDT growth alone. Conversely, USDT minting without USDC growth suggests retail-driven demand, which is less sustainable.
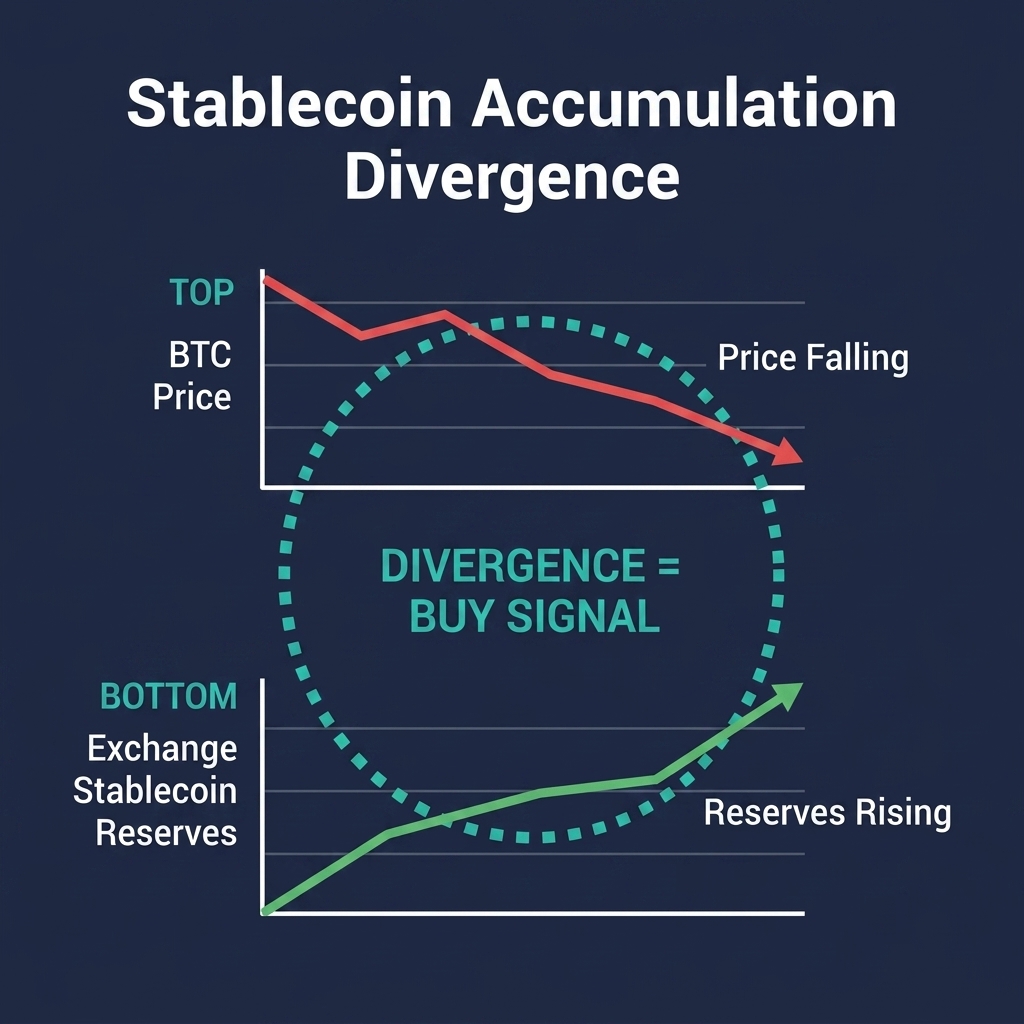
The Stablecoin Accumulation Divergence Strategy
This is the core trading strategy of this chapter. It identifies accumulation phases by detecting divergence between price and stablecoin reserves.
The Setup
Divergence occurs when:
BTC price is falling or flat (market looks weak)
Exchange stablecoin reserves are rising (buyers loading ammunition)
This means smart money is preparing to buy while retail is selling or staying away. The gap between "capital readiness" and "price weakness" is the divergence — and it resolves with a move upward 68% of the time.
Entry Rules
Detect divergence: BTC down 5%+ over 7 days while exchange stablecoin reserves increase 3%+
Velocity confirmation: Stablecoin velocity ticking up from low (parked → deploying transition)
Stop loss: Below the swing low during divergence period
Time stop: Exit after 21 days if target not reached (divergence failed)
Velocity exit: If stablecoin velocity drops back to LOW while in profit, take profit
Strategy Performance Context
This divergence pattern has appeared 6 times in the past 12 months on BTC:
Win rate: 4/6 (67%)
Average win: +12.3%
Average loss: -4.8%
Profit factor: 2.56
Average holding period: 14 days
💡 CoinXSight's On-Chain module displays exchange stablecoin reserve trends. When combined with the Deep Alpha Confluence Score, you can detect this divergence pattern faster than monitoring 5 separate data sources manually. This crypto analytics platform was designed for exactly this kind of multi-dimensional flow analysis.
Mint/Burn Cycles — Reading the Stablecoin Factory
How Minting Works
When Tether Limited mints new USDT, it means someone (usually an OTC desk or institutional client) has deposited fiat currency and requested USDT in return. New stablecoins do not appear from nowhere — they represent real fiat entering the crypto ecosystem.
Minting signals:
Large mint event ($500M+): Major institutional demand. Very bullish signal. BTC typically responds within 3-7 days.
Consistent small mints ($50-200M/day): Steady demand growth. Gradual price support.
Mints going to exchanges: Capital heading directly to trade. More immediately bullish.
Mints going to wallets/DeFi: Capital being parked or seeking yield. Less immediately price-impactful.
How Burning Works
Burns occur when USDT/USDC is redeemed for fiat — someone is exiting the crypto ecosystem entirely.
Burn signals:
Large burn event ($500M+): Major capital exit. Bearish, especially if accompanied by exchange BTC inflows.
Consistent burns over weeks: Sustained capital flight. Structural bear signal.
Burns from exchange wallets: Direct profit-taking and exit. Most bearish.
Burns from DeFi protocols: Yield strategy unwinding. May indicate broader risk-off.
The Mint/Burn Cycle Strategy
Track the 7-day rolling net mint/burn (total minted – total burned):
7-day Net Mint/Burn
Signal
Action
Net Mint > $1B
Major capital inflow
Accumulate BTC aggressively
Net Mint $100M-$1B
Healthy demand
Maintain long positions
Net Mint/Burn near $0
Equilibrium
Neutral — follow other signals
Net Burn $100M-$1B
Capital exiting
Reduce exposure, tighten stops
Net Burn > $1B
Major capital flight
Defensive mode — heavy stablecoin allocation
Exchange Reserve Breakdown — Where Is the Ammunition?
Not all exchanges carry equal signal weight. Stablecoin reserves on different platforms reveal different types of demand:
Exchange
Stablecoin Reserve Character
Signal
Binance
Largest reserves. Mix of retail + institutional. High velocity.
Global demand gauge
Coinbase
US institutional + retail. Lower velocity. USDC dominant.
US demand gauge
OKX
Asia institutional. Growing reserves in 2026.
Asian institutional gauge
Kraken
European retail + institutional.
EU demand gauge
Bybit
Derivatives-heavy. Stablecoins often used as margin.
Leverage demand gauge
Cross-exchange strategy: When Coinbase stablecoin reserves rise while Binance is flat, it signals US-specific demand (often ETF-related). When Binance reserves rise while Coinbase is flat, it signals Asian/retail demand. The highest-conviction bullish signal is when BOTH rise simultaneously — global demand confirmation.
Real-World Example: Stablecoin Flow Analysis — April 2026
In early April 2026, BTC dropped from $85,000 to $76,000 (-10.6%). Many traders panicked. Here is what stablecoin flow data showed:
Entry trigger: BTC closed above 10-day EMA at $77,200 on April 14
CoinXSight Confluence Score: 6/10 → confirmed
April 21-May 15:
BTC rallied from $77,200 to $79,800 (+3.4%)
Stablecoin reserves began depleting (ammunition firing)
Strategy exit: 10-day EMA trailing stop at $78,900
Result: +2.2% gain in 22 days. Modest, but the point is: the divergence signaled the bottom while price was still falling. The trader who watched stablecoin reserves knew the panic was a buying opportunity.
Real Example — USDT Mint Surge Before BTC Rally (March 2026)
Tether minted $2.1B USDT over 5 days in mid-March 2026 while BTC
traded sideways at $98,500. CoinXSight's stablecoin flow dashboard
showed the SSR dropping from 14.2 to 11.8 — indicating growing
buying power relative to BTC's market cap. Within 12 days, BTC
broke out to $107,200 (+8.8%). The stablecoin velocity metric on
CoinXSight confirmed capital was actively moving to exchanges, not
sitting idle in wallets.
Calculate current SSR (BTC market cap ÷ stablecoin market cap)
Note USDT vs USDC mint/burn events (via Whale Alert or Tether transparency page)
Update your divergence watchlist — is price diverging from reserves?
Alert Setup
Exchange stablecoin reserves increasing 3%+ in 7 days → Potential accumulation
Large USDT/USDC mint ($500M+) → Institutional demand
Stablecoin velocity rising from low → Deployment beginning
Combine CoinXSight's flow tools with a disciplined stablecoin monitoring routine to detect accumulation setups before they appear on any crypto exchange price chart. This crypto portfolio tracker approach gives you the edge of seeing buyer ammunition before the shots are fired.
Earn while you wait: Park stablecoins in DeFi lending protocols to earn staking rewards while monitoring flow signals. Some protocols offer 5-8% APY on USDC, turning your dry powder into a yield-generating crypto wallet position.
FAQ
What is the best free tool to track stablecoin supply?
DefiLlama's stablecoin dashboard (defillama.com/stablecoins) provides real-time market cap, chain distribution, and mint/burn data for all major stablecoins. CoinGlass tracks exchange stablecoin reserves. For whale-level transfers, Whale Alert on X/Twitter posts large stablecoin movements. CoinXSight's On-Chain module integrates exchange reserve data with broader flow analysis on the crypto analytics platform.
Does rising stablecoin market cap always mean crypto will go up?
Not always. Rising stablecoin market cap confirms new capital entering the ecosystem, but that capital may sit idle for weeks or months before deploying into volatile assets. The velocity is more important than the total — a $323B stablecoin market with rising velocity is far more bullish than a $400B market with zero velocity. Always check both total supply AND velocity.
How does the SSR compare to other valuation metrics like MVRV?
SSR and MVRV measure different things. SSR measures buying power relative to market size — it tells you whether enough stablecoin ammunition exists to move BTC higher. MVRV measures realized value vs market value — it tells you whether BTC holders are in profit or loss. They are complementary: low SSR + low MVRV = maximum buying opportunity (capital exists AND holders are underwater). Use both on your crypto portfolio tracker.
Why did stablecoin market cap stop growing in 2026?
Several factors: 1) Regulatory uncertainty (GENIUS Act in the US, MiCA in Europe) has caused issuers to be cautious about rapid minting. 2) Institutional capital now enters crypto via ETFs, bypassing stablecoins entirely. 3) Stablecoins are increasingly used for payments and settlements rather than crypto exchange trading, meaning supply growth no longer correlates 1:1 with crypto market demand.
Can I use stablecoin flow analysis for altcoins?
Yes, but with a different approach. For altcoins, focus on exchange-specific stablecoin reserves rather than total market cap. When stablecoins accumulate on exchanges that list a specific altcoin (e.g., stablecoin reserves rising on an exchange where a new token launched), it can signal incoming buying pressure for that specific asset. CoinXSight's Discovery module helps identify tokens with positive stablecoin flow correlations.
Disclaimer: This article is for educational and informational purposes only and does not constitute financial, investment, or trading advice. Cryptocurrency markets are highly volatile and involve substantial risk of loss. No trading strategy guarantees profits — paper-trade or demo-trade before risking real capital. Always conduct your own research (DYOR) and consult a licensed financial advisor before making any investment decisions. CoinXSight provides analytical tools and data — not investment recommendations.