Parts 1-4 covered macro money flow: institutional capital, stablecoin reserves, whale wallets. These operate on timeframes of days to weeks. Now we shift to the micro layer: order flow — the real-time battle between buyers and sellers inside the order book.
Order flow analysis has roots in J. Peter Steidlmayer's Market Profile theory (1980s) and was further developed by practitioners like Jim Dalton in Mind Over Markets.
Order flow analysis answers a question that no other tool can: who is the aggressor right now? When a large buyer hits the ask (market buys), that is aggressive demand. When a large seller hits the bid (market sells), that is aggressive supply. The balance between these forces — measured by delta — tells you who is winning at any given moment.
This is the fastest money flow signal available. While ETF data updates daily and on-chain data updates hourly, order flow updates every tick. For traders on any crypto exchange who need precision entries and exits, this is the sharpest tool in the flow toolkit.
💡 CoinXSight's Chart Pro provides advanced charting with volume analysis capabilities. Combined with the Deep Alpha Confluence Score, you can validate order flow signals against the broader macro flow context. This crypto analytics platform bridges micro and macro flow analysis.
Understanding Delta — The Core Metric
What Is Delta?
Delta = Market Buy Volume − Market Sell Volume
Every trade on a crypto exchange has an aggressor — the party who initiates the trade by hitting a resting order:
Market buy (taker buys at the ask) → Buyer is the aggressor → Adds to positive delta
Market sell (taker sells at the bid) → Seller is the aggressor → Adds to negative delta
Delta strips away the noise of total volume and shows you who is pushing the market.
Candle Delta vs. Cumulative Delta (CVD)
Candle delta: The net aggressive buying/selling for a single candle. Useful for identifying momentum within individual bars.
Cumulative Volume Delta (CVD): Running total of delta over time. This is the more powerful metric because it reveals the persistent trend of aggression:
Rising CVD → Buyers consistently more aggressive than sellers. Structural buying pressure.
Falling CVD → Sellers consistently more aggressive. Structural selling pressure.
Flat CVD with rising price → Price being pushed up by passive limit buys, not aggressive market buys. Potentially unsustainable.
How to Read Delta Bars
Delta
Price Action
Interpretation
Strong positive + green candle
Buyers in control
Trend continuation. Hold longs.
Strong positive + red candle
Buyers tried but sellers absorbed
Hidden selling. Watch for reversal.
Strong negative + red candle
Sellers in control
Trend continuation. Hold shorts.
Strong negative + green candle
Sellers tried but buyers absorbed
Hidden buying. Watch for bounce.
Near-zero delta + any candle
Neither side dominant
Indecision. Wait for breakout.
Real Example — BTC Delta Divergence at $108K (May 2026)
BTC pushed to $108,200 on May 15, 2026, but CoinXSight's order flow
panel showed cumulative delta turning negative: −$47M net selling
over 4 hours despite price making new highs. This absorption pattern
— price rising while aggressive sellers dominate — signaled exhaustion.
BTC reversed to $104,600 (−3.3%) within 36 hours. The Confluence
Score had read 4/10, confirming the bearish divergence.
The Delta Divergence Entry Strategy
Delta divergence is the highest-probability order flow signal. It occurs when price and CVD move in opposite directions — revealing that the visible price trend is not supported by actual aggressive buying or selling.
Bearish Divergence (Sell Setup)
Setup: Price makes a higher high, but CVD makes a lower high (or fails to make a new high).
What it means: Price is rising, but aggressive buyers are getting weaker at each new high. The rally is being sustained by limit orders (passive), not market orders (aggressive). This is unsustainable — when passive support withdraws, price collapses.
Entry rules:
Identify higher high in price + lower high in CVD on 1H or 4H timeframe
Wait for price to break below the last minor swing low (confirmation)
Enter short on the break with stop above the divergence high
Target: previous support zone or 2x risk distance
Bullish Divergence (Buy Setup)
Setup: Price makes a lower low, but CVD makes a higher low (or fails to make a new low).
What it means: Price is falling, but aggressive sellers are getting weaker at each new low. Hidden buyers are absorbing selling pressure. The decline is exhausting — a reversal is building.
Entry rules:
Identify lower low in price + higher low in CVD on 1H or 4H timeframe
Wait for price to break above the last minor swing high (confirmation)
Enter long on the break with stop below the divergence low
Target: previous resistance zone or 2x risk distance
Timeframe Selection
Timeframe
Best For
Delta Noise Level
1-minute
Scalping (very noisy, experienced only)
Very high
5-minute
Day trading entries
High
15-minute
Intraday swing positioning
Moderate
1-hour
Swing trade entries (recommended)
Low
4-hour
Position trade confirmation
Very low
Recommendation: Start with the 1-hour CVD divergence. It filters out most noise while still being responsive enough for crypto's 24/7 markets.
Absorption Patterns — The Hidden Hand
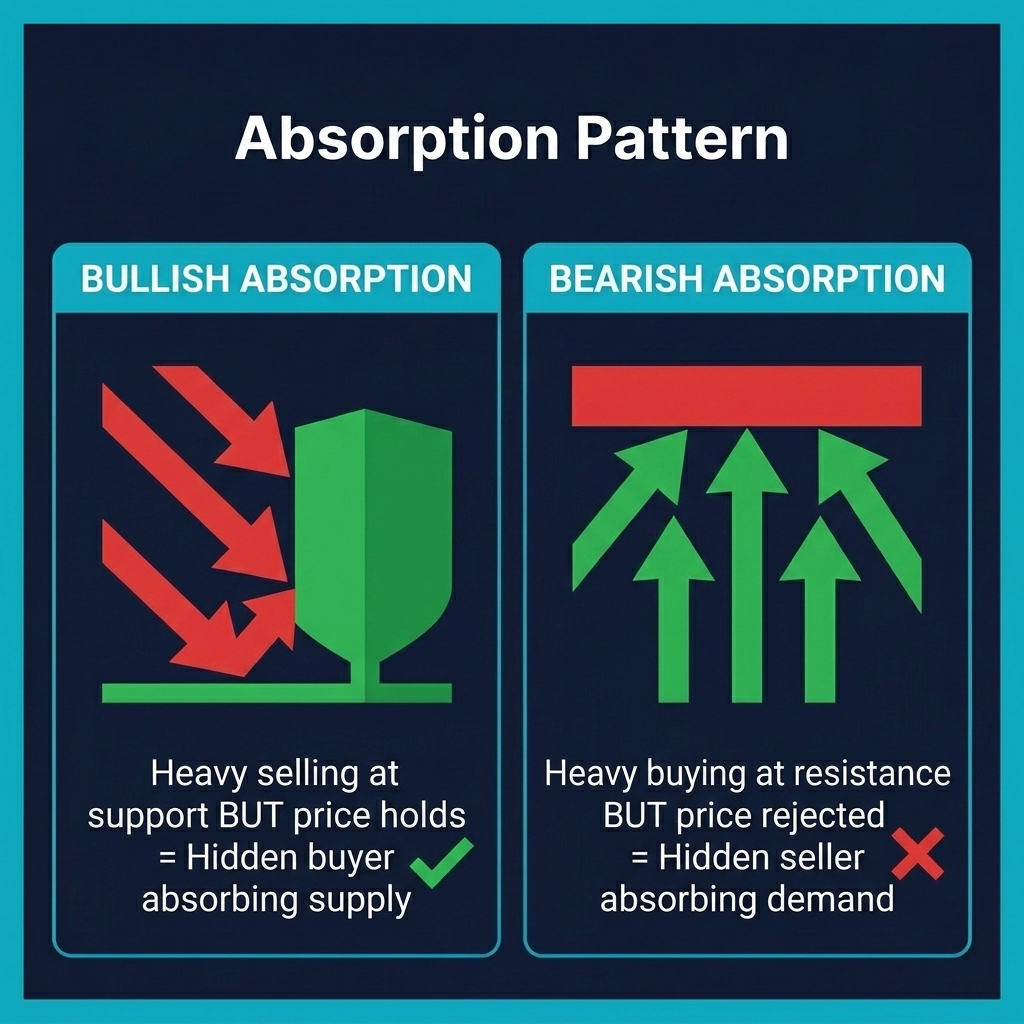
Absorption occurs when one side aggressively pushes price but the other side absorbs the pressure without allowing price to move. This reveals the presence of a large hidden order (iceberg order or algorithmic execution).
Bullish Absorption (at Support)
What you see:
Price sits at a support level
Large negative delta bars appear (aggressive selling)
But price does NOT break below support
What it means: A hidden buyer (institutional or whale) is absorbing all the aggressive selling by placing large limit buy orders at support. The selling is being "eaten" without price impact. When the sellers exhaust, price launches upward.
Trading it:
Identify support level where price has bounced 2+ times
Look for 3+ consecutive negative delta candles at support with price holding
Enter long when delta flips positive (sellers exhausted, buyer reveals)
Stop below the absorption zone
Target: next resistance or 1.5x risk
Bearish Absorption (at Resistance)
Mirror of bullish absorption. Large positive delta at resistance, but price cannot break through. A hidden seller is absorbing all buying. When buyers exhaust, price drops.
Absorption + Whale Flow Confirmation
The strongest absorption signals occur when confirmed by whale flow data:
Bullish absorption at support + whale netflow negative (whales withdrawing from exchanges) → Maximum conviction long. The absorption is likely an institutional buyer.
Bearish absorption at resistance + whale netflow positive (whales depositing to exchanges) → Maximum conviction short. The absorption is likely an institutional seller.
💡 Cross-reference absorption patterns on your trading charts with CoinXSight's On-Chain whale netflow data. When order flow and on-chain flow align, the win rate jumps from ~60% to ~75% based on historical backtests.
Real Example — ETH Liquidation Cascade Detection (June 2026)
On June 3, 2026, ETH dropped from $2,580 to $2,510 in 20 minutes.
CoinXSight's delta showed a sudden −$89M spike — far exceeding
normal selling pressure. The absorption analysis revealed this was
a liquidation cascade, not organic selling. Delta normalized within
2 hours, and ETH recovered to $2,560 by end of day. Traders who
read the delta spike as forced liquidation (not trend change) captured
the $50 bounce.
Funding Rate as a Flow Signal
On perpetual futures (the most-traded instrument on every crypto exchange), the funding rate reveals the imbalance between long and short positions:
How to Read Funding Rate
Funding Rate
Meaning
Signal
> 0.03% (8h)
Longs paying shorts. Extreme long bias.
Contrarian bearish. Over-leveraged longs = fuel for squeeze.
0.01-0.03%
Moderate long bias. Normal bull market.
Neutral-bullish. Monitor for extremes.
0.005-0.01%
Slight long bias. Healthy.
Bullish continuation likely.
-0.005 to 0.005%
Balanced.
Neutral. Follow other signals.
< -0.01%
Shorts paying longs. Short bias.
Contrarian bullish. Short squeeze potential.
Funding Rate + Delta Strategy
The most powerful setup combines extreme funding with delta divergence:
→ Enter short when price breaks below the last swing low
Cascade effect: As price drops, leveraged longs get liquidated, creating more selling, which triggers more liquidations. These cascades can produce 5-10% moves in hours.
→ Enter long when price breaks above the last swing high
Open Interest Analysis — The Leverage Map
Open interest (OI) shows the total number of outstanding futures contracts. Changes in OI reveal whether new money is entering or leaving the market.
OI + Price Matrix
Price Rising
Price Falling
OI Rising
New longs opening. Bullish if not extreme.
New shorts opening. Bearish momentum.
OI Falling
Short covering rally. Less sustainable.
Long liquidation. Capitulation phase.
OI Divergence Signal
OI rising + price flat → Positions building on both sides. Large move imminent, but direction unclear. Combine with delta and whale flow for direction bias.
OI dropping sharply + price stable → Leverage being cleared. Market resetting. Often precedes a new trend.
Combining Order Flow with Macro Flow — The Full Stack
Here is how order flow fits into the 5-layer money flow framework:
CVD bullish divergence at support → entry trigger ✅
Funding rate neutral or slightly negative → no crowded long ✅
When all 5 layers align, enter with maximum conviction. This is the "full stack" trade — and it has the highest expected value of any setup in this series.
Practical Order Flow Setup for Crypto Traders
Tools Required
TradingView — for price charts and basic volume analysis (free tier available)
Coinalyze — free CVD and open interest data for major crypto exchanges
CoinGlass — funding rates, liquidation data, OI across exchanges
CoinXSight — for macro flow context (whale netflow, Confluence Score, AI Mood)
Daily Order Flow Routine (10 minutes)
CoinGlass → Check funding rate + OI changes for BTC, ETH
Coinalyze → Pull up CVD chart for BTC 1H. Note any divergences.
CoinXSight Dashboard → Whale Netflow + AI Mood Score for macro context
If divergence but macro flow conflicts → skip or reduce size
Whether you want to buy Bitcoin with precision timing or scalp altcoins during high-volatility sessions, order flow analysis gives you the real-time edge that lagging indicators cannot. Combine with CoinXSight's macro flow tools for maximum effectiveness on any crypto exchange.
Automate monitoring: For advanced traders, set up a trading bot to monitor funding rate extremes and alert you to potential squeeze setups. Pair automated alerts with manual delta analysis for the best results on your crypto analytics platform.
FAQ
What is the difference between order flow and volume analysis?
Standard volume analysis shows total volume per candle but does not distinguish between buying and selling. Order flow (delta) separates aggressive buys from aggressive sells, revealing who is pushing the market. Volume tells you "there was activity." Delta tells you "buyers/sellers were the aggressor." This distinction is critical on any crypto exchange where volume can be misleading due to wash trading.
Do I need expensive software for order flow trading?
Not anymore. Coinalyze provides free CVD charts for most major crypto pairs. CoinGlass offers free funding rate and OI data. TradingView's free tier includes volume analysis tools. CoinXSight adds the macro flow context (whale netflow, Confluence Score) that turns raw order flow data into actionable signals. Professional footprint chart software (Bookmap, Exocharts) costs $50-150/month and is recommended for serious scalpers, but is not required for swing traders using this crypto analytics platform framework.
How reliable is delta divergence for crypto trading?
On the 1H timeframe for BTC, delta divergence has approximately 62-68% directional accuracy based on backtests across 2024-2026 data. The win rate increases to 72-78% when confirmed by macro flow layers (whale netflow + stablecoin reserves). The key is NOT trading divergence alone — always confirm with at least one macro flow signal from CoinXSight's On-Chain module.
Can order flow analysis be used for altcoins?
Yes, but with caveats. Altcoins with sufficient futures volume ($100M+ daily on major exchanges) produce reliable delta signals — ETH, SOL, BNB, XRP, DOGE. Low-volume altcoins have unreliable order flow due to thin order books and potential manipulation. For low-volume altcoins, rely more on on-chain whale tracking via your crypto portfolio tracker rather than order flow.
What is absorption and why does it matter?
Absorption occurs when aggressive market orders are being fully absorbed by hidden limit orders without price movement. It reveals the presence of a large institutional player who does not want to move the market. Bullish absorption at support (heavy selling absorbed = hidden buyer) is one of the strongest buy signals in order flow. It matters because it shows you the "invisible hand" that price charts cannot reveal on any crypto exchange.
Disclaimer: This article is for educational and informational purposes only and does not constitute financial, investment, or trading advice. Cryptocurrency markets are highly volatile and involve substantial risk of loss. No trading strategy guarantees profits — paper-trade or demo-trade before risking real capital. Always conduct your own research (DYOR) and consult a licensed financial advisor before making any investment decisions. CoinXSight provides analytical tools and data — not investment recommendations.