Why Sector Rotation Is Where the Big Money Is Made
Parts 1-5 focused primarily on BTC-level flow analysis. But the biggest percentage gains in crypto come from being in the right sector at the right time. In the 2024-2026 cycle, traders who rotated from BTC → AI tokens → Solana DeFi → RWA protocols captured 5-10x more return than BTC holders. Sector rotation is a well-established investment strategy — and in crypto, the rotations are faster and more dramatic.
Sector rotation in crypto follows a predictable pattern: capital flows from safety (BTC/stablecoins) into progressively riskier sectors as confidence builds. Understanding where you are in this rotation cycle — and where capital is flowing next — is the key to outperforming.
💡 CoinXSight's Deep Alpha module tracks sector-level flow signals across multiple chains. The Discovery feature identifies tokens with rising TVL, whale accumulation, and narrative momentum — exactly the data this chapter teaches you to interpret.
The 2026 Crypto Sector Rotation Map
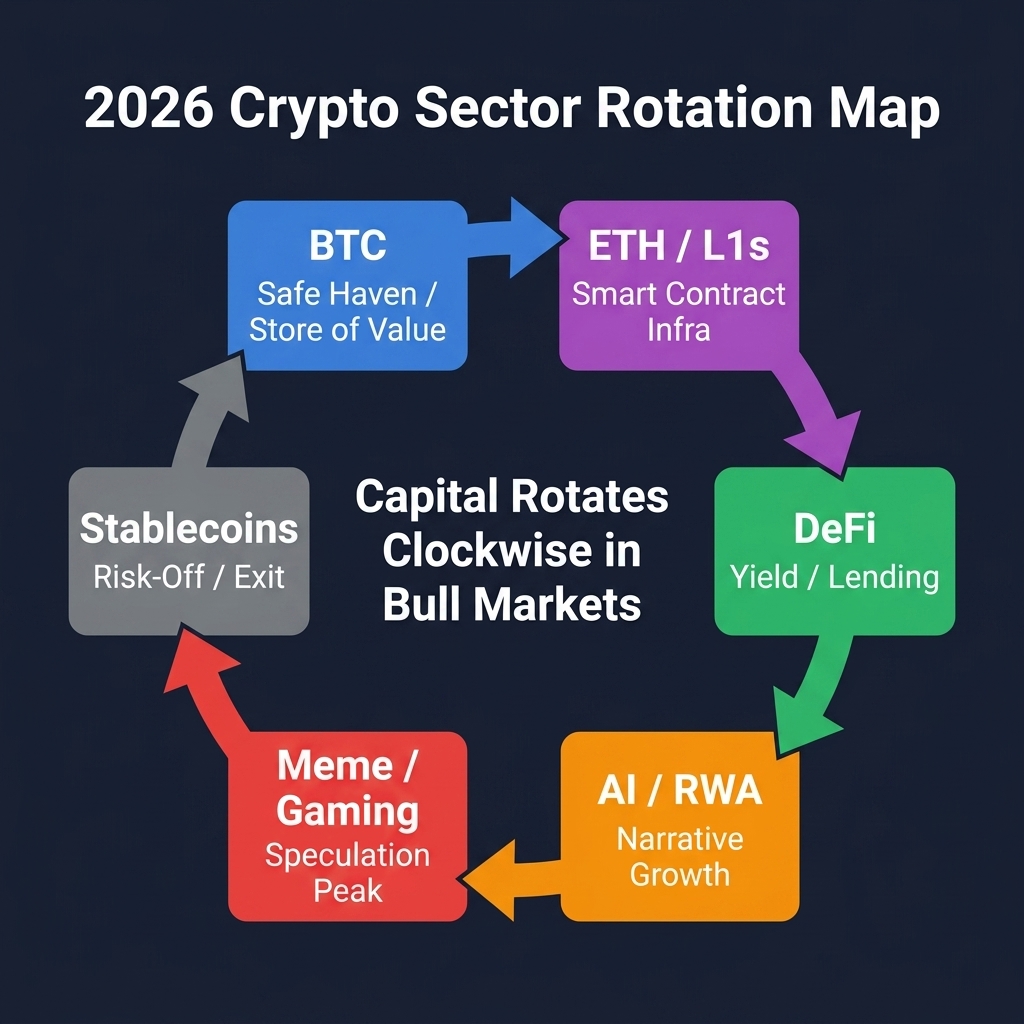
In bull markets, capital rotates clockwise through these sectors:
Characteristics: Institutional buying via ETFs, whale accumulation, flat altcoin markets. BTC dominance rising. Capital entering the ecosystem parks in BTC first.
Duration: 2-6 months
Current state (May 2026): Late Phase 1 — BTC has rallied but alts have not fully caught up.
Phase 2: ETH & L1 Rotation
Characteristics: After BTC stabilizes at new highs, capital rotates to ETH and competing L1s (Solana, Avalanche, Sui). ETH/BTC ratio rises. L1 tokens outperform BTC.
Key signal: ETH ETF inflows accelerating while BTC ETF inflows slow down.
Phase 3: DeFi & Yield
Characteristics: Capital deployed into DeFi protocols seeking yield — lending, staking, liquidity provision. TVL rising across major protocols. Staking rewards become a major draw.
Key signal: Rising TVL + falling DeFi yields (compression = high demand for yield).
Phase 4: Narrative Growth (AI, RWA, DePin)
Characteristics: Speculative capital chases the cycle's dominant narrative. In 2024-2025 it was AI tokens. In 2026 it is RWA (Real World Assets) and DePin. These sectors see 5-20x gains for early movers.
Key signal: Rapidly rising TVL on narrative-specific protocols + social media volume spike.
Phase 5: Meme & Speculation Peak
Characteristics: The final rotation. Capital moves into meme coins, low-cap speculation, and newly launched tokens. Extreme social media activity. This is the euphoria phase.
Key signal: When your non-crypto friends start asking about meme coins, the cycle is near its end.
Phase 6: Risk-Off (Back to Stablecoins)
Characteristics: Profit-taking begins. Capital rotates back from risky assets into stablecoins and eventually fiat. TVL drops. Funding rates normalize. BTC dominance rises again as alts bleed.
TVL Flow Signals — The DeFi Dashboard
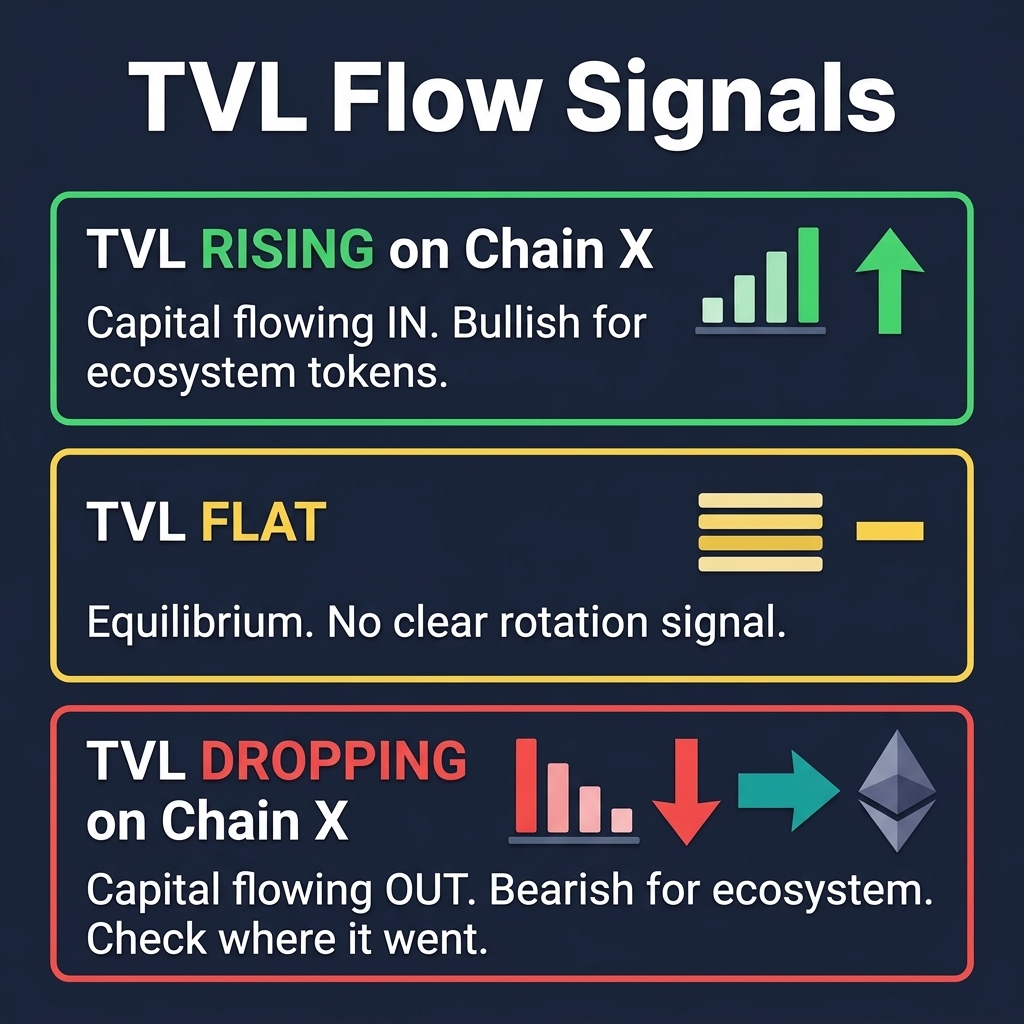
Total Value Locked (TVL) is the most important metric for DeFi sector rotation analysis. It measures actual capital deployed in protocols — not speculative price action.
How to Read TVL Changes
TVL Signal
Meaning
Action
Chain TVL rising 10%+ weekly
Strong capital inflow. Narrative momentum.
Accumulate ecosystem tokens.
Chain TVL flat
Equilibrium. No rotation happening.
Monitor for catalysts.
Chain TVL dropping 10%+ weekly
Capital fleeing. Narrative fading.
Reduce exposure. Look where capital went.
TVL rising on Chain A + dropping on Chain B
Active rotation. Chain A is the target.
Rotate positions accordingly.
Key TVL Data Points (May 2026)
Chain
TVL
30-day Change
Signal
Ethereum
$88B
+2%
Stable — dominant but not growing fast
Solana
$12.4B
+8%
Growing — narrative momentum (DeFi + meme)
Base
$8.9B
+15%
Strong growth — institutional attention
Arbitrum
$6.7B
-3%
Slight outflow — rotation to Base
Sui
$3.2B
+22%
Rapid growth — early rotation signal
Reading this data: Capital is rotating from Arbitrum → Base and discovering Sui. Solana continues to attract capital. Ethereum is stable but not the growth story. A trader following this data would allocate to SOL, BASE, and SUI ecosystem tokens.
Real Example — L2 Rotation from Arbitrum to Base (April 2026)
CoinXSight's sector flow dashboard detected a 23% TVL increase on
Base ($4.2B → $5.2B) while Arbitrum's TVL dropped 11% over 2 weeks
in April 2026. The TVL Change Rate for Base tokens averaged +3.2%/day.
Traders who rotated into AERO (Base's leading DEX token) at $1.42
captured a move to $1.89 (+33%) as the narrative momentum accelerated.
CoinXSight's Deep Alpha flagged AERO with an 8/10 Confluence Score.
Exit: Trailing stop of 20% from peak, or when TVL growth turns negative
Performance Context
Sector rotation trades have historically offered:
Average return: 35-80% per successful rotation (4-12 week holds)
Win rate: ~55% (lower than BTC strategies, but much higher reward)
Key risk: Narratives can die suddenly, causing 30-50% drawdowns
Mitigation: Use strict TVL-based exit rules and CoinXSight smart money tracking
Real Example — AI Narrative Rotation (May 2026)
Following NVIDIA's earnings beat on May 22, 2026, AI-sector crypto
tokens surged. CoinXSight detected capital rotating out of meme tokens
(sector TVL −8.3%) into AI infrastructure tokens (sector TVL +19.2%
in 72 hours). TAO moved from $412 to $487 (+18.2%), RNDR from $11.80
to $13.60 (+15.3%). The rotation was visible on CoinXSight 6 hours
before the price moves materialized on major exchanges.
DeFi Yield as a Flow Indicator
DeFi yields tell you about capital flow dynamics:
The Yield Signal Framework
Yield Level
What It Means
Flow Signal
Yields > 15%
High demand for leverage/borrowing. Risk appetite elevated.
Capital flowing IN aggressively. Late-stage.
Yields 8-15%
Healthy equilibrium. Sustainable demand.
Steady flow. Good environment.
Yields 3-8%
Capital saturation. Too much supply, not enough demand.
Flow slowing. Early exit signal.
Yields < 3%
Capital exodus. DeFi losing appeal vs alternatives.
Flow OUT. Rotate to other sectors.
The Yield Curve Inversion Signal
When short-term lending yields (variable rate) exceed long-term yields (fixed rate), it signals:
Extreme short-term demand for leverage
Traders willing to pay more for immediate borrowing
Often precedes high volatility and potential liquidation cascades
Review bridge volumes on DefiLlama bridges dashboard
CoinXSight Discovery → Filter by "smart money accumulation" for emerging rotation targets
Update sector allocation based on TVL trends and narrative momentum
Check staking rewards rates across protocols — declining yields = rotation signal
Alert Setup
TVL change > 10% in 7 days on any major chain → Rotation signal
Smart money accumulation on new tokens → Narrative opportunity
Bridge volume spike > 2x average → Capital migration in progress
Whether you want to buy Bitcoin as a core position or capture altcoin sector rotation gains, CoinXSight's multi-chain flow tracking gives you visibility into where capital is moving before price reacts on any crypto exchange.
Diversify with yield: While tracking sector rotation, consider allocating a portion to DeFi lending protocols for staking rewards. This turns idle capital in your crypto wallet into active yield while maintaining flexibility to rotate into emerging sectors on your crypto analytics platform.
FAQ
How do I identify the dominant narrative of a crypto cycle?
Track TVL growth acceleration, social media volume, and smart money wallet activity across sectors. The sector with the fastest-growing TVL + most smart money accumulation + rising social attention is the dominant narrative. In 2026, RWA (Real World Assets) and AI infrastructure are showing these characteristics. Check CoinGecko for token-level market data and CoinXSight's Discovery module to quantify narrative momentum through its crypto portfolio tracker signals.
Is sector rotation riskier than holding BTC?
Yes — significantly. Individual sectors can drop 50-70% when narratives fade, while BTC typically corrects 20-35%. However, successful rotation trades offer 35-80%+ returns vs BTC's 20-40% per cycle. The key is strict position sizing (10-15% per rotation trade), TVL-based exit rules, and diversification across 3-4 sectors simultaneously.
What is the best free tool for tracking DeFi TVL?
DefiLlama is the gold standard. It tracks TVL across 200+ chains and 3,000+ protocols with historical data, bridge volumes, and yield information. For token price and market cap data, CoinGecko is the leading reference. For sector-level analysis with integrated flow signals, CoinXSight adds smart money tracking and narrative momentum scoring on the crypto analytics platform.
How long does a typical sector rotation last?
In the 2024-2026 cycle, individual sector rotations have lasted 4-12 weeks at their peak growth phase. The full cycle rotation (BTC → L1s → DeFi → Narrative → Meme → Risk-off) typically spans 6-18 months. Timing varies based on macro conditions — faster rotations in strong bull markets, slower in uncertain conditions.
Can I use sector rotation for DeFi yield farming?
Absolutely. Rotate your stablecoin yield farming to chains and protocols with rising TVL — these typically offer higher yields to attract capital. As a sector matures and yields compress, rotate to the next emerging chain. This "yield rotation" strategy combines sector rotation timing with staking rewards optimization for your crypto wallet.
Disclaimer: This article is for educational and informational purposes only and does not constitute financial, investment, or trading advice. Cryptocurrency markets are highly volatile and involve substantial risk of loss. No trading strategy guarantees profits — paper-trade or demo-trade before risking real capital. Always conduct your own research (DYOR) and consult a licensed financial advisor before making any investment decisions. CoinXSight provides analytical tools and data — not investment recommendations.