Master stablecoin flow analysis for crypto trading. Learn how USDT, USDC, and DAI movements between exchanges and wallets predict market direction before price moves.
DP
David ParkChief On-Chain Data Analyst·May 19, 2026 · 10 min read · Updated Oct 6
Why Stablecoin Flows Are the Most Underrated Market Signal
Most traders obsess over BTC and ETH exchange flows. But stablecoin flows — the movement of USDT, USDC, DAI, and other dollar-pegged tokens — are arguably a more powerful leading indicator because they directly measure buying power entering or exiting the market.
The logic is simple:
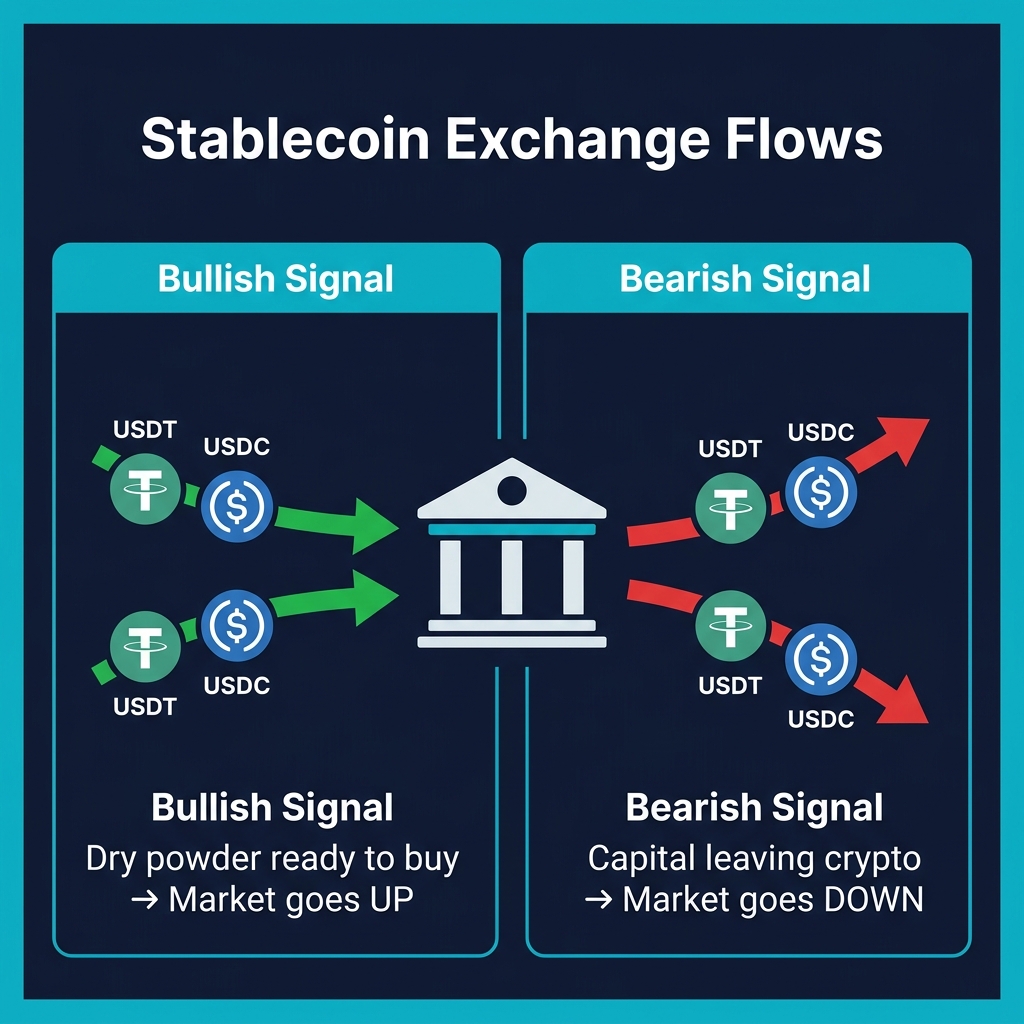
When stablecoins flow INTO exchanges, someone is preparing to buy crypto. This is dry powder being loaded.
When stablecoins flow OUT OF exchanges, capital is leaving the crypto trading environment. There's less buying power available.
When stablecoin total supply increases (minting), new money is entering the crypto ecosystem.
When stablecoin supply decreases (burning/redemption), money is leaving.
Unlike BTC exchange flows (which measure sell-side pressure), stablecoin flows measure buy-side intent. This makes them uniquely predictive — they show you where the demand is before it hits the order book.
The Stablecoin Ecosystem in 2026
Major Stablecoins by Market Impact
Stablecoin
Market Cap
Primary Use
Signal Reliability
USDT (Tether)
$145B+
Global trading, OTC, emerging markets
Highest — largest volume
USDC (Circle)
$55B+
Institutional, DeFi collateral, US regulated
High — institutional proxy
DAI (MakerDAO)
$8B+
DeFi-native, decentralized
Moderate — DeFi-specific signal
FDUSD
$4B+
Binance ecosystem
Moderate — Binance-specific
USDe (Ethena)
$6B+
Yield-bearing, delta-neutral strategy
Moderate — yield appetite signal
Why USDT flows matter most: USDT handles over 60% of all crypto trading volume globally. When USDT moves, markets follow. USDC flows are the second most important signal, particularly for institutional activity since it's the preferred stablecoin for regulated entities.
The 3 Stablecoin Metrics That Predict Market Direction
Metric 1: Exchange Stablecoin Reserves
This measures the total amount of stablecoins sitting on centralized exchanges, ready to be deployed into crypto purchases.
How to read it:
Reserve Trend
Duration
Signal
Action
Reserves increasing
7+ days
Buying power accumulating
Bullish — prepare for rally
Reserves stable
—
Equilibrium
Neutral — no clear direction
Reserves decreasing
7+ days
Buying power draining
Bearish — reduce exposure
Sudden spike
1-2 days
Large buyer arrived
Very bullish — immediate catalyst
Sudden drop
1-2 days
Capital flight
Very bearish — possible panic
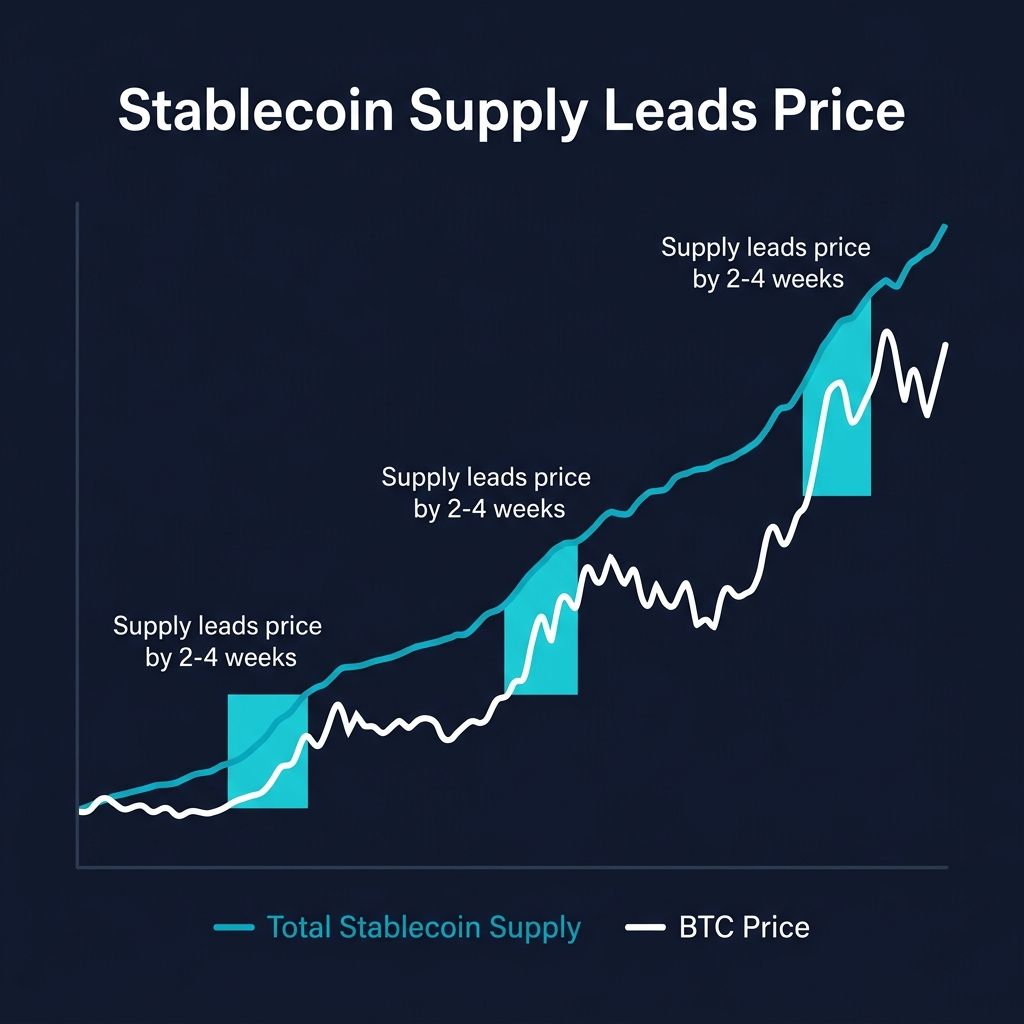
Historical accuracy: Before every major BTC rally in 2023-2026, exchange stablecoin reserves showed sustained increases for 2-4 weeks prior. This indicator led price by an average of 14 days.
New USDT or USDC being minted means fresh capital is entering the crypto ecosystem. Redemptions (burning) mean capital is leaving.
USDT mint events are particularly significant:
Tether typically mints in $500M-$1B batches
Large mints correlate with incoming institutional demand
The capital usually hits exchanges within 3-7 days of minting
Historically, BTC price increases 8-15% within 30 days of major USDT mints
Tracking minting events:
Bullish: USDT mints $1B → Flows to exchanges within 5 days →
         Exchange stablecoin reserves increase →
         Buying pressure mounts → Price rises

Bearish: USDC redemptions accelerate → Total supply declining →
         Capital exiting crypto → Less buying power available →
         Price stalls or falls
Metric 3: Stablecoin Dominance (% of Total Market Cap)
Stablecoin dominance measures what percentage of total crypto market cap is held in stablecoins. Think of it as the market's "cash position."
Dominance Level
Interpretation
Market Phase
Below 5%
Almost everyone is deployed
Late bull market — reversal risk HIGH
5-8%
Healthy deployment
Active bull market
8-12%
Moderate cash positions
Cautious market — waiting for direction
12-15%
Heavy cash positions
Bear market or pre-recovery accumulation
Above 15%
Maximum cash
Deep bear market — potential bottom
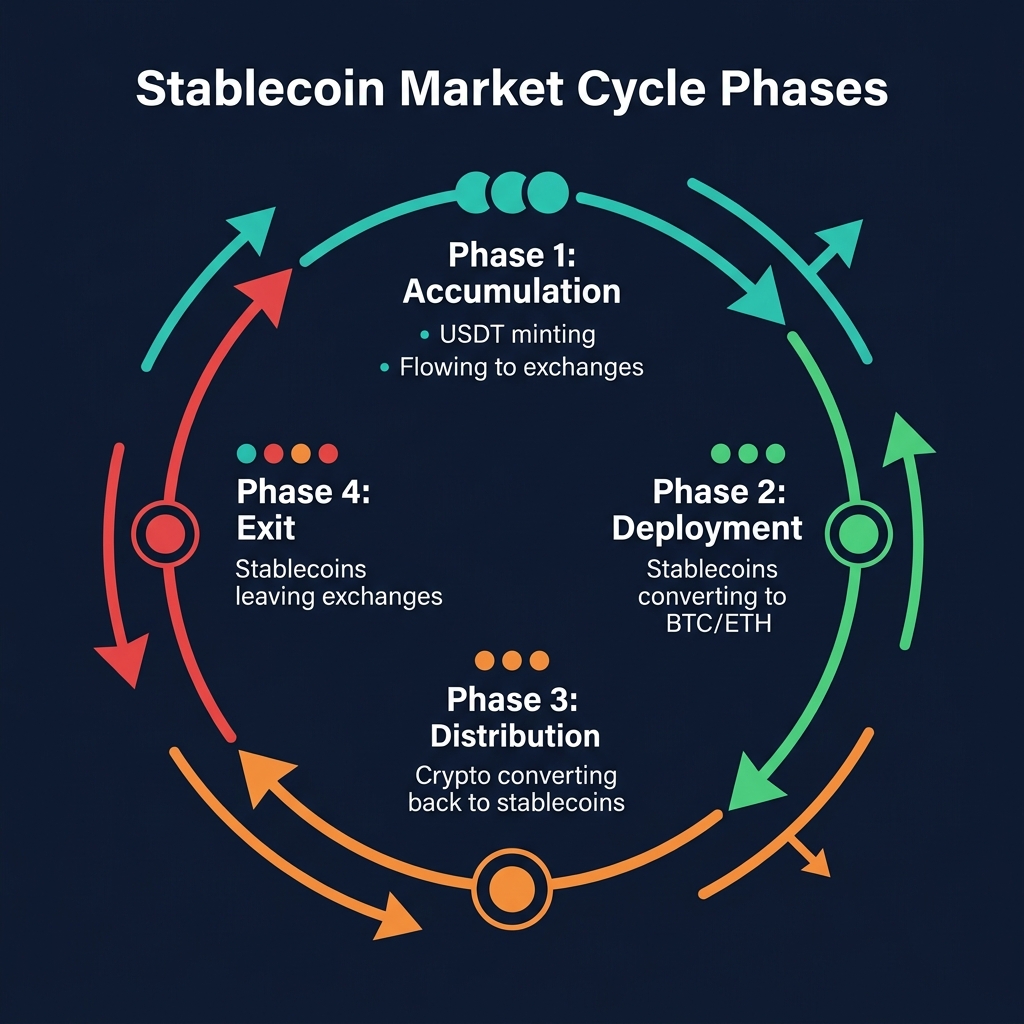
The cycle: Stablecoin dominance decreases during rallies (people convert stables to crypto) and increases during corrections (people sell crypto back to stables). Extreme low dominance often signals market tops; extreme high dominance signals bottoms.
Stablecoin Flow Trading Strategies
Strategy 1: The Dry Powder Anticipation Trade
Signal: Exchange stablecoin reserves increase by 5%+ over 7 days while BTC price remains flat or slightly declining.
Thesis: Large buyers are staging capital on exchanges. They haven't deployed yet, but the buying power is loaded and ready.
Entry:
Monitor CoinXSight's Dashboard for stablecoin reserve trends
When reserves reach a 30-day high AND price is at support, enter long
Stop-loss: Below the support level where you entered
Target: Previous resistance level or 10-15% upside (based on historical mint-to-rally performance)
Win rate: Historically 65-70% when combined with technical support confirmation
Strategy 2: The Supply Shock Monitor
Signal: USDT mints $500M+ in a single event.
Thesis: Large minting events indicate incoming institutional demand. The newly minted USDT will hit exchanges within 3-7 days and be deployed into crypto purchases.
Workflow:
Track USDT treasury addresses for large outflows (minting events)
After a mint, wait 2-3 days for the USDT to reach exchanges
Monitor exchange stablecoin reserves for the corresponding increase
Enter long positions when the reserves spike appears
Set a 30-day holding period (average time for mint impact to play out)
Why it works: Tether doesn't mint speculatively. Large minting events are typically preceded by institutional OTC demand. The institution has already committed to buying — the question is not IF but WHEN the deployment occurs.
Combining Stablecoin Flows with CoinXSight Modules
The Liquidity Stack
The most powerful setup combines multiple CoinXSight data points with stablecoin analysis:
Layer 1: Stablecoin Analysis (Macro — Is money entering the market?)
  - Exchange reserves trending up? ✅
  - Recent minting events? ✅
  - Dominance at reasonable level (5-12%)? ✅

Layer 2: Exchange Flow Analysis (Token-specific — Is BTC/ETH accumulating?)
  - Net BTC exchange flow negative (outflows)? ✅
  - No large whale deposits to exchanges? ✅

Layer 3: Alpha Hunter Signals (Trade-specific — Which token, which direction?)
  - ASI Score ≥ 65? ✅
  - Confluence Score ≥ 60? ✅
  - Market structure bullish? ✅

Layer 4: Chart Pro (Execution — When exactly to enter?)
  - Order Flow supportive? ✅
  - Entry at VWAP or EMA support? ✅

→ ALL GREEN = Maximum conviction trade
Common Mistakes in Stablecoin Analysis
1. Confusing DeFi Flows with Exchange Flows
Stablecoins moving from exchanges to DeFi protocols (lending, LPing) are not bearish — they're just moving to a different deployment venue. Only stablecoins leaving the entire crypto ecosystem (off-ramping to fiat) represent genuine capital flight.
2. Ignoring Stablecoin-Specific Events
USDC depegging to $0.87 during the SVB banking crisis (March 2023) created massive stablecoin flows that had nothing to do with crypto market sentiment. Always check if unusual stablecoin movements are caused by stablecoin-specific events rather than market sentiment shifts.
3. Over-Indexing on Single Minting Events
Not every USDT mint leads to a rally. Some mints serve inventory replenishment for exchanges, chain swaps (USDT on Ethereum → USDT on Tron), or liquidity provisions. Look for patterns of sustained minting, not isolated events.
4. Timing the Impact Too Precisely
Stablecoin signals are leading indicators with variable lag. A USDT mint might impact prices in 3 days or 30 days. Use stablecoin analysis for directional bias, not precise entry timing. Combine with CoinXSight's real-time signals for entry execution.
Frequently Asked Questions
How far ahead do stablecoin flows predict price movement?
On average, major stablecoin flow signals lead price by 7-21 days. Exchange reserve changes are the fastest (3-7 days). Minting/burning events have a longer lag (14-30 days). Dominance extremes are the slowest but most reliable (30-90 days).
Are USDT flows more reliable than USDC flows?
USDT flows capture more global trading activity (including unregulated and OTC markets). USDC flows are a better proxy for US institutional activity. For overall market direction, USDT is more reliable. For institutional sentiment specifically, USDC provides more signal.
Can stablecoin analysis work for altcoins?
Stablecoin flows primarily predict BTC and overall market direction. For specific altcoins, combine stablecoin macro analysis (is money flowing into crypto?) with token-specific metrics from CoinXSight's Discovery module and Confluence scoring.
Where can I track stablecoin flows?
CoinXSight's on-chain modules track exchange flows including stablecoin movements. For stablecoin-specific data, platforms like DefiLlama (stablecoin supply tracking) and Glassnode (exchange reserves) provide granular data. The most actionable approach is combining CoinXSight's integrated analysis with periodic manual review of supply trends.
Do yield-bearing stablecoins affect this analysis?
Partially. USDe (Ethena) and other yield-bearing stablecoins move between exchanges and yield protocols based on yield differentials, not buying intent. When analyzing flows, focus on USDT and USDC for market direction signals, and treat yield-stablecoin flows as noise.
Summary
Stablecoin flows are the crypto market's "money flow" indicator — they tell you whether fresh capital is entering the market (bullish), deploying into positions (immediately bullish), or exiting (bearish). Unlike BTC exchange flows that measure sell-side pressure, stablecoin flows measure buy-side preparation and capacity.
The three critical metrics are exchange reserves (short-term buying power), supply changes (medium-term capital inflow), and dominance (long-term market positioning). Together, they create a multi-timeframe liquidity picture that can anticipate major market moves by weeks.
Integrate stablecoin analysis as the first macro layer in your trading system, then use CoinXSight's token-specific modules for trade selection and execution.
Key takeaways:
Stablecoin exchange reserves increasing = buying power loading → bullish
USDT minting events historically precede BTC rallies by 14-30 days
Stablecoin dominance extremes (<5% or >15%) signal major turning points