Market Microstructure & Dollar Bars: Why Crypto Quants Ditch Time Bars
Discover how institutional crypto quants use Dollar Bars, Micro-Price, and Order Book Imbalance (OBI) to eliminate noise and restore statistical normality.
MC
Marcus ChenSenior Quantitative Strategist·Sep 23, 2026 · 18 min read · Updated Oct 6
The Illusion of Time: Why 1-Minute Candles Fail in Crypto
For over a century, financial markets have analyzed price action through chronological intervals: 1-minute, 15-minute, 1-hour, and daily candles. In the 24/7/365 liquidity firehose of crypto perpetual futures, this time-based framework is fundamentally broken.
Consider this thought experiment:
Between 03:00 UTC and 03:01 UTC on a quiet Sunday night, Bitcoin may record only 14 trades totaling $80,000 in volume across the order book. Conversely, at 12:30 UTC on a Wednesday following an unexpected US CPI release, the identical 1-minute interval witnesses 12,400 trades executing over $45,000,000.
Yet, on a traditional charting platform, both time periods are represented by an identical candlestick spanning 60 seconds.
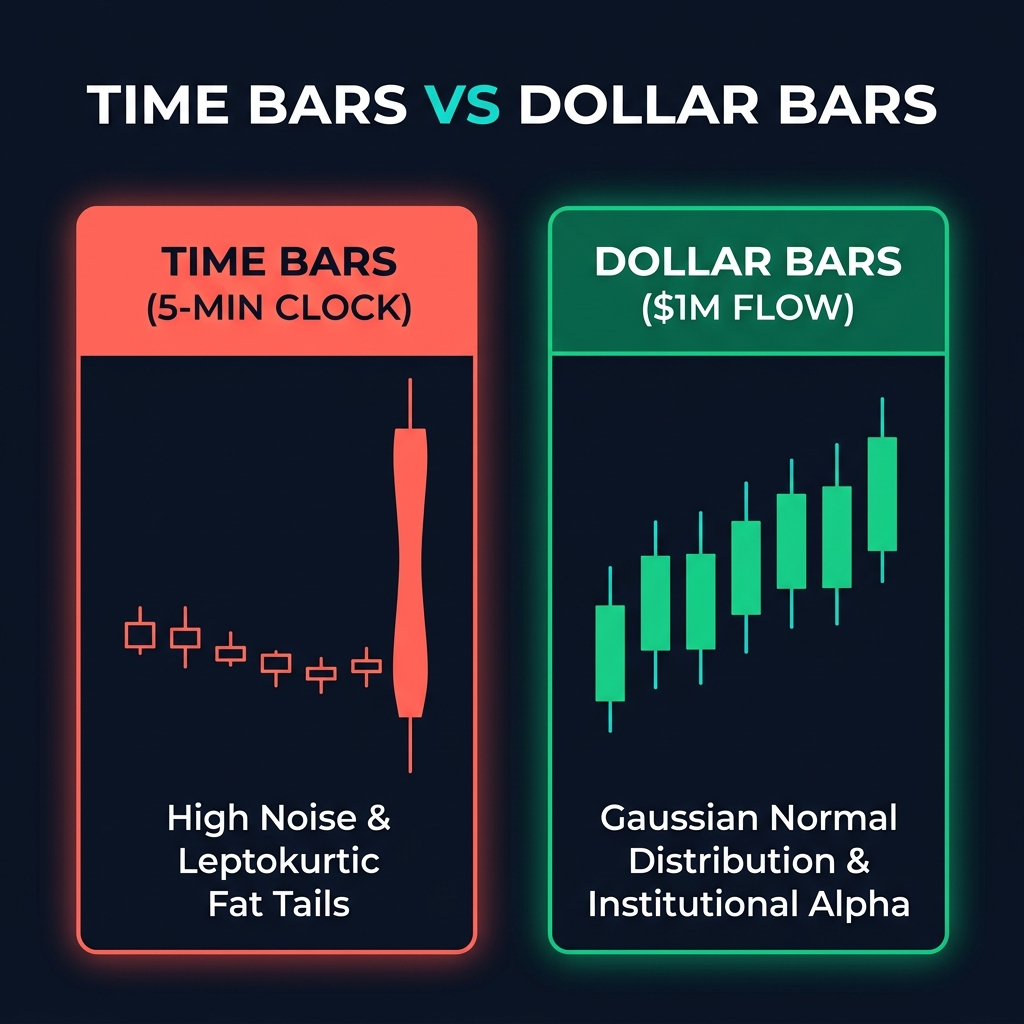
By treating intervals of massive liquidity transformation identically to periods of total dormancy, time-based sampling introduces severe statistical pathologies:
Heteroskedasticity: Variance of asset returns varies unpredictably depending on market activity levels.
Fat Tails & Non-Normality: Return distributions exhibit extreme kurtosis, violating the core assumptions of almost every statistical model, mean-variance optimizer, and Value-at-Risk (VaR) framework.
Signal Aliasing: Critical institutional block flow during volatility surges is compressed into a single bar, while non-informative retail noise during lulls is oversampled into dozens of empty bars.
In his seminal work Advances in Financial Machine Learning (Wiley, 2018), Marcos López de Prado demonstrated that modern quantitative finance must transition from chronological time to Information-Driven Bars.
This guide explores the foundational mathematics of market microstructure, contrasts time bars with Dollar Bars, and demonstrates how institutional systems model order book depth to extract actionable alpha.
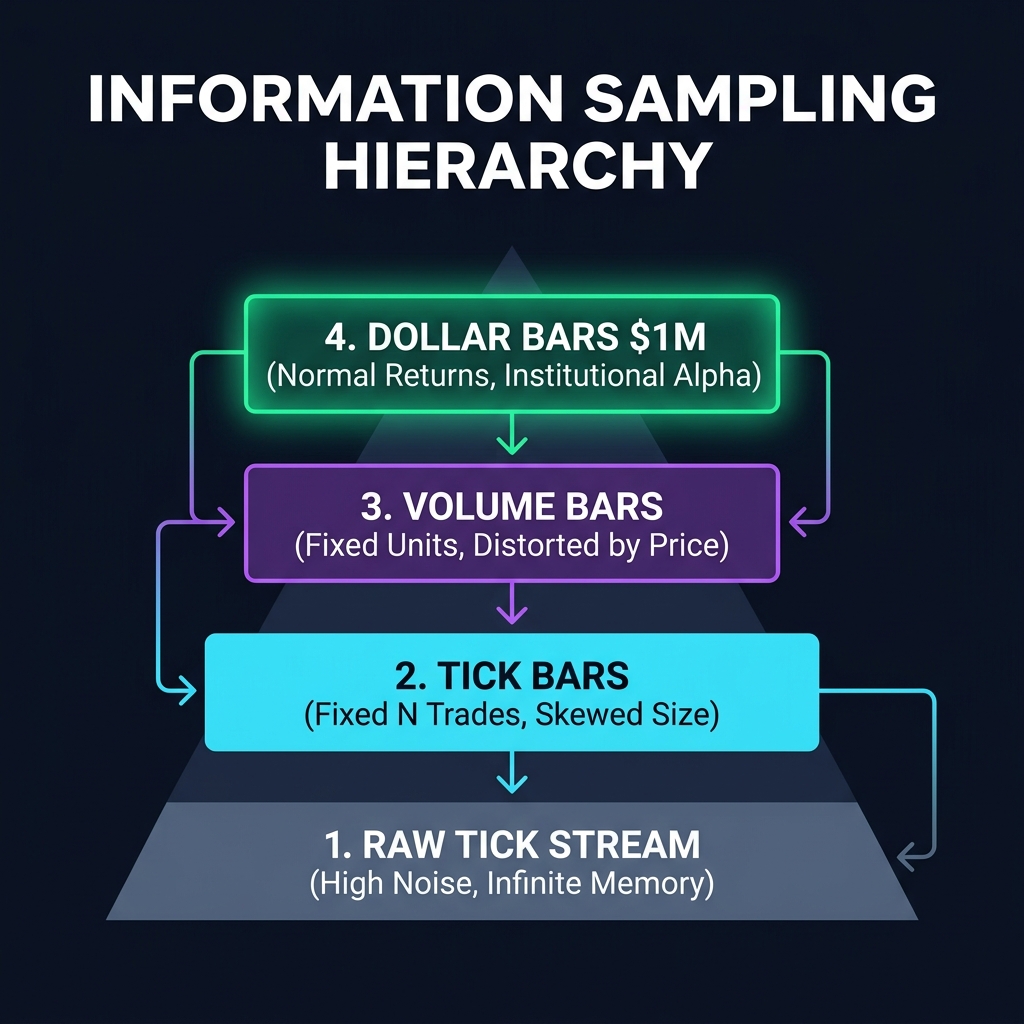
The Hierarchy of Information Sampling
To build models that capture true market dynamics, quants sample data based on activity rather than the clock:
1. Tick Bars
Tick bars sample data every N transactions regardless of time. While tick bars mitigate some trading lull issues, they fail to distinguish between a retail order of 0.001 BTC and an institutional execution of 50 BTC. Both register as exactly 1 tick.
2. Volume Bars
Volume bars sample data every time V* units of the underlying asset are exchanged (e.g., every 500 BTC). While superior to tick bars, volume bars suffer when asset prices fluctuate drastically. If BTC surges from $30,000 to $70,000, trading 500 BTC requires 2.33 times more capital, distorting historical comparisons.
3. Dollar Bars (The Gold Standard)
Dollar bars sample transactions whenever a fixed total value in fiat or quote currency (T*) is exchanged:
θ_T = Σ (Price × Volume)
Condition: Generate new bar when |θ_T| >= Dollar Threshold (e.g. $1,000,000 USD)
Where:
p_t represents the execution price of trade $t$.
v_t represents the volume quantity transacted.
θ_T accumulates until it hits the predetermined threshold T* (e.g., $1,000,000 USD), at which point a new bar is generated.
Empirical Comparison: Time Bars vs. Dollar Bars
Property
Traditional Time Bars (1m / 1h)
De Prado Dollar Bars ($1M / $5M)
Quant Benefit
Sampling Clock
Chronological (Clock time)
Transaction Value (Market Energy)
Samples faster when information arrives; slows down when market sleeps.
Statistical Distribution
Fat-tailed, leptokurtic, non-normal
Near Gaussian normal distribution
Enables valid statistical inference, Sharpe ratios, and ML loss convergence.
Price Adjustment
Rigid; breaks across price regimes
Self-adjusting to asset price drift
Dollar threshold scales naturally as asset capitalization expands.
Institutional Detection
Invisible (mixed inside time candles)
Observable via tick count per bar
Highlights whale block execution vs. retail algorithmic fragmentation.
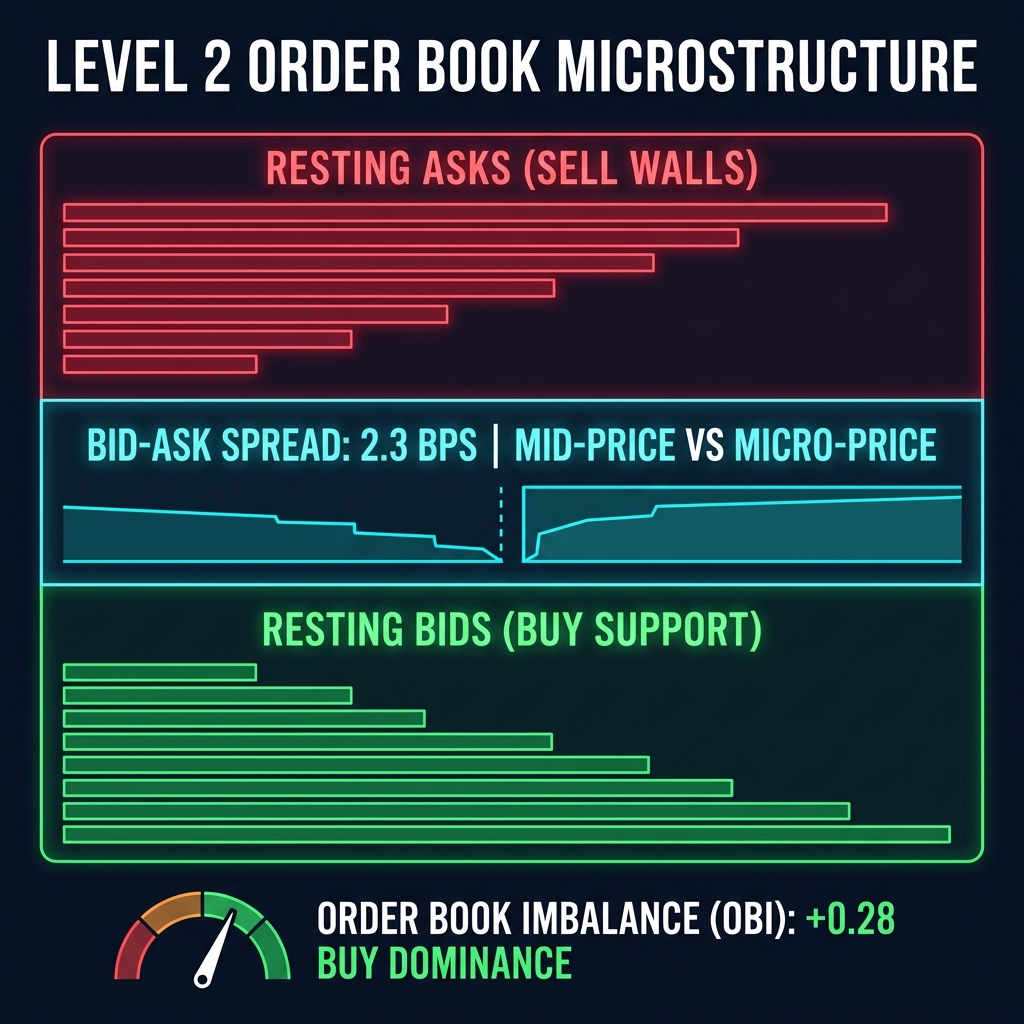
Market Microstructure: Inside the Level 2 Order Book
Before an order executes and registers on a dollar bar, it exists inside the Level 2 (L2) Order Book.
In crypto derivatives markets, analyzing the state of the limit order book provides immediate predictive power regarding near-term tick direction.
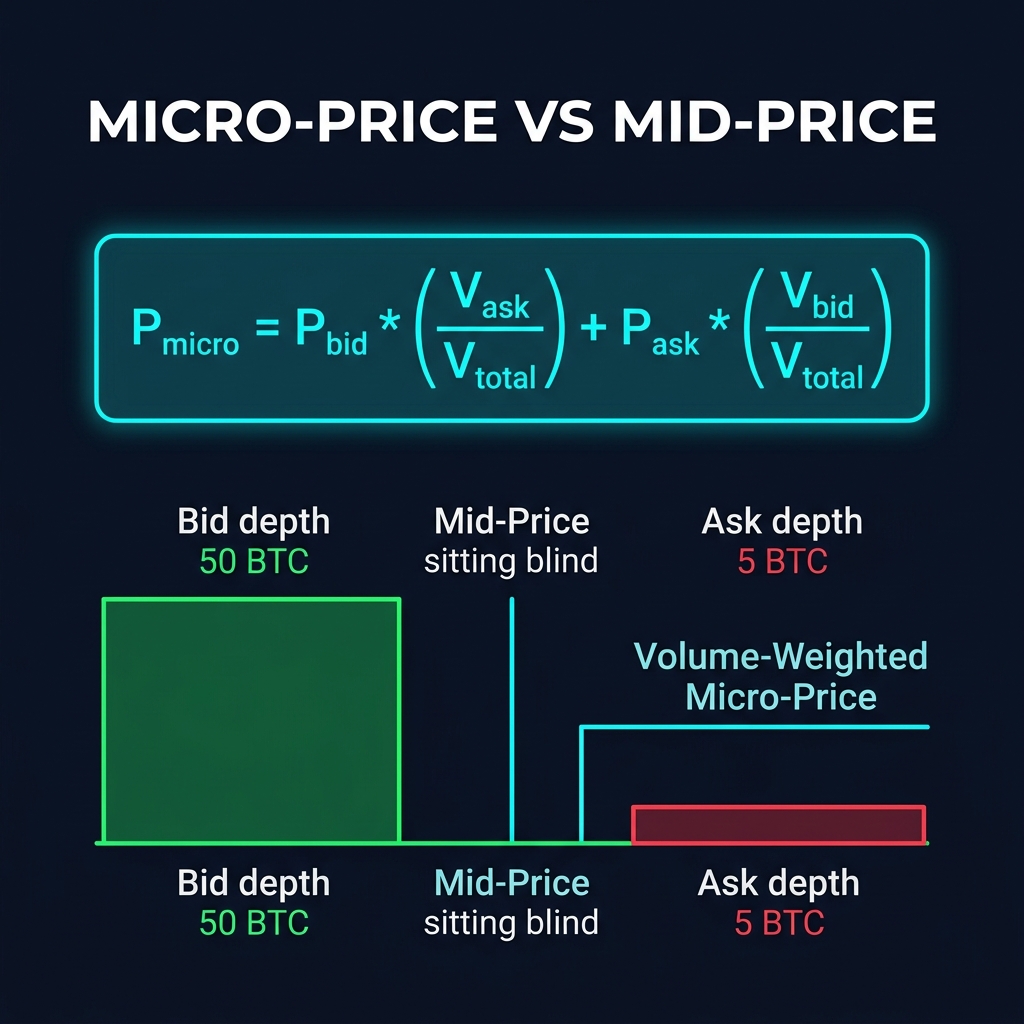
1. Mid-Price vs. Micro-Price
Retail charting software displays the Mid-Price, which is simply the unweighted arithmetic mean of the top bid and ask:
P_mid = (P_bid + P_ask) / 2
The mid-price contains a major flaw: it ignores the liquidity balance. If there are 100 BTC bid at $64,099.50 and only 0.5 BTC asked at $64,101.00, the true clearing price will overwhelmingly push upward through the thin ask.
Quantitative algorithms calculate the Micro-Price (P_micro), which weights the top levels by the opposite side's available volume:
Cross-Venue Agreement: When OBI aligns across multiple primary venues (Binance, Bybit, OKX), the signal-to-noise ratio rises substantially, signaling coordinated institutional inventory adjustments.
Volume-Weighted Average Price (VWAP) on Dollar Bars
When calculating VWAP on traditional time bars, the metric resets arbitrarily at 00:00 UTC or session opens. On Dollar Bars, VWAP is calculated continuously across fixed increments of capital:
VWAP = Σ (Price × Volume) / Σ Volume
Where M_k is the total number of trade ticks composing the $k$-th dollar bar.
Because each bar represents an identical capital tranche (e.g., $1,000,000 USD), the deviation between the Close and VWAP provides an instant reading of trade dominance:
Bullish Accumulation: Close > VWAP with a low tick count ($<180$). Large traders are hitting the ask aggressively, sweeping liquidity above the volume-weighted average.
Bearish Distribution: Close < VWAP with low tick count ($<180$). Whales are dumping into resting bids, forcing the bar to settle below institutional cost basis.
Retail Indecision: Close ≈ VWAP with high tick count ($>300$). Many small fragmented retail orders battling without institutional participation.
Decoding Institutional Activity via Tick Counts
One of the most powerful alpha generation mechanics unlocked by Dollar Bars is Tick Count Decomposition:
Average Trade Size = Dollar Threshold ($1,000,000) / Ticks Count
In a $1,000,000 Dollar Bar:
If the bar fills in 85 ticks, the average execution size is $11,764 per trade.
If the bar requires 1,200 ticks to fill, the average execution size is $833 per trade.
By monitoring the velocity of tick arrival against fixed dollar thresholds, quantitative execution models can distinguish between genuine institutional accumulation and retail FOMO breakouts.
Summary Checklist: Applying Microstructure & Dollar Bars
Abandon Chronological Fixation: Cease building machine learning models or statistical strategies on fixed 1-minute or 5-minute candles.
Calibrate Dollar Bar Thresholds: Choose a threshold T* that produces between 50 and 200 bars per day on your target asset (e.g., $1,000,000 for BTC, $250,000 for SOL).
Monitor Micro-Price Spread: Never execute market orders when P_micro diverges unfavorably from the current Mid-Price.
Leverage Cross-Venue OBI: Confirm that order book skew is consistent across primary derivative exchanges before initiating momentum positions.
🚀 Live Implementation: Experience real-time $1M Dollar Bars, live Order Book Imbalance, and continuous Micro-Price tracking on the CoinXSight Quant Terminal.
AI-powered risk management is transforming how traders protect their crypto portfolios. Learn how machine learning detects portfolio risk, prevents drawdowns,…