Large institutional market participants—hedge funds, proprietary trading desks, and liquidity providers—cannot enter positions like retail traders. When an entity needs to accumulate $50,000,000 worth of Bitcoin, executing a single market buy order would sweep the order book, creating massive adverse slippage.
Instead, institutional execution algorithms (such as TWAP, VWAP, and Iceberg orders) slice large orders into dozens of smaller blocks across time and venues.
On conventional candlestick charts, this stealth accumulation is masked inside ordinary green and red candles. But on the CoinXSight Quant Terminal, these orders are unmasked by the $1,000,000 Dollar Bars Panel.
This guide teaches you how to read the Dollar Bars table line by line, decode tick count fragmentation, and execute the Whale Accumulation Playbook.
Anatomy of the $1M Dollar Bars Table
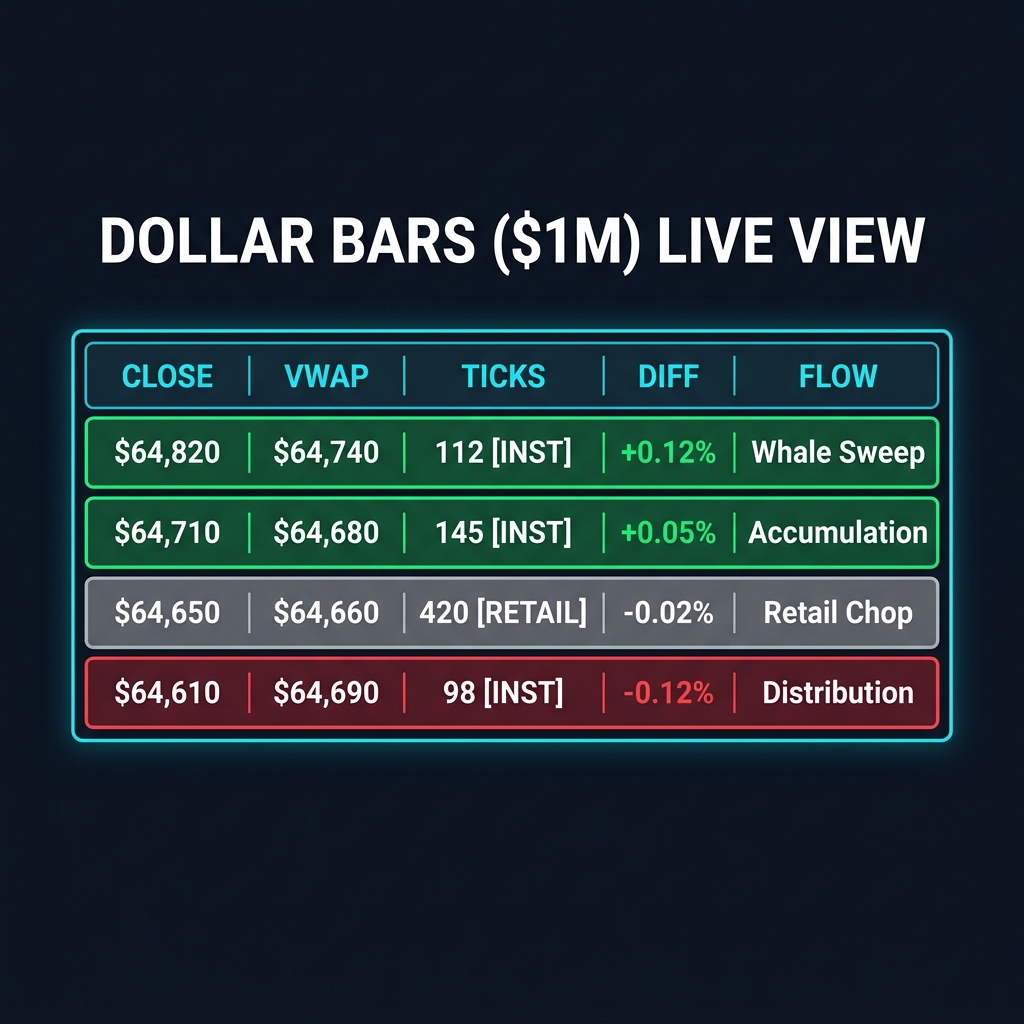
On CoinXSight, trade ticks are continuously ingested from primary perpetual and spot venues. Every time exactly $1,000,000 USD in cumulative value changes hands, the terminal completes a bar and appends a row to the live table:
Let's examine the quantitative significance of each column:
1. Close vs. VWAP (The Value Benchmark)
Each dollar bar calculates the Volume-Weighted Average Price (VWAP) of all transactions within that specific $1M slice:
VWAP_bar = Σ (Price × Volume) / Σ Volume
Close > VWAP: Buyers were aggressive throughout the $1M fill, bidding prices up and finishing above the average execution cost.
Close < VWAP: Sellers dominated the fill, hitting bids and forcing the final trade below the volume-weighted baseline.
2. Ticks Count & The [INST] vs. [RETAIL] Tag
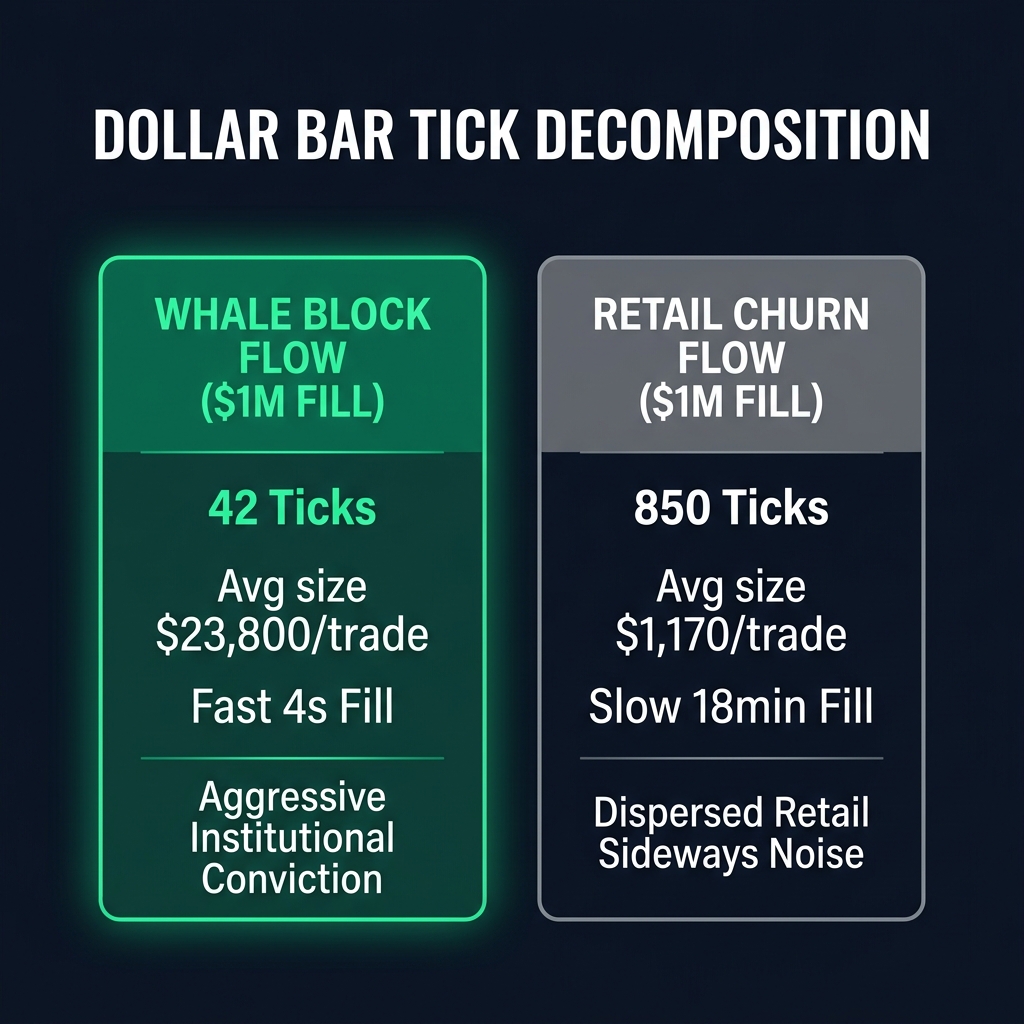
Because every bar represents an identical capital tranche ($1,000,000), the number of trades required to fill that bar reveals the average trade size:
Ticks $< 180$ ([INST] Pill): An average trade size exceeding $5,500 – $15,000+. This indicates large market orders, algorithmic block execution, or whale participation.
Ticks $> 180$ ([RETAIL] Pill): High fragmentation with average trade sizes below $1,500. This reflects retail activity, small scalping bots, or low-conviction chop.
3. VS VWAP Percentage
Measures the percentage deviation between the bar's closing print and its volume-weighted mean:
Δ_VWAP = ((Close / VWAP) - 1) × 100%
A positive Δ_VWAP combined with an [INST] tag confirms that large participants are willing to pay a premium to secure inventory.
Identifying Institutional Flow Patterns
By observing sequences of 3 to 5 dollar bars, traders can identify clear institutional patterns that do not appear on standard charts:
Pattern A: True Whale Accumulation
Bar #1: $1M filled in 98 ticks   │ Close > VWAP (+0.14%) │ [INST]
Bar #2: $1M filled in 115 ticks  │ Close > VWAP (+0.08%) │ [INST]
Bar #3: $1M filled in 130 ticks  │ Close > VWAP (+0.19%) │ [INST]
Verdict: Coordinated institutional buying sweeping the book. High momentum probability!

Pattern B: Retail Trap (Fake Breakout)
Bar #1: $1M filled in 550 ticks  │ Close > VWAP (+0.25%) │ [RETAIL]
Bar #2: $1M filled in 680 ticks  │ Close > VWAP (+0.10%) │ [RETAIL]
Bar #3: $1M filled in 85 ticks   │ Close < VWAP (-0.18%) │ [INST]
Verdict: Retail chased the breakout into a resting whale limit sell order. Immediate reversal risk!
The Whale Accumulation Playbook (Step-by-Step)
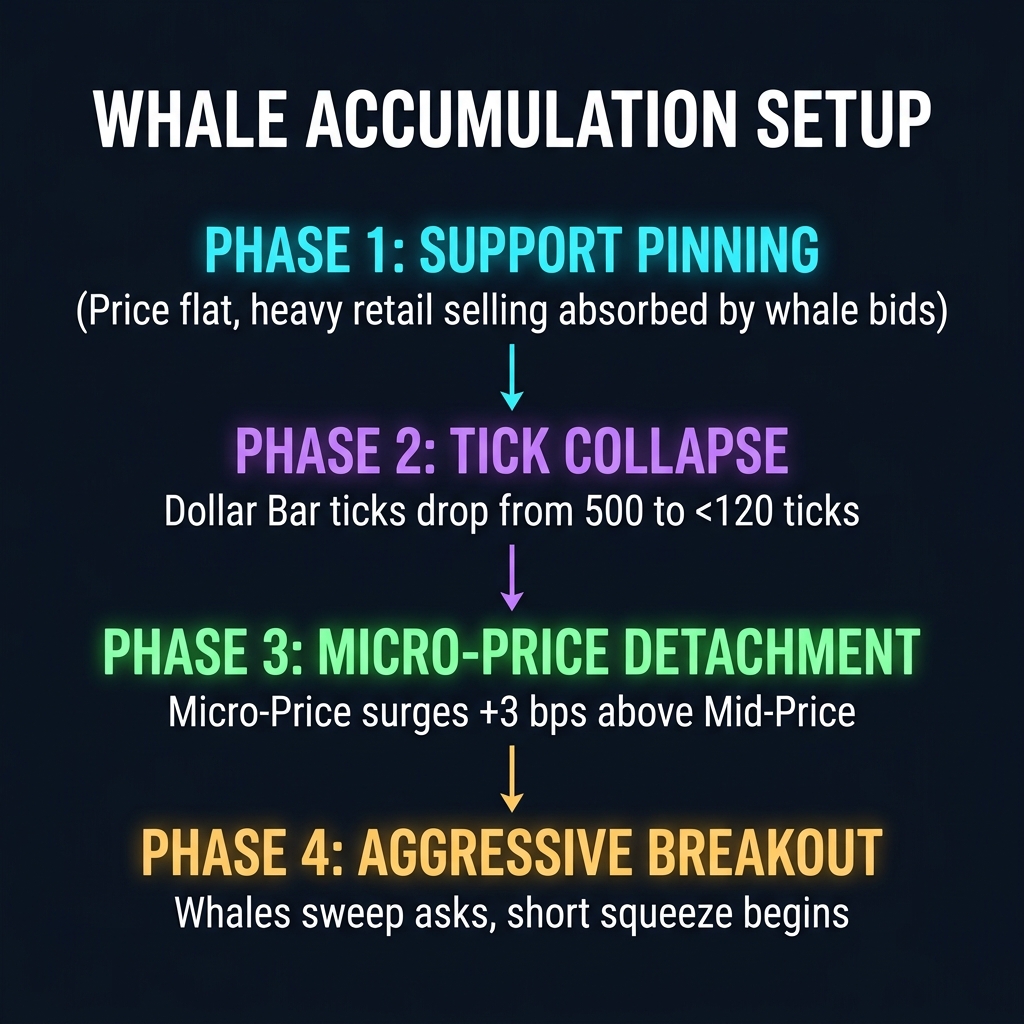
This playbook leverages the convergence of $1M Dollar Bars, Cross-Venue OBI, and the Cumulative Volume Delta (CVD):
       CVD drenching positive ───┐
                                 ├──> [WHALE ACCUMULATION SETUP] ──> Long at VWAP Retest
  2+ [INST] Dollar Bars (C > VWAP)│
                                 │
 Cross-Venue OBI > +0.20 ────────┘
Setup Requirements
Macro Check: Quant Terminal Step 1 shows BULL regime, and Step 2 Pre-Trade check displays GO ($>75$).
Institutional Footprints: The Dollar Bars table logs at least 2 consecutive bars with:
Close > VWAP (Δ_VWAP >= +0.05%)
Ticks $< 180$ with the active [INST] tag.
Cross-Venue OBI: The OBI gauge in the Order Flow panel shows positive imbalance across at least 2 primary venues (OBI > +0.15).
CVD Confirmation: Real-time CVD (Cumulative Volume Delta) is trending upward, confirming market buyers are aggressive.
Execution & Invalidation Rules
Entry: Place a Limit Buy order at the VWAP price of the most recent institutional dollar bar (or wait for a retest on the 1-minute chart).
Stop-Loss: Place the stop immediately below the Low of the institutional dollar bar cluster (typically 0.8% to 1.5% below entry).
Take-Profit: Target the Suggested Trade TP1 level generated in Step 2 of the terminal, or exit when an [INST] bar closes with Close < VWAP.
Practical Case Study: Bitcoin $64,000 Accumulation
During a recent consolidation at $64,200, retail sentiment turned bearish due to declining open interest. However, the CoinXSight Quant Terminal revealed a starkly different reality:
Over 45 minutes, 18 Dollar Bars ($18M in volume) printed.
14 out of the 18 bars printed with [INST] tags (averaging only 110–135 ticks per bar).
In all 14 bars, Close settled strictly above VWAP.
Meanwhile, the Cross-Venue OBI registered a steady +0.285, signaling heavy passive bid support absorbing every retail sell-off.
Traders following standard time-based indicators saw a stagnant market and stayed out. Quantitative traders utilizing Dollar Bars recognized institutional block absorption, entered at the $64,210 VWAP retest, and rode the subsequent breakout to $66,800.
Summary Checklist: Trading with Dollar Bars
Filter Out Retail Noise: Pay primary attention to dollar bars marked with the purple/blue [INST] badge ($<180$ ticks).
Respect VWAP Alignment: When holding a long position, continuous bars closing below VWAP (Close < VWAP) signal early warning of institutional distribution.
Combine with Cross-Venue OBI: Ensure resting bid/ask depth confirms the aggressive executions seen on the tape.
Never Chase High-Tick Bars: A massive price jump that takes 800+ ticks to fill $1M is fragile retail FOMO, highly susceptible to mean reversion.
⚡ Next Up: Derivatives Mastery & Squeeze Hunting.
How do you identify liquidation cascades before they occur and exploit short squeezes using funding rate mechanics?