👉 Advanced Price Action & Institutional Flow(you are here)
What Are Institutional Footprints in Price Action
Institutional footprints are identifiable patterns in price, volume, and order flow that reveal when large players — hedge funds, market makers, prop desks, and algorithmic systems — are entering, exiting, or manipulating the market. These patterns are invisible on a superficial chart read but become clear once you know what to look for.
Retail traders see a candle. Institutional PA readers see the battle: Who accumulated? Who distributed? Who got trapped? Where are the unfilled orders?
This advanced approach draws from Richard Wyckoff's Composite Man theory (1930s) and modern market microstructure research by Lawrence Harris (Trading and Exchanges, 2002). The core principle: markets are not random — they're driven by participants with asymmetric information and capital.
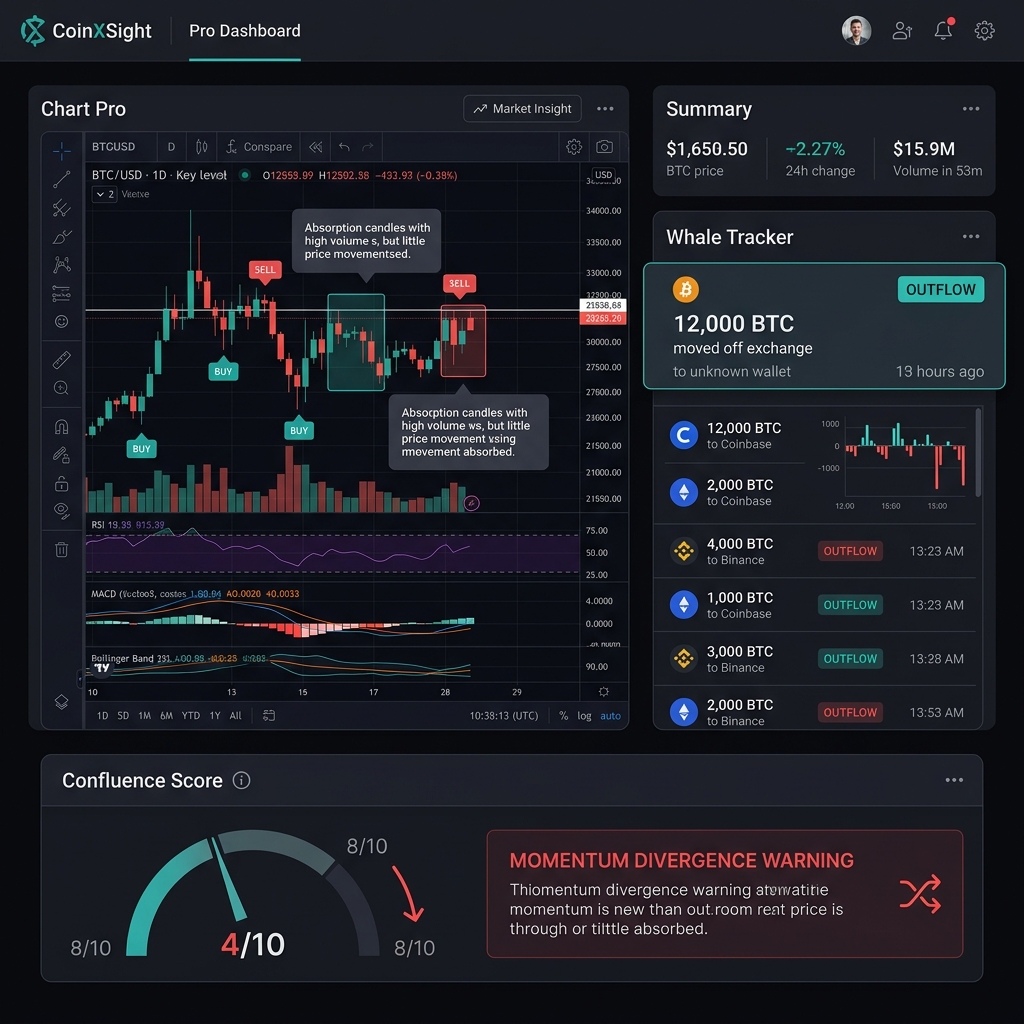
💡 CoinXSight's Deep Alpha module combines price action analysis with on-chain data to identify institutional-grade signals. The Whale Tracker module detects large wallet movements that often precede the PA footprints described in this guide.
Absorption: When Price Stops Moving Despite Heavy Volume
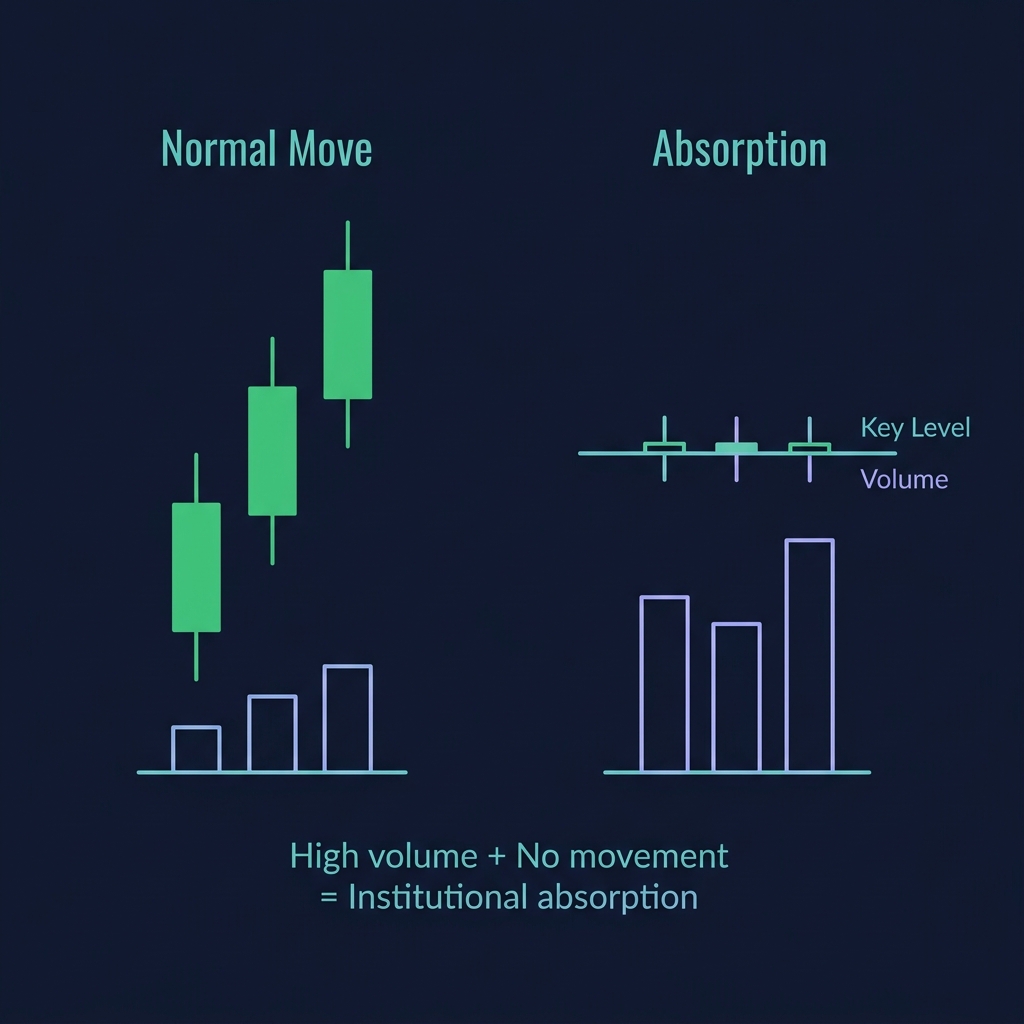
Absorption occurs when one side of the market absorbs the other side's orders without price moving. It's a critical institutional footprint — it means large passive orders are filling aggressive market orders.
How to Identify Absorption
Characteristic
Absorption Present
Absorption Absent
Volume
High (2x+ average)
Normal
Price movement
Minimal (small candle bodies)
Proportional to volume
Candle appearance
Dojis, spinning tops despite high volume
Large bodies matching volume
Location
At key S/D zones or round numbers
In the middle of a move
What Absorption Tells You
When you see high volume with no price progress at a demand zone, institutional buyers are absorbing the selling pressure. They're filling their long positions against aggressive sellers. The sellers eventually run out — and price rockets in the direction of the absorber.
Absorption Signal:
  Volume > 2x 20-period average
  AND Candle range < 0.5x ATR(14)
  AND Price at a key level (S/D zone, round number)

  → Expect a strong move in the absorber's direction
2026 BTC Example — Absorption at $100K
CoinXSight Deep Alpha observation:
On January 28, 2026, BTC dropped aggressively toward $100,000 — a major psychological level. Volume spiked to 3.2x the 20-day average. However, the 4H candle at $100,000 printed as a doji with only a $380 range (ATR was $1,200). High volume, no movement.
The next two 4H candles also showed above-average volume with small bodies — three consecutive absorption candles at $100K. Whale Tracker on CoinXSight showed 4,200 BTC moved from exchanges to cold wallets during this window — institutional accumulation.
Result: BTC reversed from $99,800 and rallied to $108,500 over the next 12 days. The absorption pattern at $100K signaled institutional buying against retail panic selling.
Exhaustion: When a Trend Runs Out of Fuel
Exhaustion is the opposite of absorption. Price moves aggressively with high volume, but the move is the final push — institutional traders are distributing into the move, not accumulating.
How to Identify Exhaustion
Volume climax: The highest volume candle of the entire move appears near the end, not the beginning
Extended candle: A very large candle (3x+ ATR) that appears after multiple trending candles
Diminishing follow-through: The next 2-3 candles after the climax show smaller bodies and appear indecisive
Wick rejection: The climax candle or the next candle shows a long wick in the trend direction
Exhaustion vs Continuation
The key question: Is this large volume candle the start of a new leg, or the end of the current one?
Feature
Exhaustion (End)
Continuation (New Leg)
Position in trend
After 5+ trend candles
After 1-2 pullback candles
Volume compared to prior candles
Highest of entire move
Moderate, consistent
Follow-through
Weak (dojis, small bodies)
Strong (continuation candles)
Context
At a supply/demand zone
Breaking through open space
⚠️ Limitation: Exhaustion patterns require patience to confirm. You cannot trade them in real-time — you need 2-3 candles after the suspected exhaustion to verify. Pre-empting exhaustion leads to catching falling knives in uptrends and short squeezes in downtrends.
Stop Hunts: Institutional Liquidity Engineering
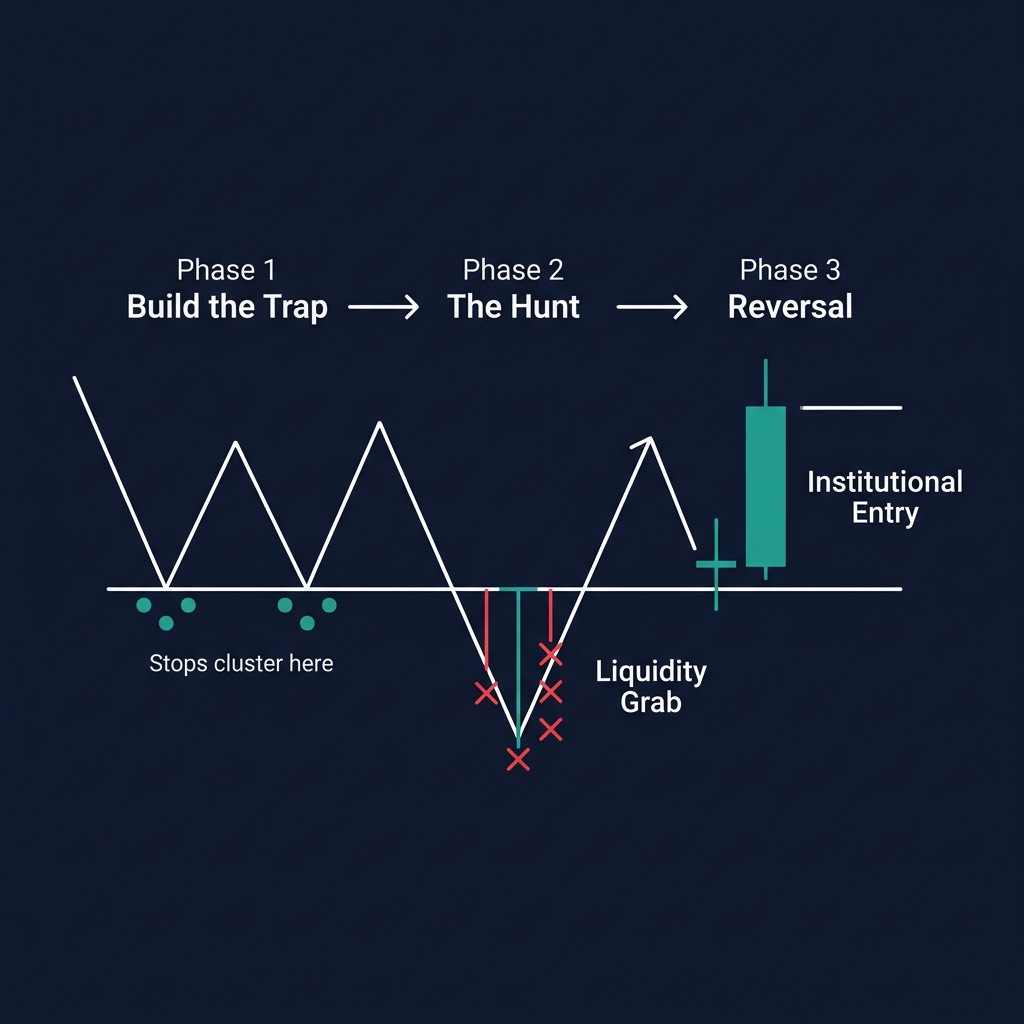
Stop hunts are deliberate price movements designed to trigger stop-loss orders clustered at obvious levels. Institutions engineer these moves to fill their own orders at better prices. Understanding stop hunts is essential crypto technical analysis knowledge — and most features on any crypto analytics platform won't flag these moves, which is why manual price action skills remain critical.
Where Stops Cluster (and Where Hunts Happen)
Below obvious swing lows — retail traders place stops at the last HL in an uptrend
Above obvious swing highs — retail traders place stops at the last LH in a downtrend
Below round numbers — $99,900 BTC, $2,990 ETH, $149 SOL
Below equal lows — when 2-3 swing lows form at the same price, stops pile up just below
Anatomy of a Stop Hunt
Phase 1: Build the trap
  → Price forms obvious swing lows where retail places stops

Phase 2: Spring (the hunt)
  → Price spikes below the swing low, triggering stops
  → Volume spikes as liquidations cascade
  → Institutions fill buy orders against the liquidating sellers

Phase 3: Reversal
  → Price snaps back above the swing low within 1-3 candles
  → The candle leaves a long lower wick (the "hunt wick")
  → Institutions are now long at discount prices
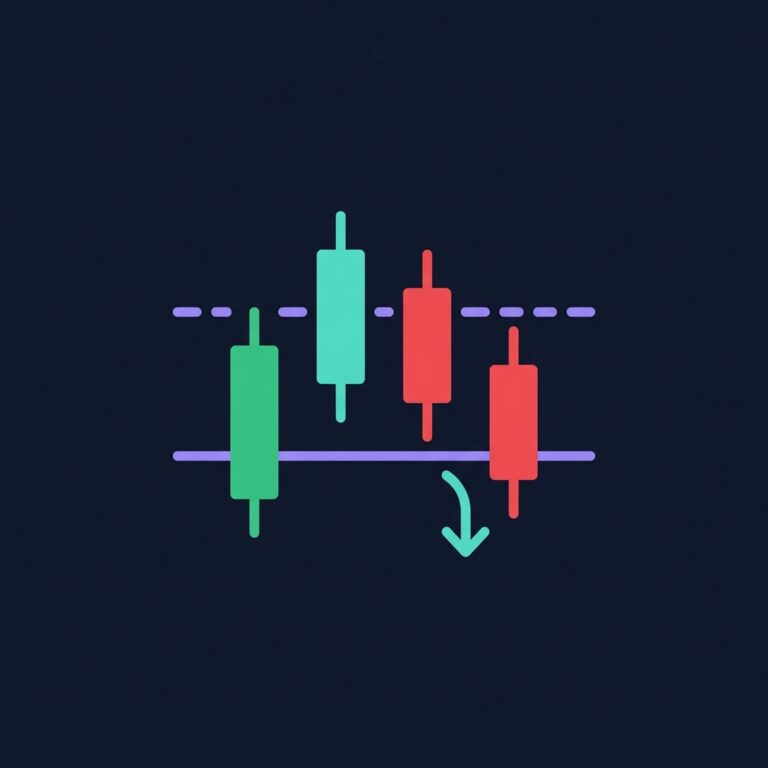
2026 ETH Example — Stop Hunt Below $2,400
ETH/USDT 4H. ETH formed three equal lows at $2,400-$2,405 over March 20-28. Below these lows: thousands of stop-loss orders.
On March 29, a sharp bearish candle spiked to $2,378 — 22 points below the equal lows. Volume was 2.8x average. CoinXSight Whale Tracker detected 8,600 ETH purchased on-chain during this 4H window — institutions buying the liquidity cascade.
Within 2 candles, price recovered to $2,420 and eventually rallied to $2,580 by April 5. Traders who recognized the stop hunt and entered at $2,400 after the reversal candle captured a +7.5% move.
Wyckoff Through the PA Lens: Springs and Upthrusts
Wyckoff's Spring and Upthrust are the original descriptions of stop hunts. Understanding them through modern PA adds precision.
Spring (Bullish)
A Spring is a brief penetration below a trading range's support — the demand fails momentarily, sweeps stops, then price snaps back inside the range. It's the precursor to a markup phase.
PA identification: A candle with a wick below the range support that closes back inside the range. Volume spikes on the wick, then declines on the recovery. The next 2-3 candles show increasing bullish momentum.
Upthrust (Bearish)
An Upthrust is the mirror: a brief penetration above resistance that fails. Price wicks above the range high, triggering buy stops, then reverses back inside.
PA identification: A candle with a wick above range resistance that closes back inside. Volume spikes on the wick (buy-stop activation), then sells off. The next 2-3 candles are bearish.
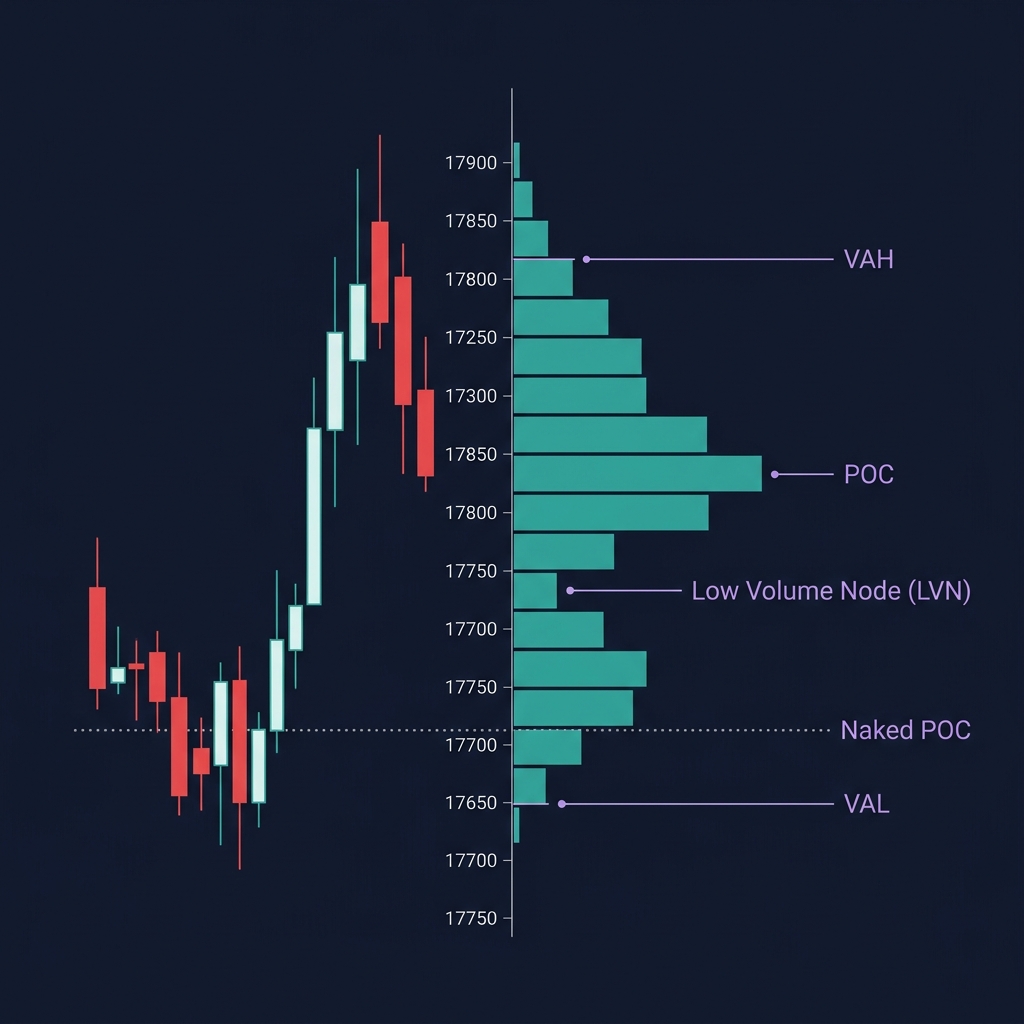
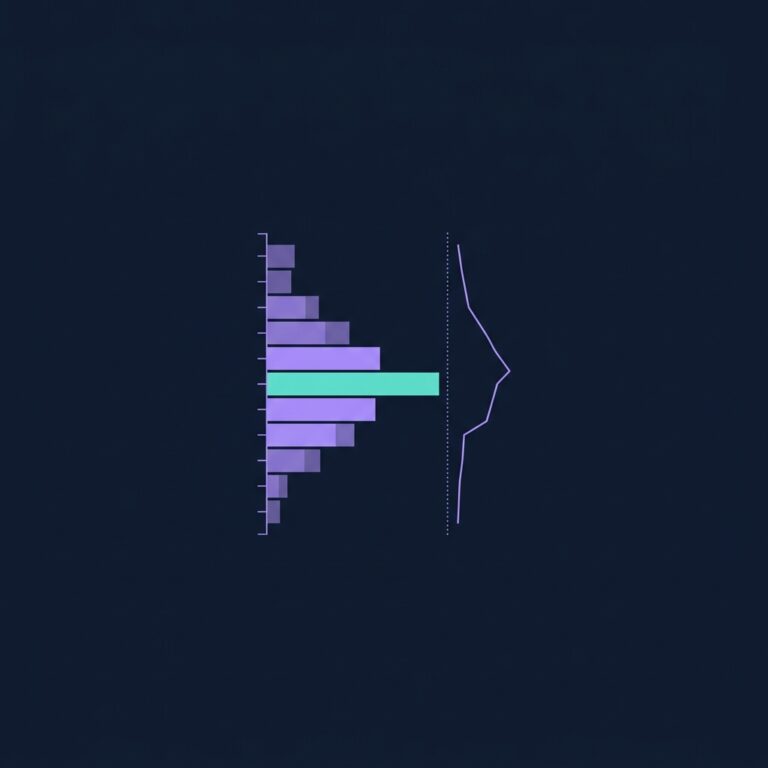
Volume Profile maps where volume was traded across price levels — not over time. When combined with PA, it reveals where institutional positions are concentrated.
Key Volume Profile Levels
Level
What It Is
PA Application
POC (Point of Control)
Price with most traded volume
Acts as a magnet — price tends to return here
Value Area High (VAH)
Upper boundary of 70% volume
Acts as resistance
Value Area Low (VAL)
Lower boundary of 70% volume
Acts as support
Naked POC
A POC from a prior session that hasn't been retested
False break below LVN → Stop hunt (price moved through a low-volume area to find liquidity, then reversed)
2026 BTC Example — Naked POC Retest
BTC/USDT daily chart. The March 5-12 range had a POC at $104,200 — the price where 28% of the week's volume was traded. Price departed upward to $109,000, leaving the POC "naked" (untested).
On March 28, BTC pulled back to $104,400 — within $200 of the naked POC. A bullish engulfing candle printed at $104,300 with volume 1.9x average. CoinXSight Confluence Score: 8/10.
Result: BTC bounced from $104,300 to $111,200 by April 8. The naked POC acted as a magnet, pulling price back to its highest-volume level, where institutional buy orders were still queued.
Time-Based Price Action: Session Opens and Weekly Pivots
Institutional activity clusters around specific times. Using time-based PA adds a temporal confluence layer.
Key Time Levels
Time Event
Why It Matters
PA Application
Weekly Open (Mon 00:00 UTC)
Institutions set weekly bias
Monday's first 4H candle direction predicts weekly direction ~58% of the time
Monthly Open (1st of month)
Monthly rebalancing
Price often retests the monthly open level within the first week
London Session Open (07:00 UTC)
European institutional desks open
Sharp moves and reversals cluster around this time
New York Open (13:00 UTC)
US institutional desks join
Volume spikes; fake moves from London often reverse here
CME Close (20:00 UTC Friday)
CME BTC futures close
BTC tends to "fill" the gap between CME close and next week's open
CME Gap Fill Strategy
The CME BTC futures market closes on Friday evening and reopens Sunday evening. Any price movement during the weekend creates a "gap" on the CME chart. Historically, 77% of CME gaps fill within 7 days (2020-2026 data).
PA setup: If BTC moves +3% over the weekend (above CME Friday close), place a limit buy order at the CME close price with a stop $500 below. The gap-fill tendency gives you a statistical edge.
⚠️ Limitation: Session-based analysis works best for BTC and ETH. Smaller altcoins have less institutional participation and don't follow session rhythms reliably. Apply time-based PA only to tokens with 24H volume above $500M.
Institutional Distribution Pattern — Reading the Top
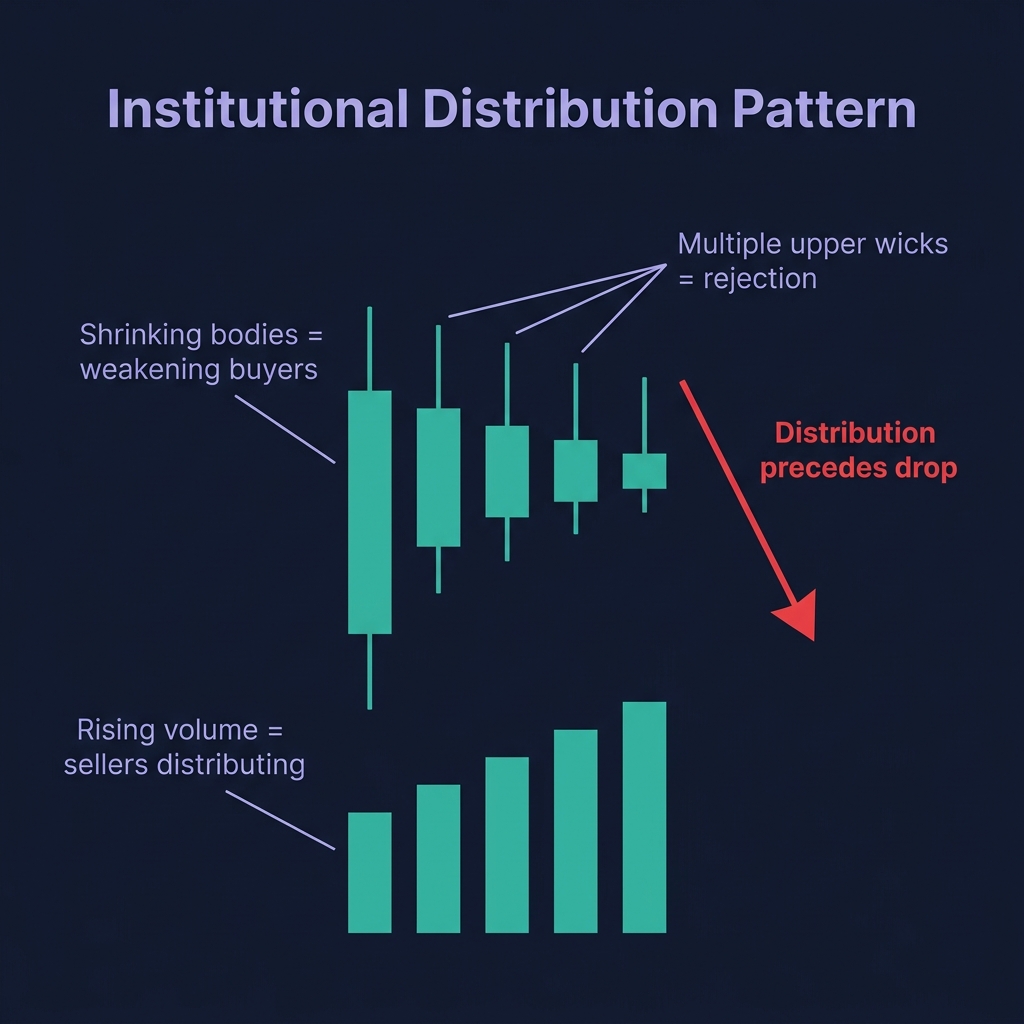
The most valuable advanced PA skill is recognizing when institutions are distributing (selling) into retail buying euphoria.
Distribution Checklist
Decreasing candle body size at new highs — price makes HH but candles are shrinking
Rising volume without price progress — absorption by sellers at the highs
Multiple upper wicks — repeated rejection at a price ceiling
Diverging momentum — price makes HH but RSI/MACD makes a lower high
On-chain outflows — large wallets sending tokens TO exchanges (preparing to sell)
2026 BTC — Distribution at $112K (April 2026)
BTC rallied from $104K to $112K between March 28 and April 12. At $111,500-$112,000:
4H candle bodies shrank from $1,200 average to $400
Volume was 2.5x average but price was flat (absorption by sellers)
4 consecutive upper wicks above $111,800
CoinXSight Whale Tracker: 12,000 BTC moved TO exchanges in 48 hours
CoinXSight Confluence Score dropped from 8/10 to 4/10 as momentum diverged
Result: BTC dropped from $112K to $103,200 over the next 10 days (-7.8%). The distribution pattern at $112K was textbook — institutions sold their positions into retail FOMO at the highs.
How to Use Advanced PA on CoinXSight
CoinXSight functions as a comprehensive crypto analytics platform purpose-built for institutional-grade analysis. Here's the workflow:
Open Chart Pro — set to 4H timeframe with volume bars visible
Check Whale Tracker for unusual exchange inflows/outflows
Look for absorption (high volume + small candles at key levels)
Monitor for exhaustion (climax candles after extended moves)
Identify stop hunt setups (price near obvious equal lows/highs)
Cross-reference with Deep Alpha Confluence Score — enter only when 7+/10
Check the weekly and monthly open levels for time-based confluence
💡 CoinXSight's multi-module approach enables institutional PA analysis. Chart Pro shows the raw candle data, Whale Tracker reveals the on-chain institutional movements, and Deep Alpha scores the confluence. Used together, they provide the full institutional PA picture — something that traditionally required Bloomberg Terminal + Glassnode + TradingView subscriptions.
FAQ
What are institutional footprints in crypto trading?
Institutional footprints are identifiable patterns in price and volume that reveal when large players are entering, exiting, or manipulating the market. Key footprints include absorption (high volume, no price movement), exhaustion (climax candles at trend ends), and stop hunts.
How do stop hunts work in crypto?
Institutions push price beyond obvious levels (swing lows, round numbers) to trigger clustered stop-loss orders. The resulting liquidation cascade provides liquidity for institutions to fill their own orders at better prices. Price then reverses sharply.
Can you detect algo trading patterns on a chart?
Yes — algo patterns show consistent behavior: stop hunts occur at predictable locations (equal lows/highs, round numbers), exhaustion candles appear after 5+ trend candles with climax volume, and absorption shows high volume with minimal price movement at key zones.
Do I need a specific crypto analytics platform for institutional PA analysis?
You need a platform that combines candlestick charting with on-chain data and whale tracking. Most standalone charting tools lack the on-chain layer. CoinXSight integrates Chart Pro, Whale Tracker, and Deep Alpha Confluence Scoring into a single crypto analytics platform — the same data combination that institutional desks use across multiple paid subscriptions.
How does CoinXSight help identify institutional activity?
CoinXSight combines Chart Pro (PA candle analysis), Whale Tracker (exchange inflow/outflow data), and Deep Alpha (Confluence Scoring) to identify institutional activity. Large wallet movements detected on-chain often precede the PA footprints visible on charts.
What is the most reliable advanced PA pattern?
The absorption pattern at fresh demand zones has the highest reliability (~70% win rate on 4H BTC). When high volume produces small candles at a key level AND Whale Tracker shows accumulation, the reversal probability is the strongest of any PA setup.