👉 Liquidation Squeeze & Microstructure Playbook — Live Derivatives Trading(you are here)
Where Retail Gets Trapped: The Perpetual Battlefield
Cryptocurrency derivatives are unique in global finance: high leverage (up to 100x), continuous 24/7 liquidations, and an algorithmic settlement mechanism (Funding Rates) linking perpetual futures to spot markets.
In this environment, price does not move randomly; it seeks liquidity.
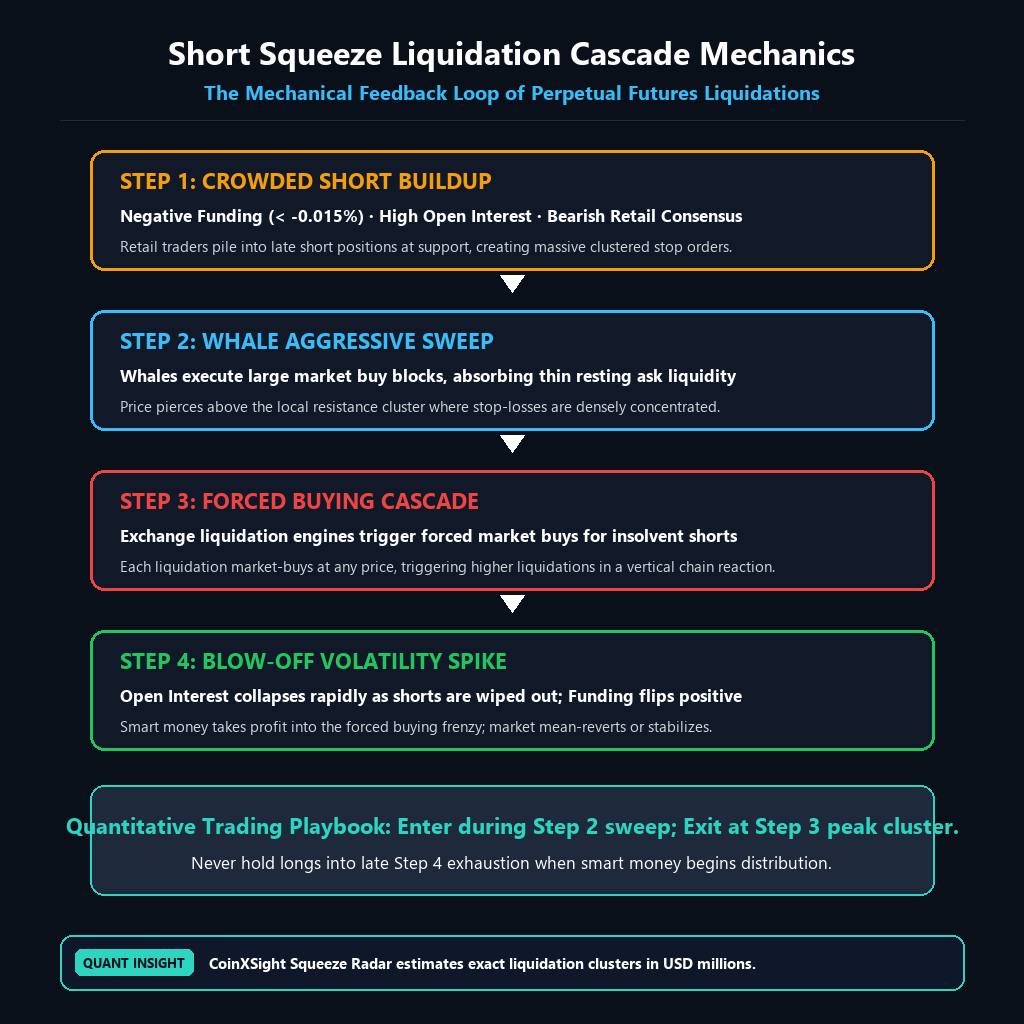
When too many participants crowd onto one side of the trade, the order book becomes structurally unstable. A minor push triggers forced liquidations, which enter the market as aggressive market orders, fueling further slippage and creating a self-reinforcing Liquidation Cascade.
The right column of the CoinXSight Quant Terminal houses two dedicated institutional analytics modules designed to exploit these dynamics:
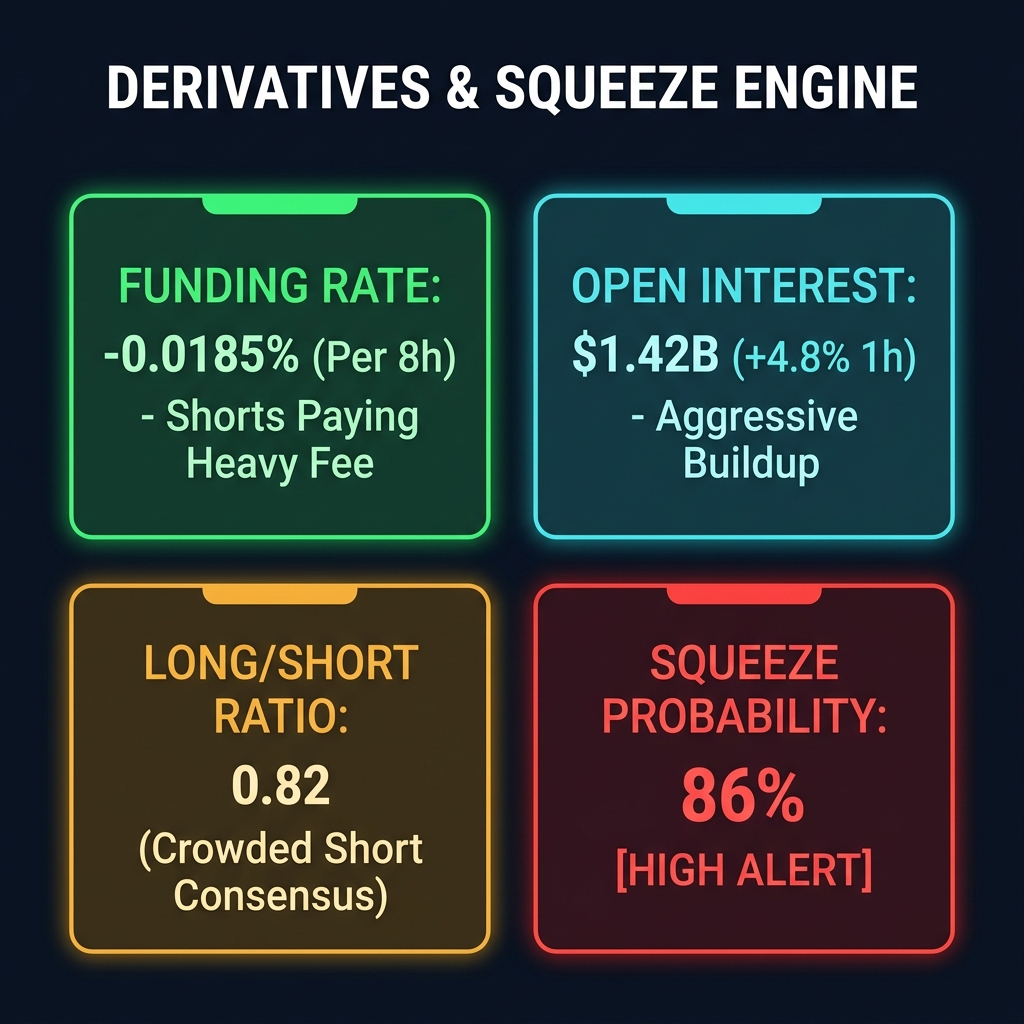
The Derivatives Panel: Tracks Funding Rate deviations, Open Interest changes, Long/Short ratios, and Squeeze Probability.
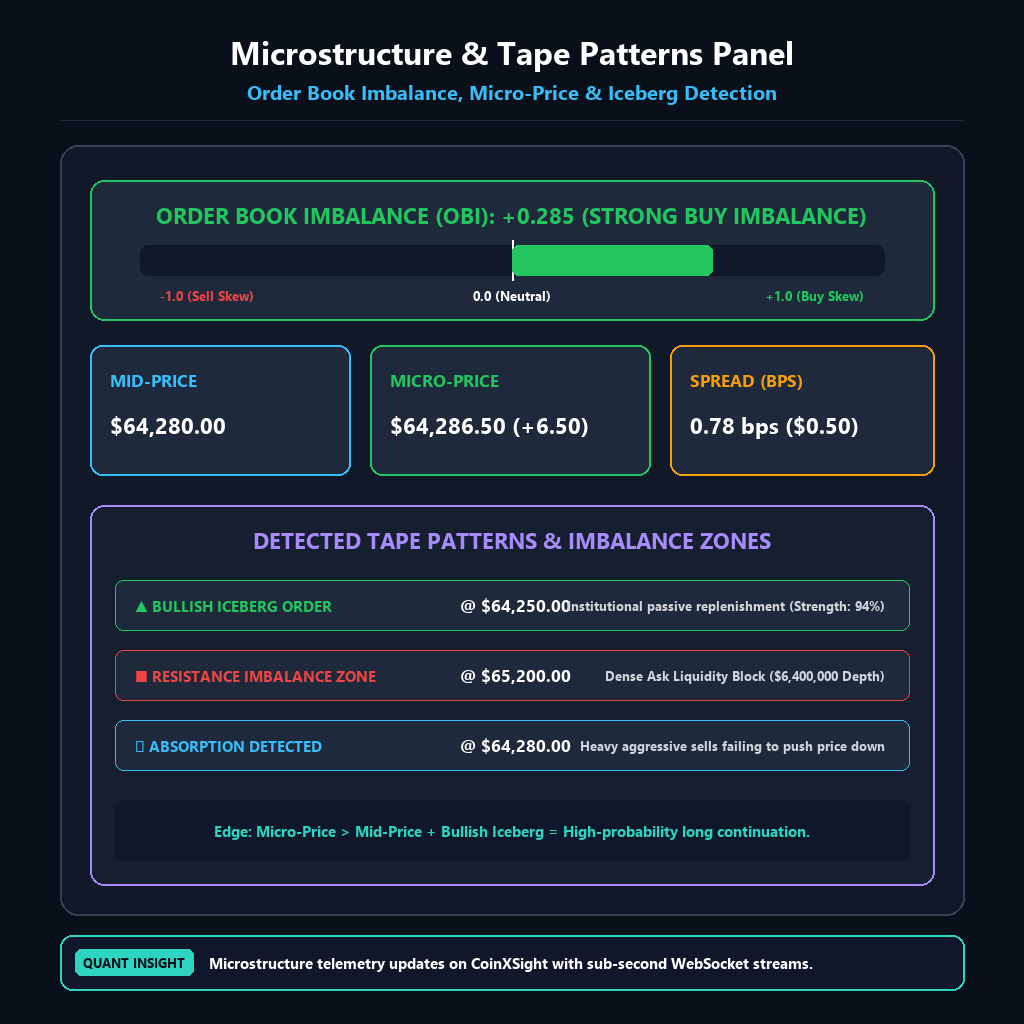
The Microstructure Panel: Measures real-time Micro-Price vs. Mid-Price divergence, Spread in basis points, Imbalance Zones, and tape absorption patterns.
In this concluding installment of the Quantitative Crypto Trading Mastery series, we translate these panels into two repeatable, high-expectancy trading playbooks: the Perp Squeeze Hunter and the Microstructure Divergence Reversal.
Mastering the Derivatives Panel
1. Funding Rate Extremes
As explored in Part 3, the funding rate anchors perpetual prices to spot.
Normal Range: Between $+0.005%$ and $+0.015%$ per 8 hours (reflecting moderate baseline bullish carry).
Extreme Negative ($<-0.015%$): Excessive leverage is positioned short. Short traders are paying high continuous interest to stay short.
Extreme Positive ($>+0.040%$): Excessive leverage is long. Market makers are charging premium rates, making long positions vulnerable to sudden flushes.
2. Squeeze Probability Metric (%)
CoinXSight's proprietary Squeeze Engine calculates a probability score (0% to 100%) based on:
The rate of change in Open Interest while price consolidates.
Skew in the Long/Short account ratio.
Cluster proximity of estimated liquidation prices relative to the current mid-price.
When Squeeze Probability climbs above 75%, a violent liquidation run is statistically imminent.
3. Liquidation Levels & Density
The liquidation feed estimates where clusters of over-leveraged accounts face forced closure. These levels act as liquidity magnets. Market makers and aggressive momentum algorithms frequently drive price into these pockets to capture the resulting execution volume.
Mastering the Microstructure Panel
1. Micro-Price vs. Mid-Price Divergence
Recall from Part 1 that the Micro-Price (P_micro) weights the best bid and ask by the opposite side's available liquidity:
Δ_micro = Micro_Price - Mid_Price
Bullish Divergence (Δ_micro > 0): Asks are thin while resting bids are thick. Even if the nominal mid-price hasn't moved, the market is preparing to step higher.
Bearish Divergence (Δ_micro < 0): Bids are thin and vulnerable to being swept.
2. Tape Pattern Recognition
The Quant Terminal continuously scans trade execution velocity to identify:
Iceberg Orders: Large resting orders being replenished automatically by institutional algorithms without showing full size on the public book.
Absorption: High aggressive market volume failing to displace price, indicating a massive passive participant absorbing flow.
Playbook 1: The Perp Squeeze Hunter (Short Squeeze Setup)
This playbook aims to enter long positions just as an overcrowded short consensus is forced into catastrophic liquidations:
[Funding Rate Negative (<-0.015%)]
             +
[Squeeze Probability >= 75%]        ──> [PERP SQUEEZE SETUP] ──> Enter on CVD Breakout
             +
[High Short Liquidation Density Above]
Step-by-Step Setup Criteria
Derivatives Panel Check:
Funding Rate is negative ($-0.010%$ to $-0.030%$).
Squeeze Probability reads $ge 75%$.
A heavy short liquidation cluster is detected within 1.5% to 3.0% above the current price.
Order Flow Confirmation:
Cumulative Volume Delta (CVD) begins curling upward, indicating the arrival of early aggressive buyers.
$1M Dollar Bars print at least one [INST] bar with Close > VWAP.
Execution:
Enter a Long market/limit order upon the first breakout candle above local range resistance.
Stop-Loss: Placed directly below the low of the consolidation range (typically 1.2%–1.8% risk).
Take-Profit: Scale out 70% of the position inside the primary Short Liquidation Zone. When forced market buy orders execute, sell directly into their exit liquidity!
Playbook 2: Microstructure Divergence Reversal
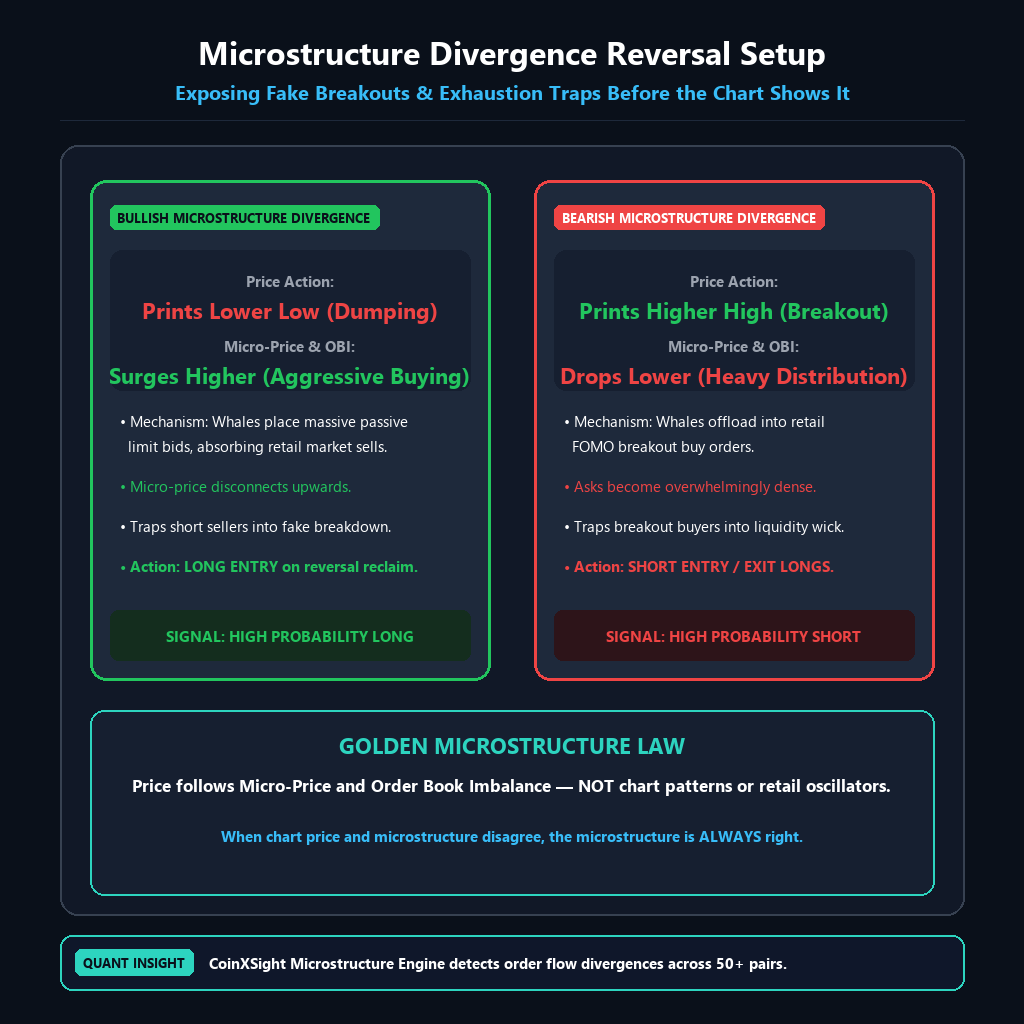
This playbook identifies exhaustion at market highs or lows by detecting divergence between nominal price action and underlying order book liquidity:
Price Prints New High ---> BUT Micro-Price Drops Below Mid-Price
                         +
                       OBI Flips Strongly Negative
                         │
                         ▼
             [BEARISH DIVERGENCE CONFIRMED]
           Enter Short / Take Profit on Longs
Despite price printing a higher high, the Microstructure Panel reveals P_micro < P_mid.
Order Book Imbalance (OBI) turns sharply negative ($<-0.20$), indicating that institutional players are posting heavy limit sell orders and refusing to bid higher.
Tape patterns detect Absorption or Bearish Icebergs at the high.
Execution:
Enter a Short position as soon as a $1M Dollar Bar completes with Close < VWAP and an [INST] tag.
Stop-Loss: 0.5% above the swing high.
Take-Profit: Target the nearest Microstructure Support Imbalance Zone.
Complete Series Summary: The Institutional Quantitative Edge
Over this 6-part masterclass, we have assembled the complete quantitative toolkit:
Dynamic volatility-scaled labeling; removes look-ahead bias and overfitting.
Part 3
Kelly Sizing & Perpetual Funding
Maximizes compound equity growth while insulating against liquidation ruin.
Part 4
CoinXSight 4-Step Pipeline
Systematic decision gate from Directional Bias to Pre-Trade, Flow, and Sizing.
Part 5
Whale Tracking & Dollar Bars
Decodes $1M VWAP and tick fragmentation to ride institutional block accumulation.
Part 6
Derivatives & Microstructure Playbooks
Exploits liquidation cascades and micro-price divergence for asymmetric risk/reward.
Your Quantitative Journey Begins Now
Markets are not won through intuition or emotions; they are mastered through statistical discipline, structural understanding, and relentless risk management.
Launch the CoinXSight Quant Terminal, apply the 4-step decision pipeline, and experience institutional-grade quantitative trading firsthand.
Learn Marcos López de Prado's Triple-Barrier Method, Meta-Labeling, and Purged Cross-Validation to eliminate overfitting in crypto algorithmic trading.