In cryptocurrency trading, more portfolios are destroyed by poor capital allocation than by incorrect directional signals. Even a strategy boasting a 65% win rate and a 2.0 profit factor will inevitably experience 7 to 10 consecutive losing trades across a multi-year horizon.
If a trader bets an arbitrary 10% or 20% of their balance per trade, the laws of ruin ensure eventual capital wipeout.
Quantitative funds approach risk from the opposite direction:
How do we mathematically maximize the long-term compound growth rate of equity?
How do we neutralize external market frictions such as Perpetual Funding Rates and Liquidation Cascades?
This guide examines the mathematical derivation of the Kelly Criterion, explains why institutional quant desks mandate Half-Kelly, and dissects the microstructure mechanics of crypto perpetual futures funding rates based on recent academic literature.
The Kelly Criterion: Maximizing Geometric Capital Growth
Originally formulated by John L. Kelly Jr. at Bell Labs (1956) and adapted for quantitative trading by Edward O. Thorp and Ernest P. Chan, the Kelly Criterion answers a fundamental question: Given an edge, what exact percentage of wealth should be wagered to maximize exponential growth?
1. Single Asset Formulation
For a binary trade outcome with win probability p, loss probability q = 1 – p, and payoff ratio b (Win Size / Loss Size):
f* = (p × b - q) / b = p - (q / b)
If f* <= 0: The strategy has zero or negative expected value. Optimal allocation is exactly 0.
If f* > 0: f* represents the exact fraction of portfolio equity to risk.
2. Multi-Asset Matrix Formulation (Ernie Chan)
In modern multi-asset quantitative crypto portfolios, assets correlate heavily. In Quantitative Trading (Wiley, 2009), Ernest P. Chan established the multi-asset Kelly vector equation:
F* = C^(-1) × M
Where:
M = [m_1, m_2, …, m_n]^T is the vector of expected excess returns.
C is the $n times n$ covariance matrix of asset returns.
F* = [f_1*, f_2*, …, f_n*]^T is the vector of optimal leverage allocations.
By multiplying the inverse of the covariance matrix (C^-1) by expected returns ($M$), the Kelly formula automatically hedges co-movements and penalizes highly correlated assets.
Why Institutional Desks Mandate "Half-Kelly"
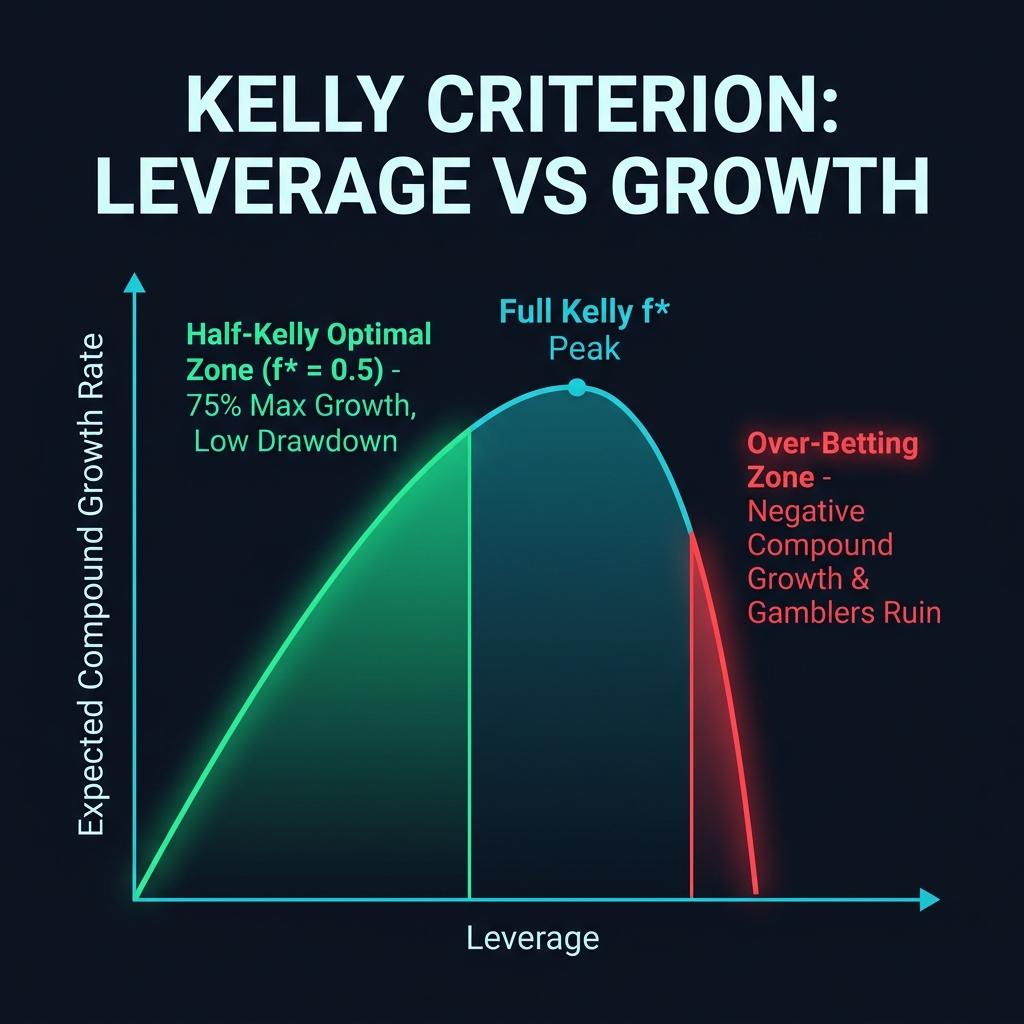
In theoretical mathematics with infinite trials and perfectly known parameters, full Kelly maximizes capital accumulation. In live crypto trading, applying full Kelly (1.0 × F*) is financial suicide.
The Three Pathologies of Full Kelly
Parameter Uncertainty: In real markets, expected return vector $M$ and covariance matrix C are statistical estimates, not known constants. If your true win rate is 54% but your historical sample estimated 58%, full Kelly drastically over-allocates.
Extreme Volatility & Drawdown: Full Kelly has a 33% probability of suffering a 50% account drawdown before doubling capital. For fund managers and individual traders alike, such drawdowns trigger psychological panic or fund liquidations.
Fat-Tailed Black Swan Shocks: Crypto return distributions possess fat tails (excess kurtosis). Extreme slippage or exchange outages violate Gaussian assumptions.
The Half-Kelly Solution
To insulate capital against model error while capturing over 75% of maximum theoretical growth, quantitative architectures enforce Half-Kelly:
f_safe = 0.5 × F* (Half-Kelly Formula)
Half-Kelly cuts portfolio variance by 75% and slashes maximum expected drawdown by more than half, providing a massive buffer against unexpected volatility spikes.
Microstructure of Perpetual Futures Funding Rates
Unlike traditional quarterly futures contracts that converge to spot price upon expiration, Crypto Perpetual Futures (Perps) have no delivery date.
To anchor the perpetual contract price (P_perp) to the spot index price (P_spot), exchanges employ a periodic Funding Rate Mechanism (settled every 8 hours or 1 hour).
The Clamp-and-Cap Funding Function
Based on the institutional microstructure framework by He, Wang, and Zhang (Perpetual Futures Funding Rate, Limits to Arbitrage, and Market Stability, SSRN-6185958):
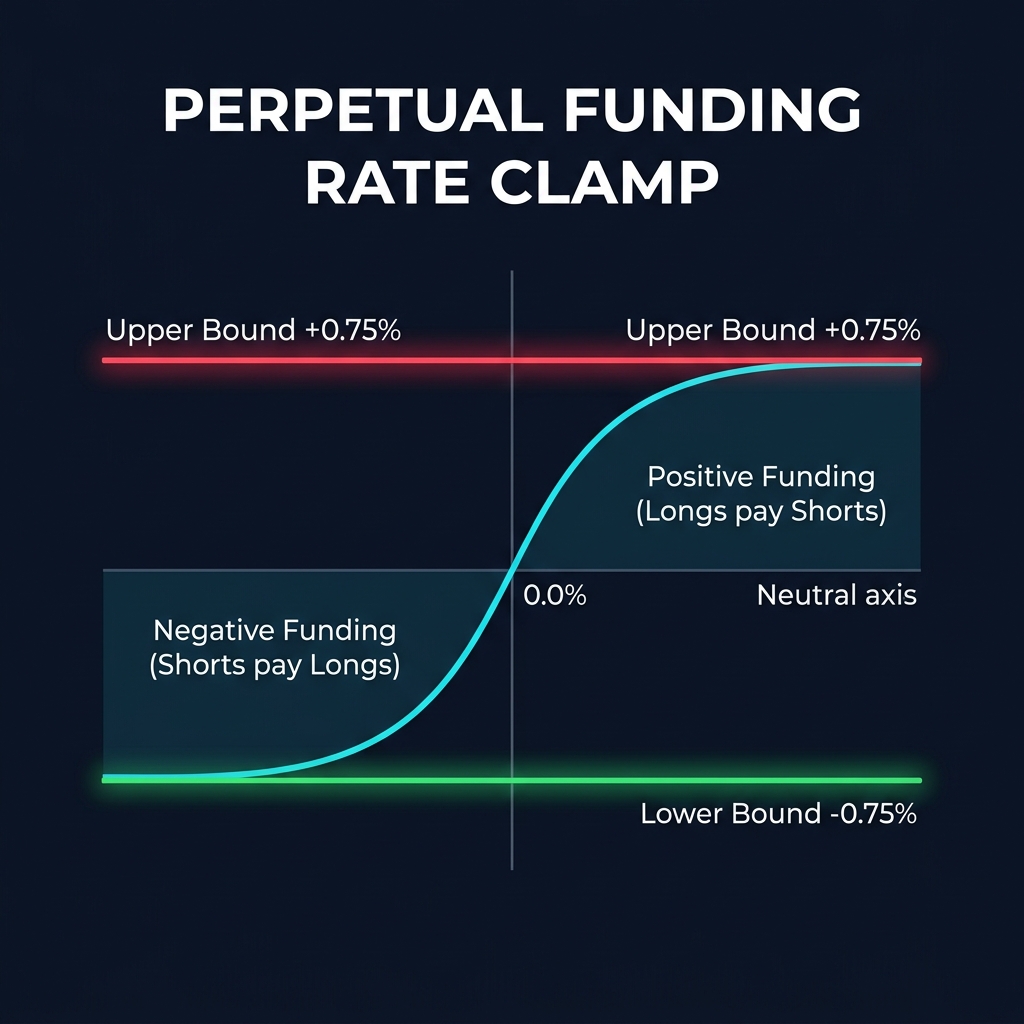
The funding rate is calculated via an interval-mean premium index Premium Index, clamped and capped to prevent market failure:
When Funding Rate $> 0$ (Bullish Speculation): Perpetual price trades at a premium to spot. Long traders pay Short traders.
When Funding Rate $< 0$ (Bearish Panic): Perpetual price trades at a discount. Short traders pay Long traders.
The Arbitrage Capital Bottleneck (W_n)
In theory, basis arbitrageurs (delta-neutral funds holding Long Spot and Short Perp) collect positive funding rates, restoring price parity.
However, He et al. demonstrate that when market volatility surges, arbitrage capital (W_n) becomes constrained by margin requirements. When the funding rate hits the Capped Branch (f_max), arbitrageurs can no longer absorb selling or buying pressure:
This triggers directional Liquidation Cascades.
The market enters an Infeasibility Region, where mechanical liquidations feed further slippage, completely uncoupling derivatives from spot fair value.
Institutional Risk Engine Architecture
To safeguard algorithmic capital, a production quant engine wraps the Kelly sizing module inside multi-tiered safety constraints:
[Signal Generated]
        │
        ▼
[Soft Limits: Half-Kelly Sizing] ──> f* = 0.5 * C^-1 * M
        │
        ▼
[Hard Limits Check]
  ├── Max Single Position: ≤ 25% Portfolio
  ├── Max Net Account Leverage: ≤ 3.0x
  └── Max Rolling Drawdown: ≤ 15.0%
        │
        ▼
[Circuit Breakers / Kill-Switch]
  ├── WebSocket Heartbeat > 5.0s Timeout?  ──> CANCEL-ON-DISCONNECT (CoD)
  └── Drawdown ≥ 15% Hard Limit?            ──> FREEZE & FLATTEN ALL POSITIONS
        │
        ▼
[Order Approved & Routed to OEMS]
1. Volatility Targeting
Rather than maintaining constant nominal exposure, the engine adjusts exposure inversely to market volatility:
Exposure Target = Target Volatility / Current Asset Volatility
When Bitcoin's annualized volatility doubles from 30% to 60%, position sizes are halved automatically, preserving constant dollar risk.
2. Kill-Switch & Cancel-on-Disconnect (CoD)
If the trading daemon loses communication with the exchange WebSocket for more than 5,000 milliseconds, resting limit orders in volatile books become toxic inventory. The engine automatically transmits immediate mass cancellation orders and shifts to a defensive read-only posture.
Calculate Expectancy: Never risk capital without a mathematically validated edge (f* > 0).
Always Enforce Half-Kelly: Scale theoretical Kelly sizing by 0.5 to survive parameter estimation error and black swans.
Account for Funding Drag: Never hold multi-day swing positions in perpetual futures without factoring the compound cost of periodic funding settlement.
Define Hard Drawdown Floors: Establish an immutable Kill-Switch threshold (e.g., 15% maximum drawdown) that programmatically halts trading.
🛠️ Next Up: Putting Theory into Practice.
How does a professional trader execute this math in real time without manually crunching matrices?
Learn Marcos López de Prado's Triple-Barrier Method, Meta-Labeling, and Purged Cross-Validation to eliminate overfitting in crypto algorithmic trading.
AI-powered risk management is transforming how traders protect their crypto portfolios. Learn how machine learning detects portfolio risk, prevents drawdowns,…