Support and Resistance Explained: How to Find Key Price Levels in Crypto
Learn how support and resistance zones form, why price reacts at certain levels, and how to identify breakouts and fakeouts using CoinXSight's Chart Pro and Deep Alpha.
MC
Marcus ChenSenior Quantitative Strategist·Apr 1, 2026 · 9 min read · Updated Oct 6
Support is a price zone where buying pressure consistently exceeds selling pressure, preventing price from falling further. Resistance is a price zone where selling pressure consistently exceeds buying pressure, preventing price from rising further.
These concepts are the foundation of all chart-based trading. Every candlestick pattern, indicator signal, and trade plan ultimately reduces to one question: where are the key support and resistance levels?
Support and resistance are not exact prices — they are zones. A support "line" at $65,000 might actually represent a zone from $64,700 to $65,200 where multiple buyers placed orders. This is why experienced traders draw zones, not thin lines.
Why Do These Levels Exist?
Price levels become support or resistance because of concentrated order placement and psychological memory:
Order clustering: Large traders (institutions, market makers) place limit orders around significant levels. These orders create liquidity pools that absorb selling or buying pressure.
Psychological anchoring: Traders remember where they bought or sold. A trader who bought BTC at $60,000 feels vindicated when it returns to that level and may add to their position — creating support.
Round numbers: $50,000, $100,000, $1.00 — these attract disproportionate order volume because humans anchor to clean numbers.
Historical significance: Price levels that have been tested repeatedly in the past accumulate more orders over time. The more times a level holds, the stronger it becomes.
The 5 Types of Support and Resistance
1. Horizontal Support & Resistance
The simplest form. Price previously reversed at a specific level, leaving a visible "bounce" on the chart. The more times price tests a level and reverses, the stronger that level becomes.
How to identify on CoinXSight Chart Pro:
Open Chart Pro → select your token
Use the Draw tool to place horizontal lines at swing highs (resistance) and swing lows (support)
Look for levels where price reversed at least 2-3 times
2. Dynamic Support & Resistance (Moving Averages)
EMAs act as moving support and resistance levels. CoinXSight's analysis engine computes three EMAs that function as dynamic S&R across multiple modules:
EMA
Function as S&R
EMA 34
Short-term dynamic support/resistance — price reacts here during pullbacks in active trends
EMA 89
Medium-term — holds during deeper pullbacks; a break below often signals trend weakness
EMA 200
Long-term "line in the sand" — widely watched by institutions; a break below can trigger capitulation
3. Trendline Support & Resistance
Diagonal lines connecting ascending swing lows (uptrend support) or descending swing highs (downtrend resistance). Use Chart Pro's Draw tool to connect at least 2-3 touch points.
4. Psychological Levels
Round numbers ($50K, $100K, $1.00) act as support/resistance because of order concentration. BTC at $100,000 attracted historic selling pressure in January 2025 — not because of any technical reason, but because thousands of traders placed sell orders at that psychologically significant number.
5. Order Block Zones (Smart Money)
Institutional-grade support and resistance created by large players. CoinXSight automatically identifies these through its Smart Money Concepts engine, with results surfaced in Deep Alpha, Chart Pro, and Discovery:
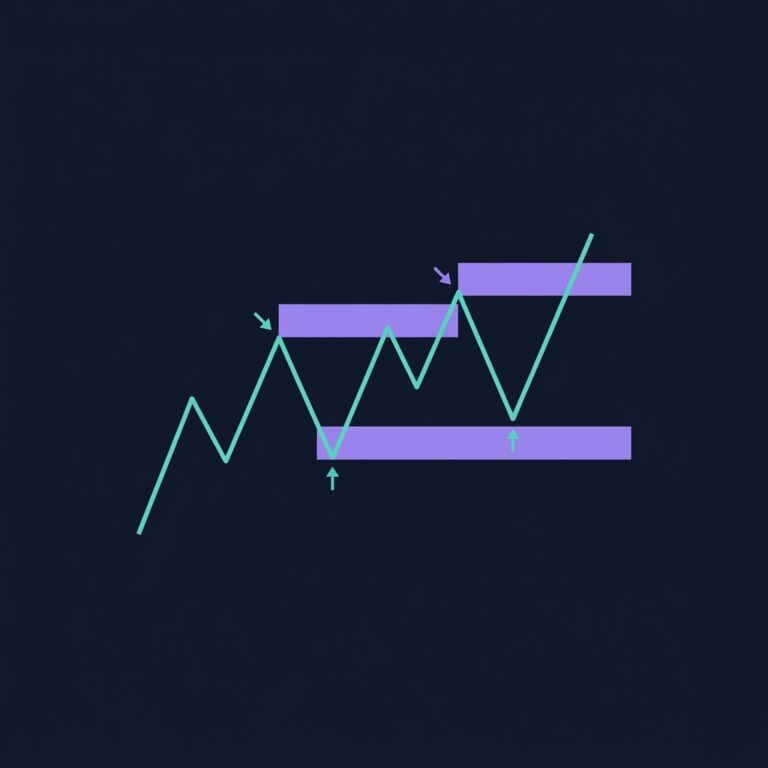
Bullish Order Block → the last bearish candle before a strong move up → acts as future support
Bearish Order Block → the last bullish candle before a strong move down → acts as future resistance
This is where crypto technical analysis becomes practical — a quality crypto analytics platform will display these signals in real time, helping you act on setups as they form.
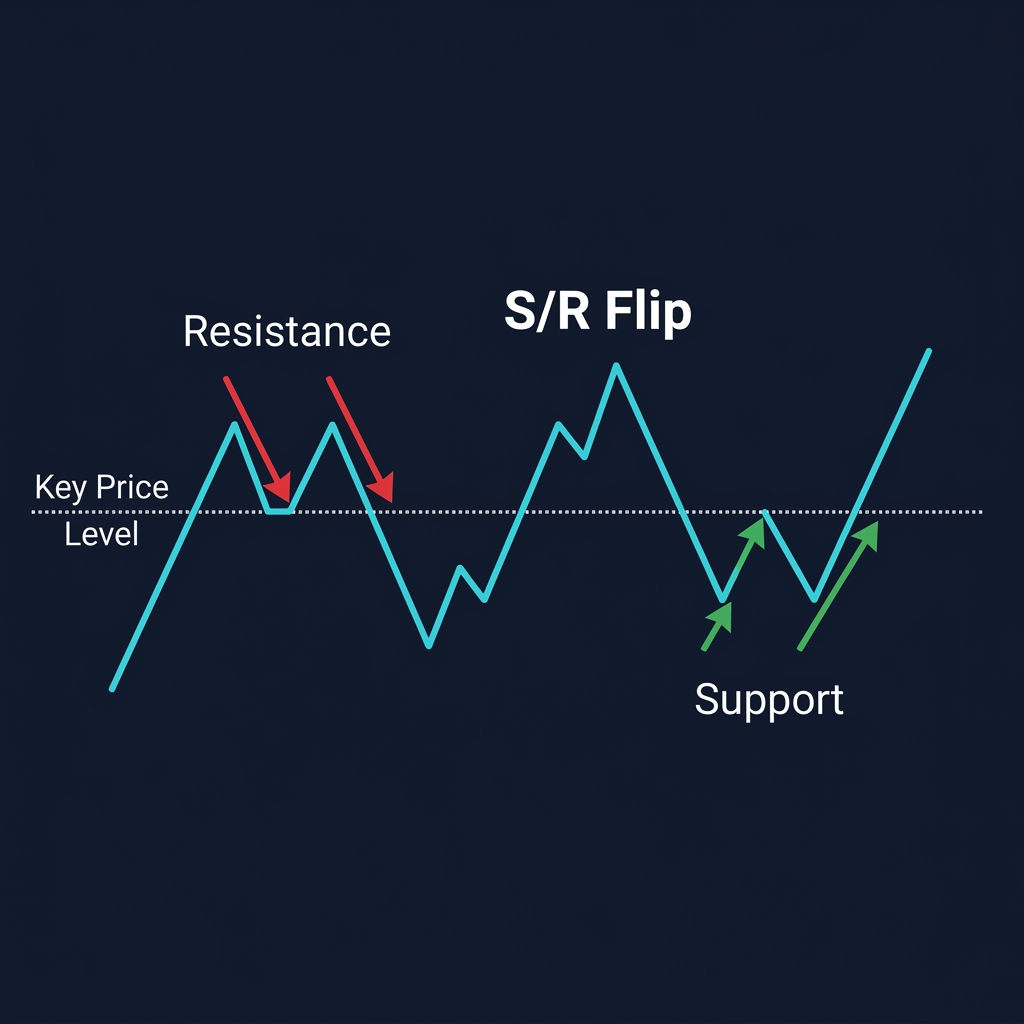
When price breaks above resistance, that old resistance becomes new support. When price breaks below support, that old support becomes new resistance.
This "flip" happens because:
Traders who sold short at resistance now have losing positions — they will buy to cover losses if price returns to that level, creating demand (new support)
Traders who missed the breakout place limit buy orders at the old resistance level, hoping for a pullback entry
Example — BTC, March 2026:
BTC spent 3 weeks testing resistance at $72,400. On March 15, it broke above $72,400 with a volume spike. Price then pulled back to $72,100 on March 18. Traders watching the S&R flip bought the pullback to the new support zone. BTC bounced from there to $76,800 over the next week.
On CoinXSight, this workflow played out across modules:
Chart Pro → visually identified the $72,400 resistance zone using the Draw tool
Deep Alpha → EMA 34 provided dynamic support at $71,800, confirming the zone
On-Chain → Whale accumulation increased during the pullback, adding confluence
Confluence Score → jumped from 5/10 to 8/10 when the pullback held above the flipped support
Real-World Scenario: Identifying a Fakeout
Not every breakout is real. Fakeouts (false breakouts) occur when price briefly crosses support or resistance but immediately reverses.
Scenario — ETH, May 2026:
ETH appeared to break above $2,600 resistance on May 3, briefly touching $2,640. Aggressive traders who entered on the breakout were trapped when ETH reversed sharply back below $2,600 within 4 hours.
How CoinXSight flagged the fakeout:
Volume: The breakout candle had below-average volume — genuine breakouts typically come with a volume surge of 150%+ above average
RSI: Already at 68 before the breakout — approaching overbought without much room to run
Confluence Score: Only 4/10 — the breakout lacked multi-layer confirmation
Whale Tracker: No significant whale buying during the breakout candle
The lesson: Always validate breakouts with volume and at least 2 other confirming factors.
⚠️ Limitation: Support and resistance zones are probabilistic, not deterministic. A level that held 5 times can still break on attempt #6. Macro events (Fed decisions, exchange hacks, regulatory news) can overwhelm any technical level. Always use stop-losses below support when long, or above resistance when short.
How to Trade S&R on CoinXSight — Multi-Module Workflow
Support and resistance is fundamental — but the way most traders draw lines is wrong. They treat exact price points as levels when the market trades in zones. Here is how I combine static S&R with CoinXSight's dynamic tools to build a complete picture.
Strategy 1: Bounce Trading (Buy at Dynamic Support)
Step 1 — Open Chart Pro → focus on the EMA ribbon as dynamic support/resistance. In the screenshot below, BTC shows three key dynamic levels:
EMA 34 ($80,196) — short-term dynamic support. Price bouncing off EMA 34 in an uptrend is the first level I watch.
EMA 89 ($80,832) — medium-term dynamic support. When EMA 34 breaks, EMA 89 is the next institutional reference.
EMA 200 ($80,832) — the macro trend line. Price below EMA 200 = bearish; above = bullish.
Currently, all three EMAs are converging — this tells me the market is in a compression phase. When EMAs stack tightly, a breakout (up or down) is imminent. I draw static horizontal levels at the most recent swing high ($82,400) and swing low ($79,000) to define the range.
Step 2 — Switch to Deep Alpha → check the Confluence Score and RSI before entering at support. Current reading: RSI 38.9 (approaching oversold) and Confluence: PARTIAL. RSI below 40 at a support zone is exactly what I want for a bounce trade. But PARTIAL confluence means not all layers agree — I reduce my position size to 0.5% risk instead of 1%. The auto-generated parameters show Entry: $80,021 — which aligns precisely with the EMA 89 zone from Chart Pro. When the platform's computed entry and the visual chart level agree, that is a higher-confidence setup.
Strategy 2: Breakout Confirmation with On-Chain
Step 1 — On Chart Pro, I have identified resistance at $82,400 (the stacked OB ▼ zones from the SMC overlay). A breakout above this level requires volume confirmation — not just a wick above.
Step 2 — Before entering a breakout trade, check On-Chain. The current reading: +$32.8M Exchange Inflow. This is bearish flow — capital is moving to exchanges for distribution. A breakout above resistance while whales are distributing is a classic fakeout setup. I would NOT enter the breakout until on-chain flow flips to net outflows (accumulation), confirming that institutions are backing the move.
Step 3 — Entry only when all three confirm: (1) price closes above resistance on 4H candle, (2) volume exceeds 150% of average, (3) On-Chain flow is net outflow. Stop-loss below the flipped level. Target: measure the range below resistance and project upward.
Common Support & Resistance Mistakes
Drawing too many lines: If your chart looks like a parking lot grid, you have too many levels. Focus on the 2-3 most significant levels per timeframe — the ones with the most touches and the clearest reactions.
Using exact prices instead of zones: Support at "$65,000" might actually be a zone from $64,700 to $65,300. Price rarely reverses at the exact pixel. Draw zones, not lines.
Ignoring timeframe hierarchy: A support level on a 15-minute chart is far weaker than one on the daily chart. Always identify your major levels on the daily or weekly chart first, then fine-tune on lower timeframes.
Trading against a strong trend: In a strong downtrend, buying at support levels is fighting the dominant force. Support levels in a downtrend are more likely to break than hold. Use trend indicators (EMA ribbon, Supertrend) to confirm the broader direction before trading S&R levels.
Frequently Asked Questions
How many times should a level be tested to be considered strong?
At minimum 2 touches, ideally 3 or more. Each successful test adds more orders around that level, strengthening it. However, each test also absorbs some of those orders — a level tested too many times (5+) may eventually break through as the order pool gets depleted.
What is the difference between support/resistance and Order Blocks?
Traditional S&R comes from visible price bounces on the chart — any trader can draw them. Order Blocks are specific institutional price action patterns identified through Smart Money Concepts — the last opposing candle before a large impulsive move. CoinXSight's Deep Alpha module detects Order Blocks automatically, adding a layer of institutional-grade S&R to your analysis.
Should I use support and resistance on any timeframe?
Higher timeframes produce stronger levels. Daily and weekly S&R levels carry the most weight because they represent the decisions of the largest traders. You can use 4H and 1H levels for fine-tuning entries, but always anchor your analysis to the higher timeframe levels first.
How do I tell if a breakout is real or fake?
Three validation checks: (1) Volume — a real breakout comes with 150%+ average volume. (2) Candle close — the candle must close above/below the level, not just wick through it. (3) Multi-factor confirmation — RSI, EMA direction, and whale flow should support the move. On CoinXSight, a Confluence Score of 6+/10 significantly reduces fakeout risk.
Can I automate support and resistance detection?
CoinXSight partially automates this through Order Block detection in Deep Alpha and EMA-based dynamic S&R. For horizontal levels, Chart Pro provides drawing tools. Fully automated S&R detection is on the platform roadmap for future releases.