Why retail traders misinterpret daily inflow headlines, how authorized participants (APs) execute creation/redemption arbitrage, and how to read institutional positioning beyond the surface numbers.
Over the past week, crypto market feeds have been inundated with polarized commentary regarding spot Bitcoin exchange-traded funds. Following a succession of volatile market sessions where Bitcoin tested the psychological $80,000 baseline, social sentiment oscillated wildly between declarations of institutional abandonment and promises of imminent supply crunches.
Both reactions suffer from a foundational misunderstanding of institutional market microstructure.
Spot ETF flows do not represent simple retail buying or selling. They are the visible footprint of a multi-tiered arbitrage and balance-sheet mechanism operated by Authorized Participants (APs), institutional market makers, and multi-strategy hedge funds. When hundreds of millions of dollars flow into or out of spot funds like BlackRock’s IBIT, Fidelity’s FBTC, or Bitwise’s BITB, the resulting market impact depends entirely on whether those flows represent organic directional accumulation, cash-and-carry basis unwinds, or Delta-neutral balance sheet rebalancing.
Learning to deconstruct daily ETF flow telemetry—separating synthetic noise from true spot accumulation—is the critical prerequisite for navigating modern digital asset markets.
1. Deconstructing the Mechanism: How ETF Creations and Redemptions Actually Work
To interpret institutional flow data, one must first dismantle the mechanical pipeline connecting broker-dealer orders to on-chain spot reserves.
Spot digital asset ETFs do not purchase underlying tokens on public retail order books when an end-investor buys a share on Nasdaq or the NYSE Arca. Instead, liquidity operates through a specialized primary and secondary market structure:
Secondary Market Trading: Retail and institutional investors trade ETF shares with each other on national stock exchanges throughout standard market hours (09:30 to 16:00 EST). The share price is kept tethered to the fund’s Net Asset Value (NAV) via continuous quoting from market makers.
The Creation / Redemption Mechanism: Only registered Authorized Participants (APs)—such as Jane Street, Virtu Financial, Goldman Sachs, or JPMorgan—have the legal right to transact directly with the ETF issuer.
Net Creation (Inflow): When secondary market demand pushes the ETF share price to a premium above its NAV, APs step in to sell overvalued ETF shares, simultaneously buying the underlying spot Bitcoin (or delivering cash to the issuer under the SEC’s cash-creation framework) to create new fund shares, capturing the arbitrage spread.
Net Redemption (Outflow): When selling pressure forces shares to trade at a discount to NAV, APs purchase the discounted ETF shares in the market, redeem them with the fund sponsor for the underlying value, and sell the underlying asset, thereby contracting total shares outstanding and restoring price parity.
2. The Three Critical Misconceptions in Reading Daily Flow Data
The widespread availability of daily flow tracking dashboards has created an illusion of total transparency. In practice, retail interpretations systematically stumble over three structural misconceptions:
1. Conflating Gross Inflows with Net Directional Buying
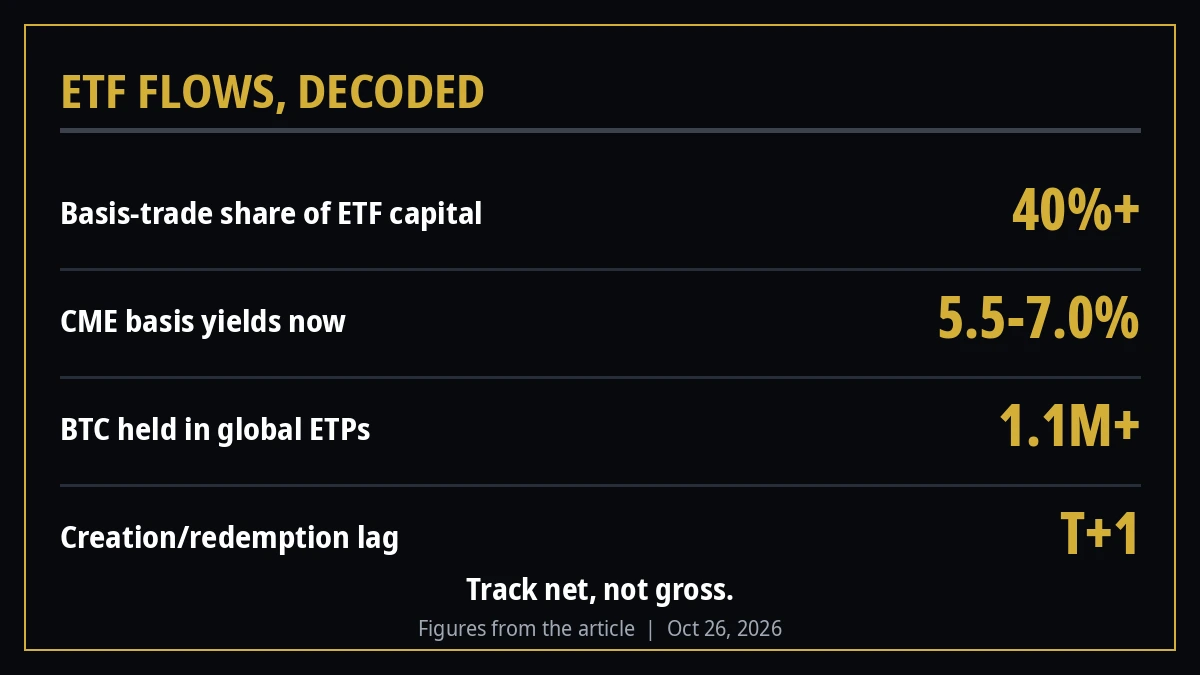
A headline reporting “$450M in daily ETF inflows” does not mean $450 million of net buying entered the spot market. Over 40% of institutional capital deployed in spot crypto ETFs since launch has been linked to the cash-and-carry basis trade. Institutional hedge funds purchase spot ETF shares while simultaneously selling an equivalent nominal value of CME Bitcoin futures to lock in an annualized, risk-free yield. This capital is entirely Delta-neutral; it creates no persistent upward price drift and will be unceremoniously unwound the moment basis yields compress.
2. Misunderstanding the T+1 Reporting Latency
Because primary creations and redemptions settle on a T+1 schedule after exchange close, published daily flow statistics represent trades executed during the previous trading session. When traders see a large inflow reported on a Tuesday morning, they are viewing the resolution of Monday’s positioning. Using published ETF flow prints as a real-time entry trigger frequently results in entering positions right as short-term momentum has exhausted itself.
3. Ignoring the Offset Between GBTC / Outflows and New Issuance
Total net flow is the only figure that governs aggregate market absorption. During market consolidation phases, localized redemptions from high-fee legacy vehicles or distressed estate liquidations can completely offset vigorous organic accumulation in low-fee products, masking aggressive underlying institutional adoption under a flat net headline figure.
3. The Institutional Playbook: How Smart Money Uses Flow Data
Institutional flow desks and quantitative market makers do not treat daily flow numbers as lagging news; they use them to map the structural liquidity balance across the entire trading ecosystem.
Key Tactical Signals Derived from Flow Telemetry:
Flow-to-Volume Divergence: When ETF net inflows remain strongly positive while spot volume on native exchanges dries up, it signals that institutional accumulation is absorbing liquid float off-exchange, setting the stage for sharp supply-side squeezes during subsequent volatility spikes.
CME Open Interest Alignment: By cross-referencing ETF creation velocity with CME Bitcoin futures open interest, analysts can identify whether capital expansion is driven by directional long exposure (bullish continuation) or basis arbitrage expansion (neutral carry).
The Multi-Day Flow Moving Average: Single-day flow spikes are often noise driven by single institutional rebalancing tickets. By contrast, a 5-day or 10-day exponential moving average of net flows provides a dependable gauge of institutional trend commitment, filtering out day-to-day noise.
4. Current Market Context: Institutional Positioning at the $80,000 Crossroads
As Bitcoin navigates the critical $79,500–$81,500 consolidation zone in late October 2026, flow telemetry highlights a distinct shift in institutional behavior:
Institutional Absorption at Support: Net redemption pressure across spot products has decelerated significantly compared to previous liquidation sell-offs. Even during sharp intraday dips below $80,000, secondary market volume displayed persistent premium spikes, indicating that institutional buyers were actively absorbing supply at discounted NAV tiers.
Basis Compression and Stabilization: CME basis yields have compressed to the 5.5%–7.0% range, purging hot-money speculative leverage and leaving behind a core base of long-term asset allocators and registered investment advisors (RIAs).
The Long-Term Accumulation Float: With over 1.1 million BTC now sequestered within global exchange-traded products, the available liquid inventory across centralized exchanges sits at multi-year lows. Any reversal in macroeconomic sentiment will encounter an order book environment with historically low sell-side depth.
5. Practical Framework: Integrating Flow Metrics into Your Trading Architecture
To extract actionable alpha from ETF flow data without falling victim to headlines, follow this four-step institutional workflow:
Track Net, Not Gross: Disregard individual issuer marketing PR. Focus exclusively on the aggregate net creation/redemption number across all approved spot products.
Normalize by 30-Day Rolling Float: Measure daily net flow as a percentage of total liquid exchange reserves. A $200M inflow into a depleted order book has five times the structural price impact of a $200M inflow during high-liquidity regimes.
Isolate the Basis Arbitrage: Monitor the spread between CME front-month futures and spot index prices. If inflows expand while basis yield expands in lockstep, treat the flow as neutral arbitrage rather than organic directional buying.
Wait for Settlement Alignment: Allow the market to digest the physical clearing of creations and redemptions before initiating swing exposure. The highest-probability setups occur when price retests a key support level exactly as a multi-day negative outflow trend flips back to positive net creation.
ETF flows have permanently altered digital asset price discovery. Those who learn the mechanics behind the plumbing will read institutional intent with clarity; those who trade the surface headlines will continue to serve as exit liquidity.
Data sources: Bloomberg Intelligence ETF Flow Telemetry; CME Group Commitments of Traders (COT); Farside Investors Aggregate Bitcoin ETF Data; CoinXSight Proprietary Market Microstructure Feed. Figures current as of October 26, 2026.
Follow CoinXsight for continuous institutional-grade market microstructure and regulatory analytics.
Disclaimer: This article is for informational, educational, and analytical purposes only and does not constitute financial, investment, legal, tax, or trading advice. Exchange-traded products, digital asset derivatives, and spot cryptocurrencies involve substantial financial risk, including the loss of principal. Past institutional flows do not guarantee future performance or price appreciation. Always conduct thorough independent due diligence before committing capital.
CX
CoinXSight Alpha Desk
ALPHA // DESK
Quantitative Research Desk·Global Alpha Division
CoinXSight Institutional Research Desk produces quantitative crypto market intelligence, algorithmic models, and on-chain forensics.
QUANTITATIVE SUITE // DEEP ALPHA ENGINEACTIVE
BTC/USDT // LIVE SCANNER
CONFLUENCE 74
LIVE SPOT PRICE$82,807.47WEAK_BUY
TP2
$89,522.75
+9.07%
TP1
$85,056.42
+3.63%
ENTRY
$82,078.86
ZONE
SL
$80,590.09
-1.81%
Auto-detect Order Blocks, Fair Value Gaps and risk-adjusted DCA ladders in < 5s.