Bitcoin Held $75,000 All Weekend — Now the Whole Week Comes Down to Tuesday’s CPI
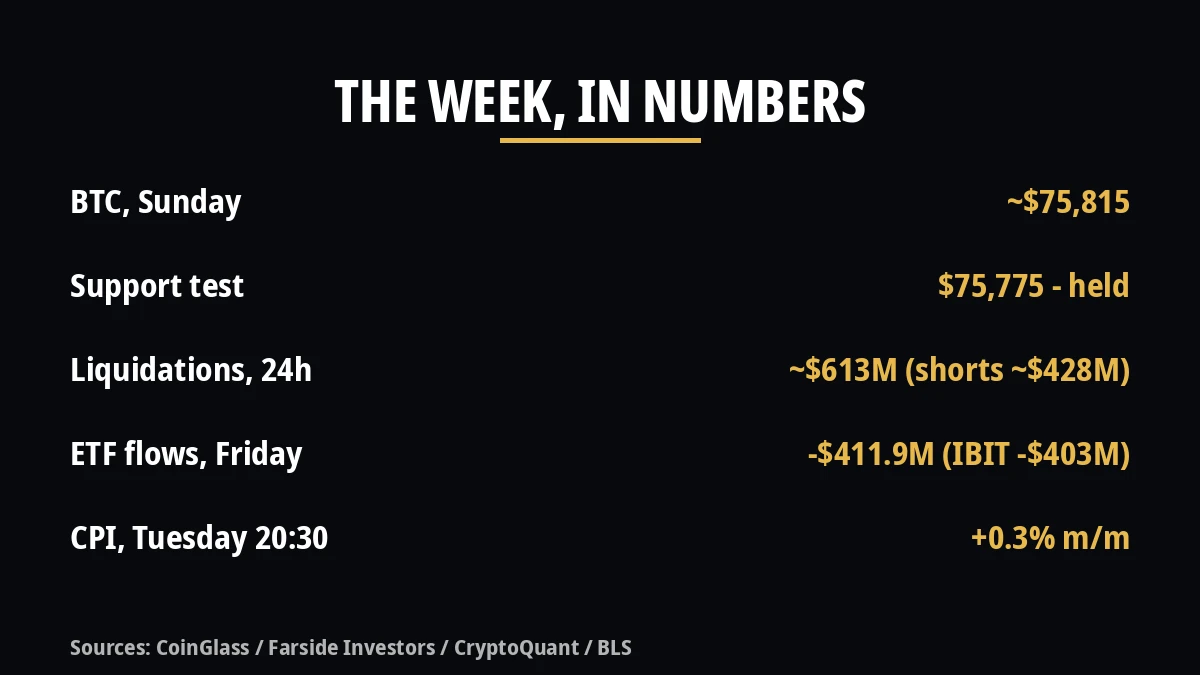
Bitcoin held $75,000 all weekend u2014 about $75,815 on Sunday morning, with the liquidation pain flipping from longs to shorts u2014 and now the whole week comes down to Tuesday's CPI, the last inflation print before the Fed's December 9 meeting. Forecasts are +0.3% m/m headline and +0.2% core, with no year-on-year figure this month.
CX
CoinXSight Alpha DeskQuantitative Research Desk·Nov 8, 2026 · Updated Nov 8
Bitcoin spent the weekend doing the one thing nobody was sure it could do: nothing. After dipping to $74,888 on Friday — its weakest since August 21 — and clawing back above $75,000 on the strength of a payrolls report that beat every forecast on Wall Street, the largest cryptocurrency traded at about $75,815 on Sunday morning in Vietnam, inside a $75,571–$76,250 range, with no fresh liquidation wave and no new low. The $75,000 line held. That is the whole story of the weekend, and it is also the setup for the week: a market that survived the worst two days of its autumn is now sitting still, waiting for the one number that can move it again — Tuesday’s consumer price index.
It is worth saying plainly what did not happen, because weekends after a rout are when the second leg usually arrives. It did not. Bitcoin’s overnight low never came close to Friday’s $74,888. The price is still sitting above its 50-week average near $75,556. Ethereum, at about $2,239, is flat on the session. The Crypto Fear & Greed Index reads 25, deep in Extreme Fear, but fear without fresh selling is a different condition from fear with it. Nothing in the tape says the bleeding has resumed. Nothing in it says it is over, either. That is what a holding pattern looks like, and this one has a deadline: Tuesday, 20:30 Vietnam time.
The weekend that didn’t break
Start with the levels, because the whole week will be argued in terms of them. The line that mattered on Friday was $75,000, and it matters for a reason that has nothing to do with round numbers. Short-term holders — buyers from the last one to three months — paid on average about $75,832 for their bitcoin, according to CryptoQuant data cited earlier in the week. Trading below that level means the most recent buyers in the market are underwater as a group. Bitcoin spent Friday under it, recovered above $75,000, and has now spent the weekend hovering just under the cost basis, close enough to threaten it and far enough below it to keep the pressure on.
The next lines up are $76,000 to $76,250, where sellers capped every attempt on Saturday, and the next line down is $75,775, the short-term support the market tested and held. Below that, the air thins fast: the 200-day moving average sits near $73,198, and there is little in the way of a natural floor between here and there. The 14-day RSI sat near 38 on Saturday — weak, but not yet oversold, which means the market has room to fall further without the technical case for a bounce getting any stronger. None of that is a prediction. It is a map of where the argument will be settled, and the settlement comes on Tuesday.
Friday’s payrolls report is the bridge into this week, and it needs exactly one sentence: October payrolls rose 165,000, against a consensus of 55,000 to 65,000, with 84,000 jobs of upward revisions to August and September, and the unemployment rate actually ticked down to 4.1%. That is why the market could not quite break on Friday even after the worst equity rout since April. It is also why the market could not rally: a hot labor market is good news for the economy and bad news for anyone hoping the Federal Reserve is done raising rates. Bitcoin’s answer — dip, recover, stall — was the honest one.
The flush flipped sides
The most interesting number of the weekend is not a price. It is a liquidation figure, and it points the other way from the one that dominated Thursday and Friday. Over the past 24 hours, about $613 million in crypto derivatives positions were liquidated, according to CoinGlass data reported on November 7 — but $428 million of that was shorts. The leveraged longs who were wiped out in the Thursday–Friday flush, roughly $1.05 billion to $1.27 billion of them, are mostly gone. What got liquidated over the weekend were the traders who bet the fall would keep going.
That matters because it tells you the structure of the market has changed. A market that liquidates longs is a market being forced down. A market that liquidates shorts while the price goes sideways is a market where the easy downside trade is crowded and the fuel for the next move down is thinner than it was. It does not mean the bottom is in — $613 million is still a large number, and the single largest liquidation in the window, a $74.98 million Binance BTCUSDT position, is a reminder that somebody large was still getting carried out. But the direction of the pain has flipped, and in a market this leveraged, the direction of the pain is often the direction of the next move’s resistance.
The institutional flow tells the same story from the other side of the trade. U.S. spot bitcoin ETFs recorded $411.9 million in net outflows on Friday, according to Farside Investors, and almost all of it was BlackRock’s IBIT, which lost $403 million in a single session. Fidelity’s FBTC went the other way, taking in $42.8 million. Across the five trading sessions from November 2 to November 6, the group lost about $1.28 billion, with IBIT accounting for roughly $1.21 billion of it. Ether funds lost $93.3 million on Friday and $365.2 million for the week. Two caveats belong here. First, ETF flows measure fund subscriptions and redemptions, not direct selling on exchanges, and they do not identify who is redeeming or why. Second, these outflows are less than 1% of total spot bitcoin ETF assets. But five straight sessions of IBIT redemptions, including $405.3 million on Monday and $403 million on Friday, is not noise. It is the largest fund in the category being used as the exit door, and it will keep being used that way until the price gives buyers a reason to come back through it.
Friday’s bounce was real — and narrow
Wall Street’s Friday session deserves a careful reading, because the headline and the substance point in different directions. The Nasdaq rose 1.09% to 24,579.42 and the S&P 500 added 0.31% to 7,376.86, while the Dow slipped 0.46% to 51,285.73 and the VIX fell 9.23% to 25.58. Chips led the bounce — AMD up 11.04%, Micron up 5.12%, Nvidia up 2.78% — which is to say the same stocks that led Thursday’s rout led Friday’s recovery. For the week, the Nasdaq still lost 3.4% and the S&P 2.7%.
That is a bounce, not a reversal, and the distinction matters for crypto. Bitcoin did not participate in Friday’s recovery in any meaningful way. It closed the week near $75,700, down about 2.2% on the week, while the Nasdaq managed to claw back a point on Friday alone. The correlation that dragged bitcoin down on Thursday — tech stocks fall, crypto falls harder — did not run in reverse on Friday. When the equity market stops falling and crypto does not rise, the market is telling you that crypto’s problem is no longer just the equity market. It has its own overhang: too much leverage, too many underwater recent buyers, and an ETF complex that is still seeing redemptions. The weekend’s stillness did not fix any of that. It just stopped it from getting worse before the data arrives.
The week in one view
This is the last full data week before the Federal Reserve meets on December 8–9, and it is built around a single print. Everything else on the calendar is either a warm-up act for Tuesday or a footnote to it.
Day
Event (Vietnam time)
Why it matters
Mon 09/11
China CPI/PPI Oct, 08:30; Goolsbee speaks 22:00
First Fed voice after the +165K jobs beat; China PPI forecast +5.2–5.4% y/y
Tue 10/11
US CPI Oct, 20:30
Last CPI before the Dec 9 FOMC; headline +0.3% m/m expected, core +0.2%; no year-on-year print
Wed 11/11
Veterans Day; MBA mortgage apps
Stocks open, bond market closed — no yield signal to read that day
Thu 12/11
Jobless claims, 20:30; existing home sales
First claims read since the 189K print, the lowest since 1969
Fri 13/11
US PPI Oct, 20:30
Closes the data week; headline +0.4% m/m expected (prev +1.3%), core +0.3%
Monday belongs to the speakers. Chicago Fed President Austan Goolsbee speaks at 22:00 Vietnam time, the first Federal Reserve official to comment in public since the jobs report landed, with Barkin and Bowman also on the schedule and Bank of England Governor Andrew Bailey speaking the same day. China releases October CPI and PPI at 08:30, before the market opens in Vietnam — CPI forecast at +0.8% year-on-year, PPI at +5.2% to +5.4%. None of it will move bitcoin on its own. What it will do is set the tone for the 48 hours before the print that does.
Tuesday’s CPI is the only number that matters
The October consumer price index arrives Tuesday at 20:30 Vietnam time, and it is the last inflation reading the Fed will see before it decides on December 9 whether to raise rates again. The forecasts are +0.3% month-on-month for the headline index, after +0.6% in September, and +0.2% for the core index, after +0.3%. Those are the numbers to watch. There is one number not to watch, and it is the trap this month: the year-on-year rate. The Bureau of Labor Statistics will not publish a 12-month CPI figure for October, because there is no October 2025 data to compare against after last year’s shutdown. Several week-ahead headlines are already quoting an expected annual rate near 3.7% — that is a model estimate, roughly the Cleveland Fed’s nowcast, not a Bureau print. Anyone writing 3.7% as the official year-on-year figure on Tuesday night will be wrong, and the correction will arrive in public.
The market’s framing is straightforward. A December hike is currently priced at roughly 74% to 77% depending on the venue — about 75.5% on CME FedWatch as of November 7, around 74% on the centralbank.watch futures model — up from about 70% before the payrolls report and down from the 82.7% seen earlier in the week. The payrolls beat pushed the odds up; the equity rout pulled them back down. CPI is the tiebreaker, and the two branches are clean.
A hot print — headline above +0.3%, core above +0.2%, with the details pointing the same way — sends the hike odds back toward 80% and puts $75,000 under immediate pressure again, this time with the weekend’s short liquidations already spent and the ETF complex still redeeming. A soft print — headline at or below +0.2%, core flat — gives the hold camp its best argument since the October meeting, and the first thing it would buy is a test of $76,000 to $76,250, the ceiling that capped every attempt this weekend. Either way, the move will be fast: the print lands at 20:30 Vietnam time, after the U.S. cash session has been open for six hours and with the full weight of a week of positioning behind it.
There is a third branch worth naming, because it is the one that usually gets forgotten. An in-line print — exactly +0.3% and +0.2% — changes nothing, and a market that has spent a week pricing a hike at three-to-one odds does not rally on confirmation. It drifts. For a market sitting on a cost-basis line with Extreme Fear on the dial, drift is not neutral. It is slow erosion, and slow erosion is how $75,000 gets tested again without any single dramatic event.
The CLARITY Act’s path through the Senate is the one non-macro thread still hanging over the market this week, and it is worth exactly one mention: a lame-duck session can still move it, and a regulatory headline is the kind of thing that breaks a holding pattern from a direction nobody was watching. It is not the base case for this week. The base case is inflation data, and everyone in the market knows it.
What to watch before Tuesday
Between now and the print, the checklist is short. Monday morning brings China’s inflation data at 08:30 — a downside surprise there would add to the global disinflation case, an upside surprise would not. Goolsbee speaks at 22:00 Monday night, and the market will parse every sentence for whether the Fed’s doves have absorbed the payrolls beat or are still looking for reasons to wait. Wednesday is Veterans Day: U.S. stocks trade normal hours but the bond market is closed, so there will be no yield signal to read that day — a fact worth knowing before anyone tries to read one into the tape.
The levels, one more time, because they are the whole trade until Tuesday: $76,000 to $76,250 above, where every rally died this weekend; $75,775 below, the support that held; $75,000, the line that defines the week; and $73,198, the 200-day moving average, the next stop if $75,000 gives way. Saturday’s positioning note made the same point from the other side: the quiet weekend is the setup, not the story. The story starts Tuesday at 20:30.
Bitcoin held $75,000 all weekend. That is a fact, and it is the only good news the market has produced in a week. Whether it means anything will be decided by a single inflation report, two days from now, in a market where the fear gauge reads 25, the largest ETF is still seeing redemptions, and the last print before the Fed’s December meeting is the one that counts. Hold the line until Tuesday, and the market gets to choose its direction with full information. Lose it before then, and the choice gets made for it.
Watch Tuesday’s CPI with us — and if you hold bitcoin through this week, know your levels before the print, not after it.
This article is for informational purposes only and does not constitute financial advice. Figures are cited from official releases and market data as reported at the time of writing and are subject to revision. Cryptocurrency markets are volatile; always do your own research before making investment decisions.
Disclaimer: This quantitative macroeconomic review and cryptocurrency market positioning analysis is published strictly for educational and informational purposes and does not constitute financial, investment, or trading advice. Digital asset markets carry significant capital risk and volatility. Always conduct independent due diligence (DYOR) before committing capital.
CX
CoinXSight Alpha Desk
ALPHA // DESK
Quantitative Research Desk·Global Alpha Division
CoinXSight Institutional Research Desk produces quantitative crypto market intelligence, algorithmic models, and on-chain forensics.
QUANTITATIVE SUITE // DEEP ALPHA ENGINEACTIVE
BTC/USDT // LIVE SCANNER
CONFLUENCE 74
LIVE SPOT PRICE$82,807.47WEAK_BUY
TP2
$89,522.75
+9.07%
TP1
$85,056.42
+3.63%
ENTRY
$82,078.86
ZONE
SL
$80,590.09
-1.81%
Auto-detect Order Blocks, Fair Value Gaps and risk-adjusted DCA ladders in < 5s.