Bitcoin Is Stuck Between $75,000 and $76,000 — and the Quiet Weekend Is the Setup, Not the Story
Saturday went quiet after the $1.05 billion liquidation wave u2014 Bitcoin pinned between $75,000 and $76,000, the forced long selling done and the late shorts now being squeezed, while spot ETFs bled another $411.9 million and the market waits for Tuesday's CPI.
CX
CoinXSight Alpha DeskQuantitative Research Desk·Nov 7, 2026 · Updated Nov 7
Nothing happened on Saturday. That is the whole story, and it deserves more attention than it sounds like.
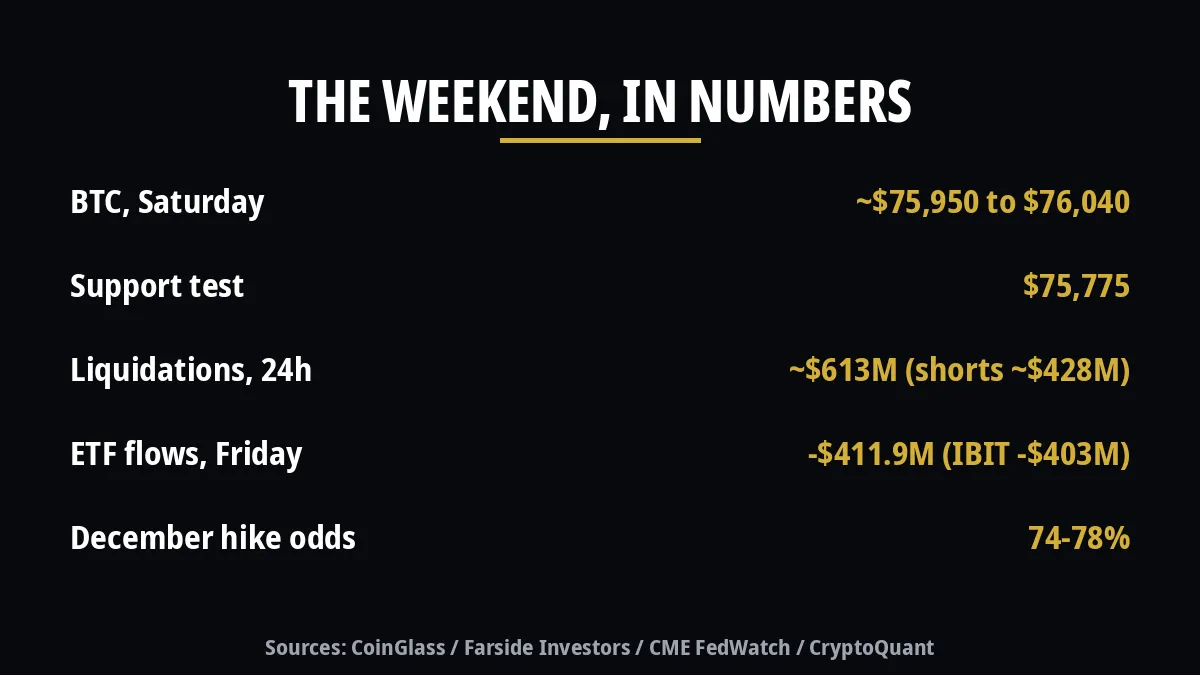
Bitcoin spent the Asian session and the morning in Vietnam pinned between roughly $75,950 and $76,040, barely moving from where the midday check left it at $75,850 to $76,018. The day’s range so far is $74,888 to $76,378, and the low of the day was printed hours ago, in the same overnight dip the morning article already described. Ether did the same thing in miniature, drifting between about $2,240 and $2,249 after closing Friday near $2,235. The Crypto Fear & Greed Index sits at 25, Extreme Fear, unchanged. Total crypto market capitalisation is about $2.53 trillion, and Bitcoin dominance is holding near 59 to 60 percent.
A market that has just lost $1 billion of leveraged longs in two days does not usually go quiet this fast. The quiet is the signal. Friday’s tape was a fight over a level. Saturday’s tape is the market deciding, in the absence of any new information, whether the fight is over — and the positioning data says it is not over, only paused. There is no American session today, no payrolls print, no Fed speaker on the calendar until Monday. The next thing that can actually move this market is Tuesday’s consumer price report, and everyone holding a position between $75,000 and $76,000 knows it.
The $75,775 test
The level doing the work this weekend is not the round $75,000. It is $75,775, the support line the tape has been testing since Friday, and Bitcoin is trading just above it — close enough that a single large sell order could print below it and change the whole weekend’s story. A close below $75,775 by the end of today would put the bears in control of the weekly close. A rebound and close above $76,005 would be the first small sign that buyers are willing to defend the band rather than just watch it.
The band is crowded because three different ways of measuring the market all point at the same $500 strip. The short-term holder cost basis — the average price recent buyers paid — sits near $75,832, according to CryptoQuant data cited this week, which means the average buyer of the last few months is right at breakeven. The 50-week moving average sits near $75,552, just below the price. The election-night low of $75,736 sits inside the band too. When a whole cohort of buyers slips underwater at once, the selling stops being about leveraged traders getting closed out and starts being about holders deciding to cut losses. That is why the band has absorbed so much volume without breaking, and why a break would matter more than the $500 involved suggests.
Above, the picture is just as defined. The 200-day moving average near $73,198 is the long-term support, but the 20-day and 50-day averages — $79,681 and $81,994 — are both sitting above the price, which is the chart’s way of saying the medium-term trend is still down. The 14-day relative strength index reads 38.19: momentum is weak, but not yet oversold, which means there is no mechanical reason for buyers to step in here and no capitulation signal either. The first job for any recovery is simply getting back through $76,000 and holding it. After that come $78,000 and $79,000, the old options max-pain line. Only above those does $80,000 stop being resistance and start being a target again, and nothing in this weekend’s tape suggests that conversation is close.
Ether’s version of the same story is weaker. It is trading near $2,240, below its 20-, 50- and 200-day averages, with support near $2,205 and the next obvious liquidity pools near $2,174 below and $2,450 above. It fell further than Bitcoin in percentage terms through the week, and it has recovered less. XRP, near $1.18 to $1.20, is the one name in the majors that looks like it is holding its ground rather than defending it.
The liquidation wave is over. The flip is the tell.
Here is where the weekend’s numbers need to be read carefully, because the headline figure going around is real and also easy to misuse. About $1.05 billion of crypto positions were liquidated over a 24-hour window, with 88.2 percent of them longs — Bitcoin accounting for $267.2 million and Ether about $167 million. That was the Thursday-to-Friday wave, the forced selling that carried Bitcoin from $80,000 to $75,000. It is not a new event. It did not happen on Saturday morning, and the Asian session today was quiet.
The newest rolling reading tells the next chapter, and it points the other way. As of Saturday morning, CoinGlass data cited by FastBull put total liquidations over the latest 24 hours at about $613 million across 142,735 traders — and roughly $428 million of that was shorts. The largest single liquidation in the window was a $74.98 million Binance BTCUSDT order. Read that plainly: the forced long selling that defined Thursday and Friday has run its course, and the traders being closed out now are the late shorts who piled in after the drop, betting the breakdown would keep going. The market flushed one side, then started flushing the other. That is what a bottoming process looks like in the derivatives data, even when the spot price has not moved at all.
Friday’s liquidation heatmap, the last full read before the weekend, explains why the price is stuck where it is. The largest long-liquidation cluster below the price sat at $75,206, about $147 million deep, with another $143.9 million at $75,057 — a combined $291 million of modelled long liquidity within $700 of the price. Above, the first serious short cluster was $91.3 million at $77,517, more than $1,000 away, with $85.9 million at $76,772 below it. Total modelled long liquidity below the price was $1.12 billion against $1.77 billion of short liquidity above, spread across a wider band. The asymmetry was the point: the nearest big fuel was downward, and a break of $75,000 would have run straight into both long clusters at once.
Saturday has not repriced that map, because the price has barely moved since it was drawn. The clusters are still sitting in the same places. What has changed is the flow through them: the 24-hour liquidation total has nearly halved from the $1.05 billion peak, and the balance has flipped from longs to shorts. The fuel is still there. The fire has moved to the other side of the trade.
The ETF bleed is the institutional tell
If the derivatives data says the leveraged flush is done, the spot ETF data says the institutional selling is not. US spot Bitcoin ETFs recorded $430.2 million of net outflows on Thursday, November 5, and another $411.9 million on Friday, November 6, according to Farside Investors data — a two-day bleed of about $842 million. Friday’s outflow was driven almost entirely by one fund: BlackRock’s IBIT accounted for $403 million of redemptions, with BITB at $20.5 million, ARKB at $20.1 million and GBTC at $11.1 million. Fidelity’s FBTC was the only fund to take in money, at $42.8 million. Ether funds lost about $100 million on Thursday and a further roughly $93 million on Friday, according to SoSoValue data.
The seven-day tally for Bitcoin ETFs now stands at about $1.91 billion of net outflows. The first four trading days of November alone took $869.8 million. And the year-to-date picture has quietly flipped: cumulative net flows for US spot Bitcoin ETFs in 2026 have turned slightly negative, down roughly $502 million since the start of the year, according to SoSoValue. The funds that spent 2024 and 2025 absorbing every dip are, for the first time in this cycle, net sellers on the year.
That is the number that should worry a holder more than any liquidation total. Liquidations are fast money being forced out; ETF flows are slow money choosing to leave. The leveraged flush can end in a day. An institutional redemption streak ends when the allocators behind it change their minds, and nothing in Friday’s payrolls print gave them a reason to — a strong labour market means a December hike, and a December hike means higher yields and a stronger dollar, which is the trade Bitcoin has been losing all autumn. The one counterweight in the data is Fidelity: FBTC took in $236.7 million on Wednesday before losing $199.9 million on Thursday and then pulling in $42.8 million on Friday, the only inflow on a day when every other fund bled. One buyer does not make a trend. But it is the only green shoot in a week of redemptions, and it is worth watching into next week.
Rates: the hike odds cooled, they did not collapse
The other number that moved this weekend is the December hike probability, and it moved in the direction the morning article did not expect. After Friday’s payrolls beat, the odds of a 25-basis-point rise at the December 8–9 meeting were quoted at roughly 77 to 78 percent. By Saturday, they had cooled a little — and the honest way to write the number now is as a range, because the venues no longer agree with each other.
Fed funds futures imply about 73.8 percent, according to centralbank.watch, updated at 03:20 UTC on Saturday. Kalshi’s prediction market sits at 76.5 to 77 percent as of Friday evening in New York. Polymarket is near 78 percent. Call it 74 to 78 percent depending on the screen, a little softer than the post-print peak, with a hike to 4.00–4.25 percent from the current 3.75–4.00 percent still the base case on every venue. The cooling is worth noting precisely because it is small: the market absorbed the strongest jobs report of the year, repriced a hike in, and then barely moved. The debate is not about whether December is a hike. It is about what Tuesday’s inflation print does to a hike that is already mostly priced.
That is the bridge this weekend builds toward. October consumer prices land on Tuesday, November 10, at 20:30 Vietnam time — the last inflation print before the Fed meets, and the one number that can still change the December argument. A hot CPI locks the hike in and leaves Bitcoin fighting a tightening cycle with a broken chart. A soft CPI, or a November payrolls number on December 4 that takes back some of October’s strength, reopens the debate fast. Friday’s producer prices, November 13, come after the CPI and matter less. Chicago Fed President Austan Goolsbee speaks on Monday, the first Fed voice after the payrolls report, and his tone will be read for any sign the committee is uncomfortable with how fast the market has priced the hike in.
The weekend in one view
Positioning
Where it stands
What it means next
Bitcoin tape, Saturday ~13:00 Vietnam time
Near $75,950–76,040; day range $74,888–76,378; essentially flat vs midday; ETH near $2,240–2,249
A quiet tape after a violent week — the market is waiting, not recovering
The $75,775 test
Support being tested; short-term holder cost basis near $75,832; 50-week average near $75,552; RSI 38.19; 200-day average near $73,198
A daily close below $75,775 puts bears in control; a close above $76,005 is the first small win for buyers
Liquidations, rolling 24 hours
About $613M total, roughly $428M of it shorts, 142,735 traders (CoinGlass via FastBull, Saturday morning); the $1.05B, 88.2%-long wave was Thursday–Friday, not today
Forced long selling has run its course; late shorts are now the ones being squeezed
Heatmap, Friday read
$147.2M long cluster at $75,206; $143.9M at $75,057; first big short cluster $91.3M at $77,517; $1.12B long liquidity below vs $1.77B short above
Nearest fuel is still downward; price has barely moved, so the clusters sit in the same places
ETF flows
BTC -$430.2M Thursday, -$411.9M Friday (IBIT -$403M, FBTC +$42.8M sole inflow); ETH about -$100M then ~-$93M; 7-day BTC -$1.91B; 2026 YTD slightly negative
Slow money is still leaving while fast money has stopped being forced out
December hike odds
74–78% by venue: futures-implied ~73.8% (03:20 UTC Saturday), Kalshi 76.5–77%, Polymarket ~78%; FOMC decides December 8–9
Hike still the base case, slightly cooled from the post-payrolls peak
Wall Street, Friday close
S&P 500 +0.31% to 7,376.86; Nasdaq +1.09% to 24,579.42; Dow −0.46% to 51,285.73; VIX 25.58; no session on Saturday
Narrow, chip-led bounce; weekly losses stand at Nasdaq −3.4%, S&P −2.7%
The bridge
CPI Tuesday November 10, 20:30 Vietnam time; PPI Friday November 13; Goolsbee speaks Monday; November payrolls December 4
CPI is the last print that can change the December argument before the Fed meets
What to watch
Watch $75,775 first, and watch it as a close, not a wick. The level has been tested all weekend without breaking, and every test spends some of the bids defending it. A daily close below it sweeps roughly $291 million of modelled long liquidity in one move and opens the $74,300 band, then Wintermute’s $73,000. A close above $76,005 does the opposite: it leaves the long clusters intact, puts the late shorts who were just squeezed on the wrong side of a second day, and gives the market something to defend into Tuesday.
Watch the ETF flows on Monday for the first sign of whether Friday’s $411.9 million was the end of the redemption streak or the middle of it. One fund, Fidelity, buying while everyone else sells is not a reversal. Two funds buying on the same day would be the start of one.
And watch Tuesday at 20:30 Vietnam time, because that is when the weekend ends. The payrolls report removed the recession excuse for owning Bitcoin as protection and left the tightening reality standing where the excuse used to be. The CPI print decides whether that reality gets harder or softer — and Bitcoin, pinned between $75,000 and $76,000 with its buyers at breakeven, its leverage flushed on one side and starting to flush on the other, and its institutional holders still heading for the exit, has spent the whole weekend waiting for the answer.
This article is for informational purposes only and does not constitute financial advice. Figures are cited from official releases and market data as reported at the time of writing and are subject to revision. Cryptocurrency markets are volatile; always do your own research before making investment decisions.
Disclaimer: This quantitative market positioning breakdown, orderflow telemetry, and derivatives structure analysis is published strictly for educational and informational purposes and does not constitute financial, investment, or trading advice. Digital asset markets carry significant capital risk and volatility. Always conduct independent due diligence (DYOR) before committing capital.
CX
CoinXSight Alpha Desk
ALPHA // DESK
Quantitative Research Desk·Global Alpha Division
CoinXSight Institutional Research Desk produces quantitative crypto market intelligence, algorithmic models, and on-chain forensics.
QUANTITATIVE SUITE // DEEP ALPHA ENGINEACTIVE
BTC/USDT // LIVE SCANNER
CONFLUENCE 74
LIVE SPOT PRICE$82,807.47WEAK_BUY
TP2
$89,522.75
+9.07%
TP1
$85,056.42
+3.63%
ENTRY
$82,078.86
ZONE
SL
$80,590.09
-1.81%
Auto-detect Order Blocks, Fair Value Gaps and risk-adjusted DCA ladders in < 5s.