Every few weeks, the same chart makes the rounds: a calendar of past altseasons, a red circle around next month, and a promise that the rotation is due. It is a comforting idea. It is also not how the money actually moves.
Altseason has never arrived because a date came up. It arrives when capital changes hands in a specific order — out of Bitcoin, into Ethereum, then down the risk curve — and that handoff leaves fingerprints. Right now, on the morning of October 25, every one of those fingerprints points the other way. Bitcoin dominance sits at 59.5 percent of a $2.73 trillion market. ETH/BTC trades at 0.0292, within sight of its weakest levels of the cycle. And the one gauge that briefly flashed “altseason” a month ago has been quietly giving the signal back ever since.
This is not a call that altcoins are finished. It is a framework for knowing — before the crowd does — when the rotation is real, and for recognizing why the most-quoted argument for it, record global liquidity, is currently proving less than it appears.
The Scoreboard: Four Gauges, One Verdict
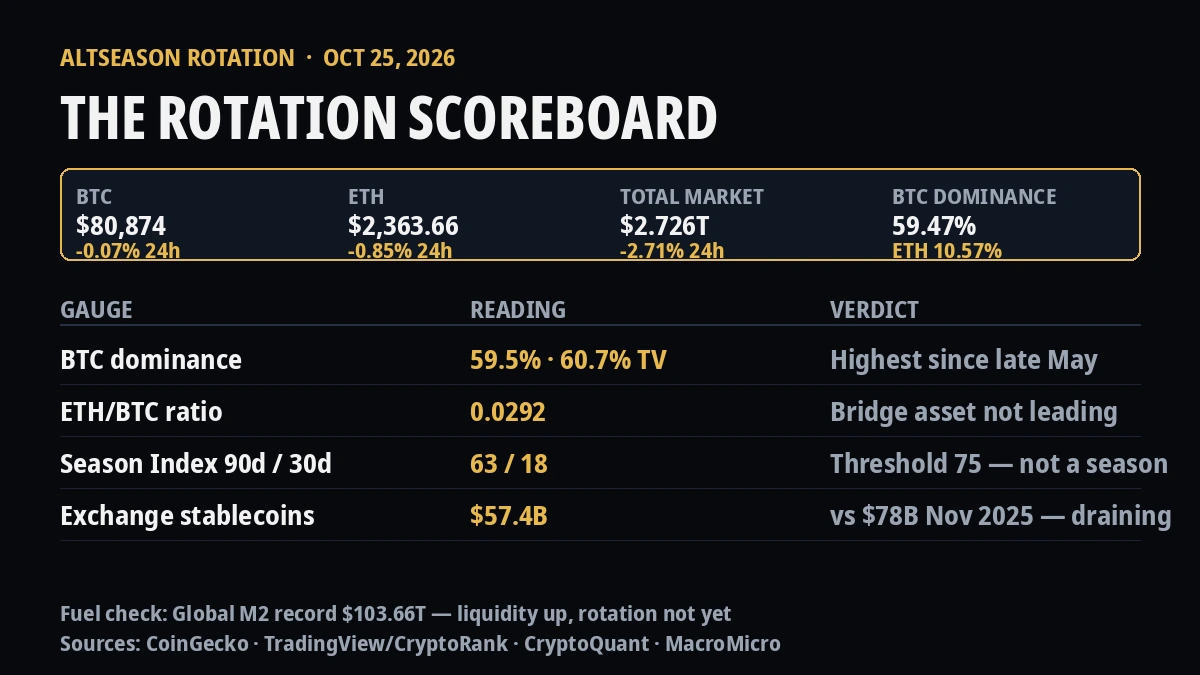
The Rotation Scoreboard: Bitcoin Dominance, ETH/BTC Ratio and Global M2 Liquidity (CoinXSight Telemetry)
Start with dominance. Bitcoin’s share of total crypto market value is 59.5 percent this morning on CoinGecko’s market-wide measure; TradingView’s narrower top-asset index puts it nearer 60.7 percent, the highest reading since at least late May. The direction matters more than the decimal: dominance has climbed from roughly 59 percent in late September, pushed through its early-September high, and kept rising through October’s flush. In a genuine rotation, this line rolls over and stays down for weeks. It has not even flattened.
Second, the ETH/BTC ratio — the hinge of every historical rotation. Ethereum is the bridge asset: capital leaving Bitcoin historically parks in ETH first, and only when ETH is outperforming does risk appetite spill into the long tail. At 0.0292, ETH is not leading anything. It fell 0.85 percent in the last 24 hours against Bitcoin’s flat tape, and the ratio has spent the autumn grinding along its lows. A rotation that skips the bridge has, in every prior cycle, turned out to be a handful of isolated pumps rather than a season.
Third, breadth. The Altcoin Season Index — the share of the top 50 altcoins that have beaten Bitcoin over 90 days — reads 63 out of 100 this morning. That is the transition zone, not a season; the threshold is 75. The same index’s 30-day version reads 18, deep in Bitcoin-season territory, because the 90-day window still contains August and September’s gains while the recent month has been a steady give-back. The index did touch 75 on September 27 — for a day, with dominance at 58.3 percent. In confirmed seasons of prior cycles, dominance was in the low-to-mid 40s when breadth peaked. A one-day breadth spike against near-60 percent dominance is a head fake, and October has treated it as one.
Fourth, the fuel gauge nobody watches: stablecoin reserves on exchanges. CryptoQuant data puts ERC-20 stablecoin balances on exchanges at about $57.4 billion, down from almost $78 billion in November 2025. That is the dry powder that funds altcoin speculation, and it has been draining for a year. Seasons are bought with sidelined dollars. The sideline is thinner than it was.
Rotation Gauge
Reading (Oct 25)
What a Real Season Needs
Status
Bitcoin dominance
59.5% (CoinGecko); ~60.7% (TradingView index)
Sustained rollover, weeks of lower highs
Opposite — rising since late Sept
ETH/BTC
0.0292
Reclaim and hold a rising trend
At cycle lows, still slipping
Altcoin Season Index (90d)
63/100; 30d version: 18/100
75+ held, not touched for a day
Transition zone, breadth narrowing
Exchange stablecoin reserves (ERC-20)
~$57.4B, vs ~$78B in Nov 2025
Rising sidelined capital
Draining for a year
Global M2 (4 major economies)
Record $103.66T in August; ~4.5% growth at fixed FX
Accelerating growth, not just record levels
Level record, pace ordinary
The M2 Argument — and Why It Is Not Enough
The bull case for an imminent rotation usually ends with one chart: global money supply at a record. The numbers are real. M2 across the US, euro area, China and Japan hit a record $103.66 trillion in August, up more than $1 trillion in that month alone — a tenth consecutive monthly increase. US M2 alone set a record at $23.34 trillion, up 5.7 percent year over year; China’s grew 7.5 percent.
But a record level is not the same as accelerating liquidity, and the distinction is where the argument breaks. Measured at fixed exchange rates — stripping out the effect of a softer dollar inflating foreign money supplies when converted — global M2 growth is running near 4.5 percent, roughly a third of its 2021 peak pace. And the market has already run the experiment: liquidity has printed record after record through 2026 while Bitcoin trades roughly a third below its October peak and altcoins have bled against it for a year. In the 2025–2026 tape, the M2-to-crypto transmission has visibly weakened — money is being created, but at the margin it is funding governments and money-market yields, not rotating down the crypto risk curve.
None of this makes M2 useless. It makes it a background condition rather than a trigger. Liquidity tells you the tide is in. Dominance, ETH/BTC and breadth tell you which boats it is lifting. Right now it is lifting exactly one.
Why This Cycle Keeps Refusing to Rotate
Two structural changes explain why the old calendar keeps failing. The first is the ETF wrapper. Institutional flow in this cycle arrives through regulated products that exist for Bitcoin and, more recently, Ethereum — and essentially nothing else. A pension allocator “buying crypto” is buying BTC dominance by construction. The 2021 rotation ran on retail leverage and exchange listings; the 2026 bid runs through tickers that stop at the top two assets.
The second is supply. Thousands of tokens now compete for the same speculative dollar that once concentrated in a few hundred, and scheduled unlocks keep adding sell-side inventory — reports this week alone flagged more than $1 billion in tokens unlocking. In prior cycles, a rising tide met a fixed fleet. This cycle’s fleet doubles while the tide comes in at 4.5 percent.
Add the immediate backdrop and a weekend rotation looks even less likely: Bitcoin is pinned near $80,900 after Thursday’s two-way liquidation flush, spot ETFs have printed back-to-back outflow days, and the FOMC lands Wednesday with a 92.8 percent priced hold and December’s hike odds as the real fight. Rotations are born in calm, rising markets — not four days before a hawkish-hold decision with Brent crude at a seven-month high.
What Would Change the Call
Frameworks earn their keep by stating their own invalidation. Three developments, together, would flip this reading:
Dominance rolls over with conviction — not a one-day dip, but a break of the autumn uptrend and lower highs over two to three weeks. ETH/BTC reclaims ground — the ratio pushing back through the low 0.03s and holding, with ETH leading on up-days rather than lagging on down-days. Breadth confirms — the 90-day index back above 75 and staying there while the 30-day index climbs out of the teens, ideally alongside exchange stablecoin reserves turning up.
Until then, isolated altcoin spikes — and there will be some; there were two in the top 50 this week alone — are trades, not a season. The calendar says it is time. The money says it has not moved. When the two disagree, follow the money.
Disclaimer: This article is for informational and educational purposes only and does not constitute financial advice. Cryptocurrency markets are volatile and carry substantial risk of loss. Indicator readings (dominance, ETH/BTC, Altcoin Season Index, stablecoin reserves, M2) are snapshots that change continuously and are measured differently across providers; past cycle patterns do not guarantee future market behavior. Do your own research before making any investment decision.