Bitcoin Swept $80,000 to $75,000 in a Night — and the Liquidation Heatmap Says the Next Move Runs Downhill
Bitcoin swept from $80,000 to $75,000 overnight with more than $1 billion in longs liquidated. The liquidation heatmap shows the next fuel sits just below the price u2014 a $147 million long cluster at $75,206 u2014 while Saylor posts 'Feeling u20bfullish' from a market trading at Strategy's own average cost.
CX
CoinXSight Alpha DeskQuantitative Research Desk·Nov 6, 2026 · Updated Nov 6
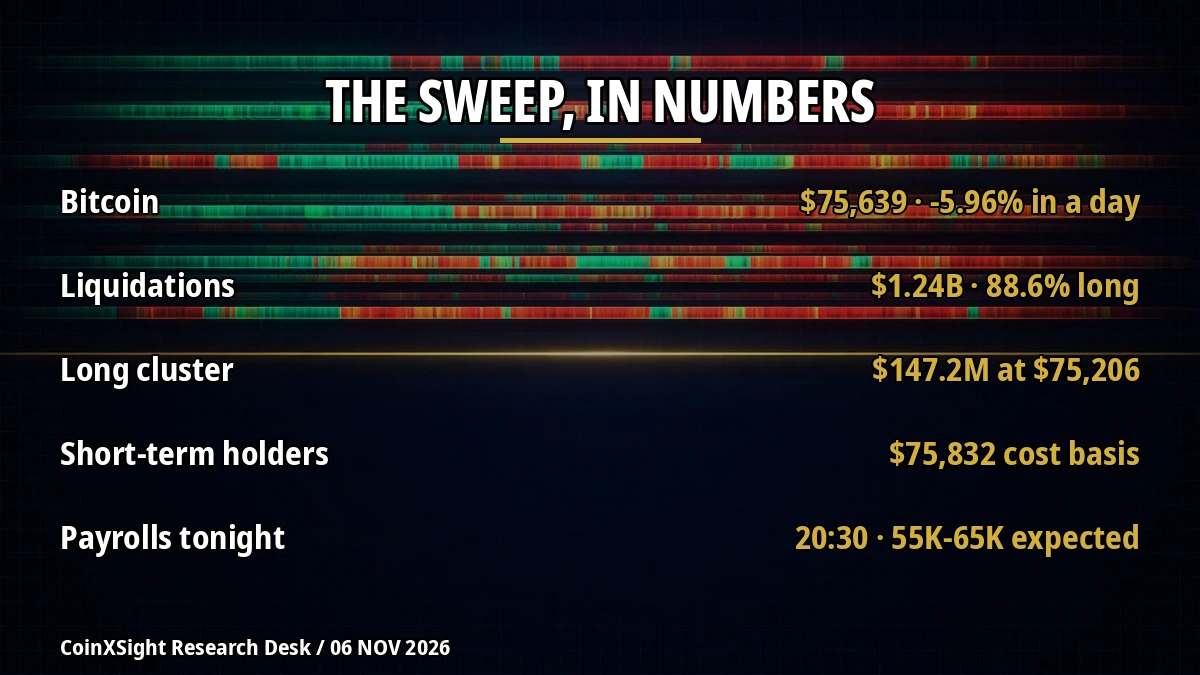
Bitcoin did not drift to $75,000. It was taken there. In one overnight session the market erased the entire post-election recovery, broke $80,000, $79,000, $78,000 and $76,500, and stopped only when it found the one level where the most leveraged longs in crypto are stacked: $75,000. By Friday afternoon in Vietnam, Bitcoin traded near $75,639, down 5.96 percent on the day, and the liquidation heatmap showed the largest single long cluster in the market sitting $147 million deep at $75,206 — less than one percent below the price. The sweep is not over. The map says the next one runs downhill.
The sweep, level by level
Thursday’s session in the United States did the damage, and the overnight hours finished it. Bitcoin opened Friday at $80,426, printed a high of $80,794, and then fell in a straight line to $75,208, its lowest since mid-September. The close of the American session told the same story in equities: the Nasdaq Composite down 5.52 percent, the S&P 500 down 4.35 percent, the Dow down 1,833 points. Crypto did not decouple. It never does on a day like that.
The leverage came out with the price. CoinGlass data captured at about 03:32 UTC put total liquidations at $1.24 billion over a rolling 24 hours, with $1.10 billion of it — 88.6 percent — long positions. Bitcoin alone accounted for $325.18 million, 90.2 percent of it long. A later CoinGlass reading cited by BeInCrypto put the crypto-wide total at $1.08 billion across 209,826 traders, 88 percent long, with Bitcoin at $282.37 million. The two totals describe different capture times on a rolling window, not a contradiction; either way, more than a billion dollars of leveraged longs were closed by force in a day. The Block’s figures show $879.92 million of it landing in a single four-hour window, $818.90 million of that long. One trader, tracked by Lookonchain, lost 201 BTC — about $15.6 million — in eight successive liquidations.
Ether and XRP fell harder than Bitcoin, which is what happens when the selling is about risk appetite rather than anything specific to crypto. Ether traded near $2,227, down 8.0 percent, with a day low of $2,206. XRP traded near $1.20, down 8.2 percent, with a low of $1.1946. Both are near their weakest levels in weeks, and neither has reclaimed anything yet. The tape at midday in Vietnam is flat to soft, not a recovery: Bitcoin is down roughly $550 from where the morning article was submitted, and nothing in the price says the selling has found its floor.
What the liquidation heatmap says now
This is where the article earns its subject, because the heatmap is the only honest way to read what comes next. A liquidation heatmap does not show real orders — no exchange publishes the liquidation price of every open position. It models clusters from open interest and standard leverage tiers. Read as pressure, not prophecy, it is still the best map of where forced selling will fire if price gets there.
The live map from AlphaFinance, all exchanges aggregated, as of 05:56 UTC (12:56 Vietnam time) reads like this. Spot: $75,673. The largest long-liquidation cluster below price is $147.2 million at $75,206, just 0.6 percent under spot. The next is $143.9 million at $75,057. Below those sit $91.3 million at $74,461, $78.9 million at $74,535, $77.5 million at $74,386, $72.0 million at $74,312, and $53.2 million at $72,896. Total modelled long liquidity below the price: $1.12 billion.
Above the price, the picture is thinner and further away. The largest short cluster is $91.3 million at $77,517, 2.4 percent above spot. Below it sit $85.9 million at $76,772, $81.8 million at $77,070, $76.9 million at $77,293, $75.9 million at $77,368, $73.6 million at $77,443 and $85.7 million at $77,592. Total modelled short liquidity above: $1.77 billion — a bigger number, but spread across a wider band and starting further from the price.
The asymmetry is the point. The nearest big fuel is downward: two clusters worth a combined $291 million sit within $700 of the current price, and a break of $75,000 runs straight into both of them. A bounce, by contrast, has to climb more than $1,000 before it reaches the first serious short cluster at $76,772. Open interest across venues stands at $52.06 billion with $94.64 billion in 24-hour volume, and the map puts $1.24 billion of long leverage within 2 percent of the price. In the last 24 hours, $297.9 million in Bitcoin longs were liquidated against just $31.7 million in shorts. The market has been sweeping one side, and the map says that side still has fuel.
None of this means $75,000 must break. A cluster is a description of what happens if price gets there, not a prediction that it will. But it does mean the path of least resistance runs down: the longs are closer, denser, and bigger than the shorts, and every test of $75,000 spends some of the bids defending it.
Why $75,000 is the line that matters
$75,000 is not a round number that traders picked because it looks clean. Three separate measures of the market converge on it at once.
The first is the short-term holder cost basis — the average price recent buyers paid. CryptoQuant put it at $75,832 as of November 3, with the cohort’s market-value-to-realized-value ratio at 1.012, meaning recent buyers are barely above breakeven. The buyers who entered in the last one to three months paid more: their cost basis sits at $77,700, and Bitcoin is already trading below it, which threatens to turn that level into resistance. When a whole cohort of buyers slips underwater at once, the selling is not just leveraged traders being closed out. It is holders deciding to cut losses.
The second is the chart itself. Bitcoin dipped below its 50-week moving average at $75,733 during the slide, with an intraday low of $75,463, the lowest since September 16. The election-night low of $75,736 sits just above the current price. The 200-day moving average waits near $73,188. One technical read, from analyst Paul Spirgel, flagged $75,001 as a key Fibonacci retracement level. However you draw it, the same $500 band keeps appearing.
The third is positioning. Michaël van de Poppe called $75,000 “the best, obvious spot for longs” — and that is exactly the problem. The obvious spot is where the leverage stacks, and where it stacks is where the sweep goes. Wintermute, the market maker, puts the next downside levels at $73,000 and $68,000, and says it wants a reclaim and hold of $80,000 before turning more positive. Between $75,500 and $80,000, in its framing, is the chop zone. Bitcoin is sitting at the bottom edge of it.
Below $75,000, the heatmap’s next band is $74,312 to $74,535, roughly $320 million of modelled long liquidity. Below that, $72,896 holds $53.2 million. The levels are not evenly spaced, and the market does not have to visit all of them. But a daily close under $75,000 opens the $73,000 zone the morning article flagged, and the map shows the fuel is there to get there fast.
Saylor’s two posts against the structure
Against that structure stands the loudest bull in the market, and he has not gone quiet. Michael Saylor posted “Feeling ₿ullish.” on the evening of November 5, Vietnam time — 8:08 PM, as the American session was closing and the sweep was getting under way. The post has drawn 84,000 likes and 8.3 million views. It is two words, no chart, no argument. It is also the whole of Strategy’s public posture in a week when its own numbers are under pressure.
Saylor’s posts on November 6 itself were more measured. At 12:17 AM he wrote: “Stay orange, my friends.” At 4:34 AM he posted a colder read of the day: “Today was a 4σ day for equities. The S&P 500 fell 4.4% and the Nasdaq fell 5.5%, a decline seen roughly once every 19 months. Bitcoin fell about 5%. $STRC closed at $99.56, just 44 cents below par.” The framing matters. He is not denying the sell-off. He is pricing it as a rare event, not a regime change, and pointing out that Strategy’s preferred shares held near par while the equity market fell apart.
The tension is arithmetic, not rhetorical. Strategy’s average acquisition cost stands at about $75,450 per bitcoin, according to its November 2 filing with the SEC. Bitcoin at $75,700 trades essentially at that cost. Strategy’s own stock, MSTR, closed November 5 at $129.30, down 9.29 percent on the day. Saylor’s conviction is not in doubt. What is in doubt is whether conviction moves a market that has just liquidated a billion dollars of longs and still has $1.12 billion of modelled long liquidity sitting below the price. Nothing in Saylor’s posts announces a new purchase, and none should be read as one. The posts are a sentiment signal, and sentiment is the weakest force on the heatmap.
The tape around the sweep
The rest of Friday’s tape is doing what it did at midday: stabilising without recovering. Nasdaq futures fell more than 1 percent at Friday’s open, then turned positive, with Nvidia up 0.58 percent and Micron up 2.82 percent in after-hours trading. The Nasdaq-100 was quoted up about 1.3 percent in live trading. That is a bounce from a 6.4 percent fall, not a reversal of it, and the VIX closed Thursday at 28.18, up nearly 70 percent — a market still pricing violent moves in both directions.
December rate-hike pricing, meanwhile, is a story about which screen you are looking at. Secondary reports of CME FedWatch put the odds of a 25-point December hike at 68.7 percent in one reading from late November 5, and 81.5 percent in another dated the same day. Kalshi’s prediction market sits near 65 percent. A model-based tracker puts it at 60.5 percent. A direct pull of the CME FedWatch tool at write time was blocked, so this article does not present any single venue’s number as the market’s view — and the 79 to 81.5 percent range the morning article carried is stale after Thursday’s sell-off. The venues disagree, and the honest number is the disagreement. Tonight’s payrolls print is the next input that could move all of them at once.
Tonight’s payrolls, and the 15:00 expiry
One event still sits between this article and the weekend, and it is the only one that can change the structure rather than just test it. October payrolls land at 20:30 Vietnam time. The consensus is a range, not a number: 55,000 in the FactSet and CNBC surveys, 59,000 in the Dow Jones survey, 62,000 in the Seeking Alpha consensus, 65,000 in Bloomberg’s. Unemployment is expected to hold at 4.2 percent, and average hourly earnings to rise 0.3 percent on the month. September managed only 29,000 jobs, July was revised down to minus 10,000, and the revisions inside tonight’s release matter as much as the headline. A strong print hardens the December hike case and leaves Bitcoin fighting a tightening cycle with a broken chart. A soft print gives the hold camp its first real ammunition of the week. Neither outcome repairs a billion dollars of liquidated longs.
Thirty minutes before this article’s deadline, $2.65 billion of Bitcoin options expire on Deribit at 15:00 Vietnam time — about 33,500 contracts, with max pain at $79,000. Bitcoin trades roughly $3,300 below that level, so the expiry is not a floor. It is Friday plumbing, and it lands before payrolls, not after. The sweep happened before either event. The events will decide whether it continues.
The sweep in one view
What
What it shows
What it means next
BTC tape, Friday afternoon Vietnam time
Near $75,639, day low $75,208, down 5.96%; ETH $2,227, XRP $1.20
Testing $75,000; flat to soft, no recovery yet
Liquidations, rolling 24 hours
About $1.24B (CoinGlass capture ~03:32 UTC), 88.6% long; BTC $325.18M, 90.2% long; cross-check $1.08B across 209,826 traders
More than a billion dollars of longs closed by force
Heatmap below price (AlphaFinance, 05:56 UTC)
$147.2M at $75,206; $143.9M at $75,057; $1.12B long liquidity below
Nearest fuel is downward; a $75,000 break sweeps about $291M
Heatmap above price
$91.3M at $77,517; $85.9M at $76,772; $1.77B short liquidity above
Expiry is plumbing, not a floor; payrolls decide the hike path
What to watch
Watch $75,000 first, and watch it as a close, not a wick. A bounce that holds it leaves the $75,057 and $75,206 clusters intact and gives the market something to defend into payrolls. A daily close below it sweeps roughly $291 million of modelled long liquidity in one move and opens the $74,300 band, then Wintermute’s $73,000. Watch the heatmap after 15:00, when the options expiry clears and the map reprices. And watch 20:30, when payrolls decide whether the December hike odds — scattered anywhere from 60 to 82 percent depending on the venue — converge or split further apart.
The sweep took Bitcoin from $80,000 to $75,000 in a night, and the map says the leverage is still stacked on the side it just swept. Saylor is still bullish. The heatmap does not care. It only shows where the next forced selling sits, and right now it sits just below the price.
This article is for informational purposes only and does not constitute financial advice. Figures are cited from official releases and market data as reported at the time of writing and are subject to revision. Cryptocurrency markets are volatile; always do your own research before making investment decisions.
Disclaimer: This quantitative macroeconomic analysis, orderbook liquidation telemetry, and derivatives breakdown is published strictly for educational and informational purposes and does not constitute financial, investment, or trading advice. Digital asset markets involve significant capital risk and high volatility. Always conduct independent research (DYOR) and exercise disciplined risk management before making financial decisions.
CX
CoinXSight Alpha Desk
ALPHA // DESK
Quantitative Research Desk·Global Alpha Division
CoinXSight Institutional Research Desk produces quantitative crypto market intelligence, algorithmic models, and on-chain forensics.
QUANTITATIVE SUITE // DEEP ALPHA ENGINEACTIVE
BTC/USDT // LIVE SCANNER
CONFLUENCE 74
LIVE SPOT PRICE$82,807.47WEAK_BUY
TP2
$89,522.75
+9.07%
TP1
$85,056.42
+3.63%
ENTRY
$82,078.86
ZONE
SL
$80,590.09
-1.81%
Auto-detect Order Blocks, Fair Value Gaps and risk-adjusted DCA ladders in < 5s.