Why retail traders treat dense liquidation bands as price targets, how market makers exploit clustered stop cascades, and how to read derivatives positioning like an institutional flow desk.
Over the past seventy-two hours, digital asset trading screens illuminated a familiar drama: as Bitcoin oscillated within the fragile $80,000–$81,500 band, public social feeds filled with colorful screenshots of derivative liquidation heatmaps. Bullish commentators pointed to towering clusters of short liquidations stacked between $85,000 and $87,500, declaring them “guaranteed magnets.” Bearish commentators pointed to deep pools of long leverage clustered just below $79,500, predicting an imminent elevator drop.
Both interpretations make the exact same fatal mistake.
A liquidation heatmap does not predict where price will go. It maps where trapped capital cannot survive. When leveraged positions congregate in dense bands, they do not function as self-fulfilling price destinations; they represent asymmetric liquidity reserves that sophisticated participants, market makers, and high-frequency algorithms actively hunt, absorb, or defend against.
Understanding the mechanical distinction between an indicator that forecasts direction and a structural map that exposes vulnerability is the dividing line between retail speculation and professional market microstructure navigation.
1. Deconstructing the Heatmap: What the Visualization Actually Measures
To understand how smart money exploits leverage clustering, one must first dismantle the mechanics of the visualization itself.
A liquidation heatmap is not an order book. An order book displays resting limit orders—bids and asks placed by traders voluntarily willing to buy or sell at specific prices. A liquidation heatmap, by contrast, estimates the forced execution points of open margin positions based on three core variables:
– Open Interest (OI): The total nominal value of outstanding derivative contracts across perpetual and fixed-maturity futures.
– Estimated Leverage Multipliers: The distribution of leverage tiers (5x, 10x, 25x, 50x, 100x) utilized by market participants entering at specific price levels.
– Bankruptcy Price vs. Liquidation Threshold: The calculated price point where maintenance margin requirements are breached, triggering algorithmic forced liquidation by exchange risk engines.
When an exchange risk engine liquidates a long position, it does not politely ask for permission; it fires a programmatic market sell order directly into the top of the bid book. Conversely, a short liquidation fires an aggressive market buy order into the ask book.
Therefore, a “bright yellow” cluster on a heatmap represents a concentrated reservoir of forced, price-insensitive market orders waiting to detonate.
Position Type
Leverage Ratio
Liquidation Distance from Entry
Forced Order Execution
Institutional Interpretation
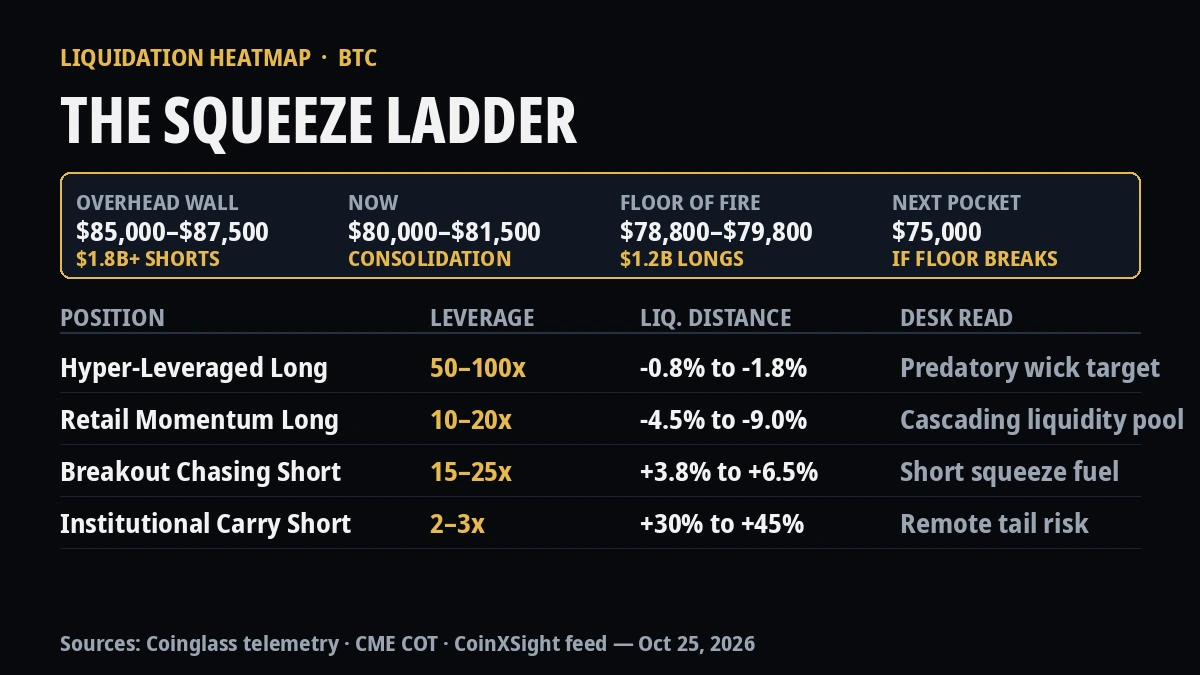
Hyper-Leveraged Long
50x – 100x
-0.8% to -1.8%
Forced Market Sell
Transient stop noise; predatory wick target
Retail Momentum Long
10x – 20x
-4.5% to -9.0%
Forced Market Sell
Structural cascading liquidity pool
Institutional Carry Short
2x – 3x
+30% to +45%
Discretionary Cover / Margin Call
Remote tail risk; non-cascading
Breakout Chasing Short
15x – 25x
+3.8% to +6.5%
Forced Market Buy
Short squeeze fuel; liquidity pocket for smart exits
Derivative Microstructure Architecture & Forced Order Dynamics (CoinXSight Telemetry)
2. The Four Critical Traps: How Retail Reads Heatmaps Incorrectly
The explosion of public liquidation analytics platforms has created a cohort of traders armed with professional-grade data but zero institutional context. This information asymmetry leads to four systematic execution traps:
1. The “Magnet Fallacy”
The most widespread misconception is assuming that price must inevitably travel to the largest visible liquidation cluster. Price travels toward liquidity only when an aggressive market participant possesses sufficient capital to drive spot order books through intermediate resistance. If buying volume dries up, a massive short liquidation band sitting 5% overhead will remain completely untouched while price collapses under its own weight.
2. Ignoring Spot Orderbook Depth and CVD
Derivative leverage is the spark, but spot flow is the oxygen. A derivative trader who analyzes liquidation heatmaps without cross-referencing Cumulative Volume Delta (CVD) and spot orderbook depth is flying blind. As observed in our recent structural analysis of the Federal Reserve’s October 27–28 meeting, macro de-risking can trigger persistent spot outflows that overpower even the most enticing overhead short liquidation targets.
3. Dynamic Stop Adjustments and Ghost Clusters
Static heatmaps display where liquidations would occur if positions remained static. However, sophisticated traders, family offices, and quantitative funds actively manage margin: adding collateral, trailing stops, or hedging through synthetic options. What appears on a 24-hour heatmap as a $500M liquidation wall can evaporate in seconds as institutional participants de-risk before the trigger price is touched.
4. Conflating Liquidation Wicks with Trend Continuation
When price sweeps a prominent liquidation cluster, retail traders often chase the breakout, assuming the violent move signals strong organic momentum. In reality, the surge was generated by forced buy-stops. Once those stops are cleared, buying pressure vanishes instantly, leaving late breakout buyers trapped at the exact high of the wick.
3. The Smart Money Playbook: Liquidity Sweeps, Absorption, and Reversals
The Squeeze Ladder: Liquidation Waterfall and Institutional Absorption Mechanics (CoinXSight Telemetry)
Institutional trading desks and market makers operate under an entirely different mandate than retail speculators: they require massive counterparty volume to enter and exit positions without incurring severe slippage.
When an institutional fund wants to accumulate 2,000 BTC, it cannot simply submit a market buy order; doing so would drive the market up several percent against itself. Instead, the algorithm identifies where retail sell orders are concentrated—specifically, the dense long liquidation clusters resting just beneath key support levels.
The Anatomy of the Stop-Hunt and Reversal Sequence:
The Engineered Push: Algorithmic sellers lean into thin spot liquidity, nudging price across an obvious structural low (such as the heavily contested $80,000 threshold where $80,000 has served as support through all of October).
The Liquidation Cascade: The moment price breaches the threshold, hundreds of retail stop-losses and forced liquidations fire simultaneously into the market, generating an avalanche of market sell orders.
Passive Institutional Absorption: Rather than letting the market plunge into free fall, institutional bid walls sitting passively beneath the sweep absorb the forced selling volume in full.
The V-Shaped Spring: With trapped short-sellers now off-balance and forced selling completely exhausted, minimal buying pressure drives price back inside the previous range, trapping fresh breakout shorts and igniting an immediate counter-rally.
This exact sequence separated participants during recent institutional volatility events, including capital rotation waves across major ecosystem assets such as Solana’s Alpenglow upgrade went live this week and cross-asset flow rebalancing into XRP ETFs.
4. Current Market Context: Reading the October 2026 BTC Landscape
Applying this framework to current market conditions yields actionable clarity rather than emotional bias.
Following the massive single-day institutional redemption wave across spot ETFs and high-profile KOL portfolio de-risking, Bitcoin derivative markets have transitioned into an intense consolidation corridor:
– The Overhead Wall ($85,000 – $87,500): Over $1.8 billion in cumulative short liquidations have accumulated overhead. For this cluster to act as fuel for an upward squeeze, spot volume must show consistent positive delta, absorbing structural overhead supply.
– The Floor of Fire ($78,800 – $79,800): Directly beneath the psychological $80,000 level lies an estimated $1.2 billion in leveraged long liquidations. A sustained break beneath this band would trigger a systemic cascade toward the $75,000 liquidity pocket unless institutional buyers step in with passive size.
– Perpetual Basis Spread: Funding rates have compressed toward 0.003% to 0.008%, signaling that the excessive long leverage built during the early autumn rally has been substantially purged. The market is no longer overextended; it is coiled.
5. Practical Framework: How to Integrate Liquidation Heatmaps into Your Daily Workflow
To utilize liquidation heatmaps effectively without falling victim to predatory market sweeps, adopt this four-step institutional workflow:
Map the Asymmetry: Identify whether the aggregate liquidation risk is heavily skewed toward longs or shorts. When 80% of leverage sits on one side, the probability of an engineered cascade against that consensus cohort rises exponentially.
Never Place Stops at Obvious Round Numbers: If a major liquidation band sits at $80,000, placing your protective stop at $79,950 guarantees you will be swept during an algorithmic stop run. Position risk invalidation either significantly wider or manage exposure dynamically based on session closes.
Wait for the Reclaim Before Entering: Do not attempt to catch a falling knife in the middle of an active liquidation cascade. Wait for the forced selling to exhaust itself, observe whether CVD curls upward, and enter only when price reclaims the breached structural level with confirmation.
Treat Large Clusters as Take-Profit Zones, Not Entry Triggers: If you are holding a profitable long trade and price accelerates vertically into a massive short liquidation band, that is your signal to distribute liquidity to trapped shorts—not to add leverage.
Liquidation heatmaps are among the most powerful forensic tools available to modern traders, but only when understood for what they truly represent: a dynamic map of human greed, fear, and forced execution. Master the mechanics of the squeeze, or become the liquidity that feeds it.
Data sources: Coinglass Liquidation Heatmap Telemetry; CoinGlass Open Interest & Derivatives Architecture; CME Group Institutional Commitments of Traders (COT); CoinXSight Proprietary Microstructure Feed. Figures current as of October 25, 2026.
Follow CoinXsight for continuous institutional-grade market microstructure and regulatory analytics.
Disclaimer: This article is for informational, educational, and analytical purposes only and does not constitute financial, investment, legal, tax, or trading advice. Derivatives trading, futures contracts, and leveraged digital asset positions carry extreme financial risk, including the rapid and complete loss of invested capital. Liquidation models rely on algorithmic estimates and may not reflect real-time off-exchange OTC hedging. Always perform comprehensive independent due diligence before committing capital.
CX
CoinXSight Alpha Desk
ALPHA // DESK
Quantitative Research Desk·Global Alpha Division
CoinXSight Institutional Research Desk produces quantitative crypto market intelligence, algorithmic models, and on-chain forensics.
QUANTITATIVE SUITE // DEEP ALPHA ENGINEACTIVE
BTC/USDT // LIVE SCANNER
CONFLUENCE 74
LIVE SPOT PRICE$82,807.47WEAK_BUY
TP2
$89,522.75
+9.07%
TP1
$85,056.42
+3.63%
ENTRY
$82,078.86
ZONE
SL
$80,590.09
-1.81%
Auto-detect Order Blocks, Fair Value Gaps and risk-adjusted DCA ladders in < 5s.