Master AI prompt engineering for crypto TA — structured templates for chart analysis, multi-timeframe setups, and indicator reading. Essential crypto technical analysis for smarter trading.
KZ
Dr. Kevin ZhangPrincipal AI & Quantitative Researcher·May 23, 2026 · 10 min read · Updated Oct 6
Prompt engineering for trading is the practice of structuring your AI inputs to produce specific, actionable technical analysis outputs instead of generic advice. The difference between a bad prompt and a good one is the difference between "BTC looks bullish" and "Enter BTC long at $106,800 with stop at $105,400 and target $110,200, R:R 2.4:1 based on EMA 21/50 convergence and RSI rising from 42."
Understanding the underlying math helps you write better prompts. The RSI formula that AI references:
RSI = 100 - (100 / (1 + RS))
where RS = Average Gain (14 periods) / Average Loss (14 periods)
When your prompt includes the RSI value, AI can reason about whether momentum is accelerating or decelerating based on this calculation.
The core principle is simple: give the AI your data, your context, and your desired output format. Most traders fail at prompt engineering because they ask open-ended questions without providing the structured data that LLMs need to produce precise analysis.
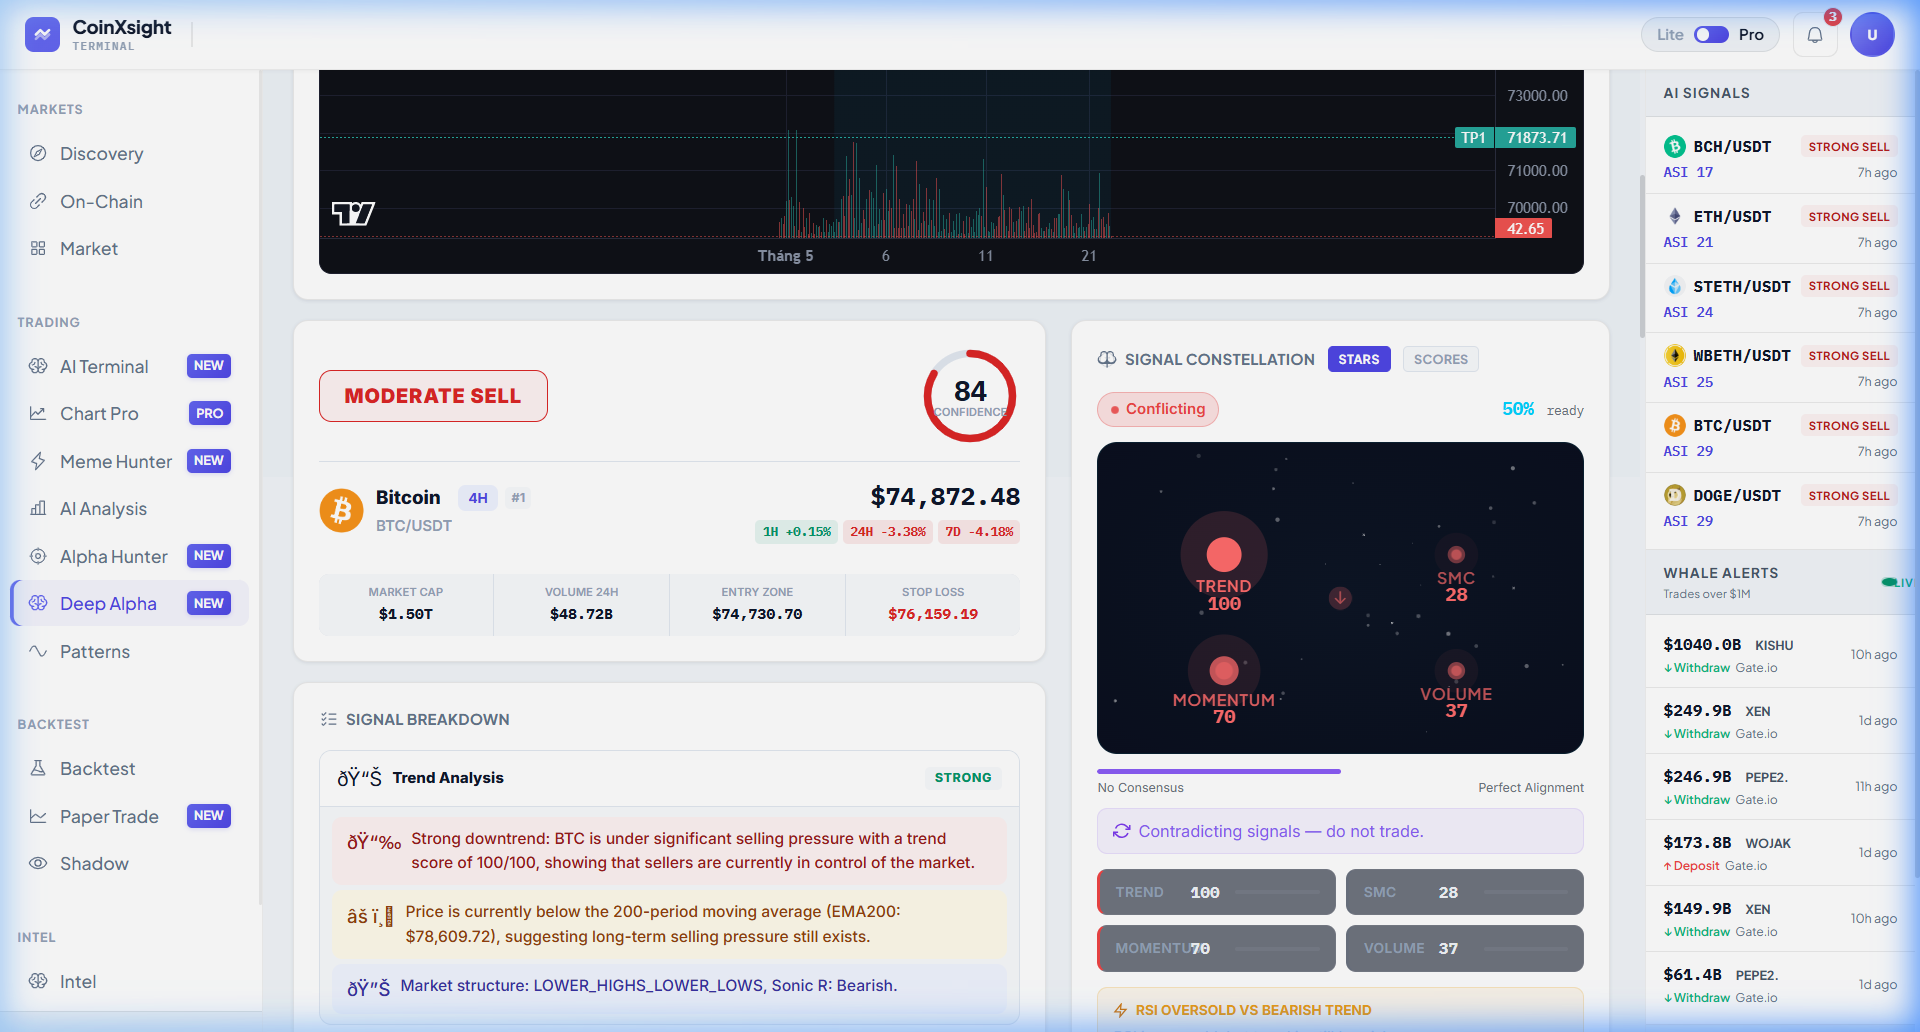
💡 CoinXSight's Deep Alpha module gives you pre-structured data — Confluence Score, RSI, MACD, EMA status, and trend direction — in a format that's ready to paste into any AI prompt. This eliminates the biggest bottleneck: gathering clean input data.
The Anatomy of a High-Quality Trading Prompt
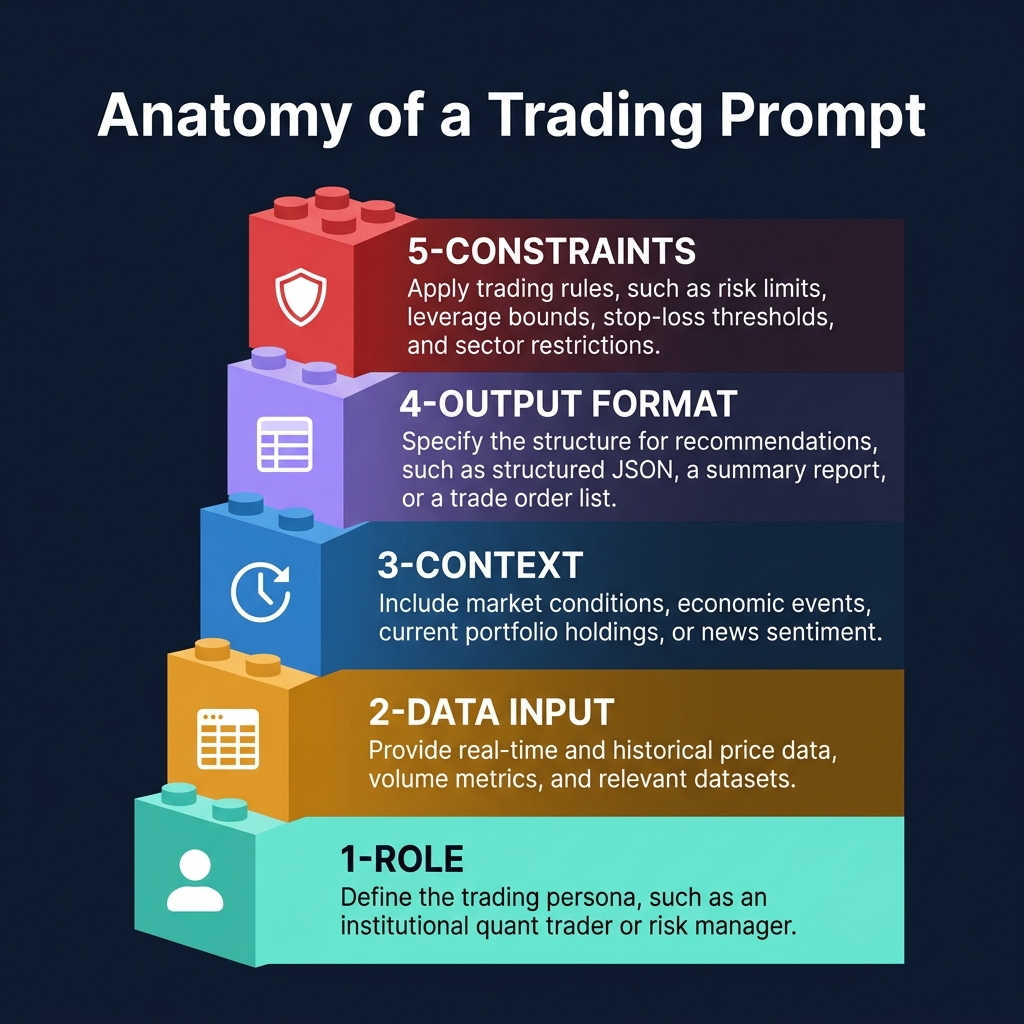
Every effective trading prompt has 5 components. Missing any one of them degrades the output quality:
The 5-Component Framework
Component
What It Does
Example
Role
Sets the AI's expertise level and perspective
"Act as a senior crypto technical analyst with 10 years of experience"
"I'm looking at the 4H chart during a weekly uptrend"
Output Format
Specifies exactly what you want back
"Give me a table with entry, stop, target, and R:R for each setup"
Constraints
Sets boundaries to prevent hallucination
"Only reference the data I provided. Don't make up price levels."
Bad vs Good Prompt Comparison
❌ Bad Prompt
✅ Good Prompt
"Is BTC bullish?"
"Given BTC at $107,200 with RSI 62, MACD histogram declining from +85 to +45, price above EMA 21 ($106,400) and EMA 50 ($104,800), on the 4H chart — is the current momentum supporting continuation or signaling exhaustion? What confirmation would change your bias?"
"Analyze ETH for me"
"Analyze ETH/USDT on the daily chart. Data: Price $2,580, RSI(14) = 55, MACD line just crossed above signal line, price below EMA 50 ($2,640) but above EMA 200 ($2,320). Volume is 15% below 20-day average. Confluence Score from CoinXSight: 5/10. Should I wait for EMA 50 reclaim or enter now? Give me both scenarios with entry, stop, target."
"What's the best crypto to buy?"
"Here are 5 tokens I'm watching with their CoinXSight Confluence Scores: BTC 7/10, ETH 5/10, SOL 6/10, AVAX 8/10, LINK 4/10. For the top 2 by score, give me a specific swing trade setup (4H/Daily) with entry zone, invalidation level, and 2 take-profit targets."
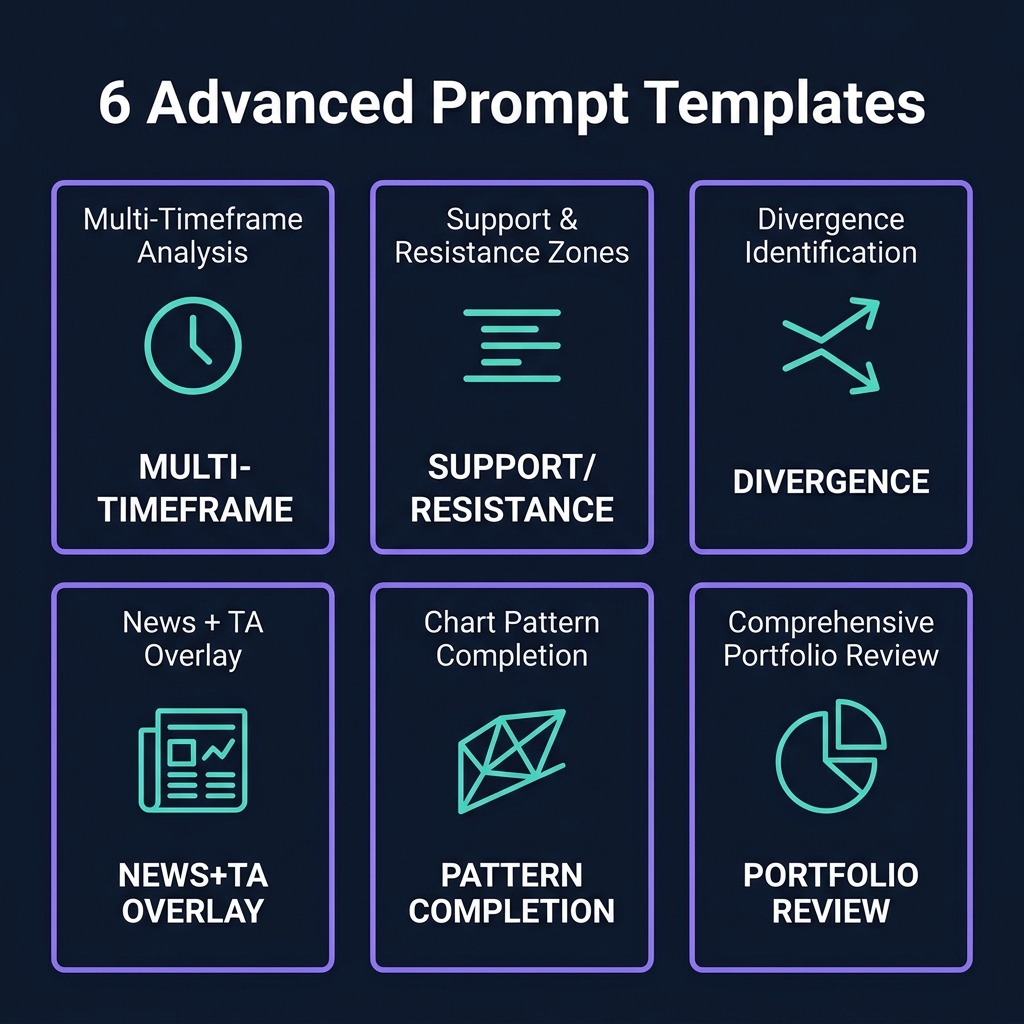
6 Advanced Prompt Templates for Technical Analysis
Modern crypto analytics platforms integrate these signals with additional data layers — combining trading indicators, on-chain metrics, and AI analysis for higher-probability entries.
These templates produce institutional-quality analysis. Each is designed for a specific use case.
Template 1: Multi-Timeframe Confluence Check
Role: Senior crypto technical analyst.

Data from CoinXSight Deep Alpha for [TOKEN]:
- Weekly: [Trend direction], RSI [value], above/below EMA 21
- Daily: [Trend direction], RSI [value], MACD [status],
  above/below EMA 21/50/200
- 4H: RSI [value], MACD histogram [value], Supertrend [status]
- Confluence Score: [X/10]

Task: Perform a multi-timeframe analysis.
1. Do the three timeframes agree on direction? Rate alignment 1-5.
2. Identify the dominant trend and any conflicting signals.
3. If all timeframes align, give me the optimal entry on the
   lowest timeframe with stop loss based on the nearest structure.
4. If timeframes conflict, tell me to wait and specify what
   signal would resolve the conflict.

Output format: Table with Timeframe, Bias, Key Signal, Confidence.
Then a specific trade recommendation or "WAIT" instruction.
When to use: Before entering any swing or position trade. This prevents you from trading against the higher timeframe.
Template 2: Support/Resistance Level Validation
Role: Technical analyst specializing in support and resistance.

I've identified these key levels for [TOKEN]/USDT:
- Resistance 1: $[price] (source: [previous high / fib / order block])
- Resistance 2: $[price] (source: [description])
- Support 1: $[price] (source: [description])
- Support 2: $[price] (source: [description])
- Current price: $[price]

Additional data:
- RSI(14): [value]
- Volume vs 20-day average: [X]%
- CoinXSight Confluence Score: [X/10]

For each level:
1. Rate its strength (1-5) based on the number of touches
   and volume at that level.
2. Is price likely to bounce or break at this level?
   What would confirm each scenario?
3. Where should I place my stop loss if I'm trading the
   bounce at Support 1?
4. What's the minimum risk/reward ratio to make this trade
   worthwhile?
Template 3: Divergence Detection and Interpretation
Role: Momentum analyst.

I'm observing the following on [TOKEN]/USDT [timeframe] chart:

Price action:
- Price made a [higher high / lower low] at $[price] on [date]
- Previous [high / low] was $[price] on [date]

Indicator readings:
- RSI at current [high/low]: [value]
- RSI at previous [high/low]: [value]
- MACD histogram at current: [value]
- MACD histogram at previous: [value]

Questions:
1. Is this a valid bullish/bearish divergence?
   Why or why not?
2. What type of divergence is it
   (regular, hidden, exaggerated)?
3. What's the typical success rate and expected magnitude
   of this divergence pattern in crypto?
4. What confirmation signal should I wait for before entering?
5. Where's the invalidation point that would negate
   the divergence?
Template 4: News Impact Assessment with TA Overlay
Role: Crypto analyst combining fundamental and technical analysis.

NEWS EVENT: [Paste headline and 2-3 sentence summary]

CURRENT TA DATA for [TOKEN]:
- Price: $[price]
- Trend: [bullish/bearish/ranging]
- RSI(14): [value]
- Key support: $[price]
- Key resistance: $[price]
- CoinXSight Confluence Score: [X/10]

Analyze:
1. Is the news event bullish, bearish, or neutral for [TOKEN]?
2. Does the current TA setup SUPPORT or CONTRADICT
   the expected news impact?
3. If news and TA align: What's the highest-probability
   entry with specific levels?
4. If news and TA conflict: Which should I trust and why?
5. What's the expected timeframe for the news to be
   "priced in"?
6. Are there other tokens that benefit more from this news?
Template 5: Pattern Completion and Target Projection
Role: Chart pattern specialist.

I see a potential [pattern name: head and shoulders /
double bottom / ascending triangle / bull flag / etc.]
on [TOKEN]/USDT [timeframe]:

Pattern data:
- Left shoulder/first bottom: $[price] on [date]
- Head/second bottom: $[price] on [date]
- Right shoulder/current: $[price] on [date]
- Neckline: $[price]
- Volume trend during pattern: [increasing/decreasing/mixed]

Current indicators:
- RSI(14): [value]
- MACD: [status]
- CoinXSight Confluence Score: [X/10]

Questions:
1. Does this pattern meet the textbook criteria?
   What's missing?
2. Calculate the measured move target from the neckline.
3. What confirmation do I need before entering?
4. Where's the stop loss if the pattern fails?
5. What's the probability of this pattern completing
   based on historical crypto data?
Template 6: End-of-Week Portfolio Review
Role: Portfolio analyst and risk manager.

Here are my current positions:
| Token | Entry | Current | P&L% | Size% of Portfolio |
  Confluence Score |
|-------|-------|---------|------|--------------------|
  -----------------|
| [TOKEN] | $[X] | $[X] | [X]% | [X]% | [X/10] |
[Repeat for each position]

Total portfolio value: $[X]
Cash/stablecoin reserve: [X]%
Week's total P&L: [X]%

Review my portfolio:
1. Am I over-concentrated in any single position?
   (Flag if any position > 25%)
2. Do the Confluence Scores still support holding
   each position?
3. Should I reduce any position that's showing
   declining momentum?
4. Am I holding too much cash or too little?
   What's the optimal allocation given current market conditions?
5. Rank my positions from "highest conviction hold"
   to "consider closing" based on the data above.
Real-World Prompt Examples with Actual Output
Here's what these prompts produce in practice. These are condensed versions of actual outputs.
Example — BTC Multi-Timeframe Analysis (May 2026)
Data pasted from CoinXSight Deep Alpha:
Weekly: Bullish, RSI 58, above EMA 21. Daily: Bullish, RSI 64, MACD histogram declining from +120 to +80, above all EMAs. 4H: RSI 52, MACD near zero line, Supertrend bullish. Confluence Score: 7/10.
AI output (condensed): "All three timeframes show bullish bias with 4/5 alignment. The weekly uptrend is intact but the daily MACD histogram decline signals momentum deceleration — not reversal. The 4H is consolidating near the MACD zero line, which typically precedes a momentum expansion. Recommendation: Wait for 4H MACD histogram to print 2 consecutive green bars above zero. Enter long at the 4H close, stop below the most recent 4H swing low. Target: daily resistance."
Example — SOL Divergence Check (April 2026)
Data pasted: SOL made a higher high at $178 on April 15 (RSI 65) after previous high of $172 on April 8 (RSI 71). MACD histogram: +28 current vs +45 previous.
AI output (condensed): "This is a regular bearish divergence — price is making higher highs but both RSI and MACD are making lower highs. Success rate in crypto is approximately 55-65% when confirmed by volume decline. Confirmation needed: A bearish engulfing candle or a close below the 4H EMA 21. Invalidation: A new high above $178 with RSI above 71."
The Data-First Rule: Why Your Prompt Quality Depends on CoinXSight
CoinXSight's crypto analytics platform streamlines this workflow with AI-powered tools and real-time data:
The #1 rule of trading prompt engineering: the quality of your output is determined by the quality of your input data. Vague data produces vague analysis. Specific data produces specific setups.
Here's the workflow that produces the best results:
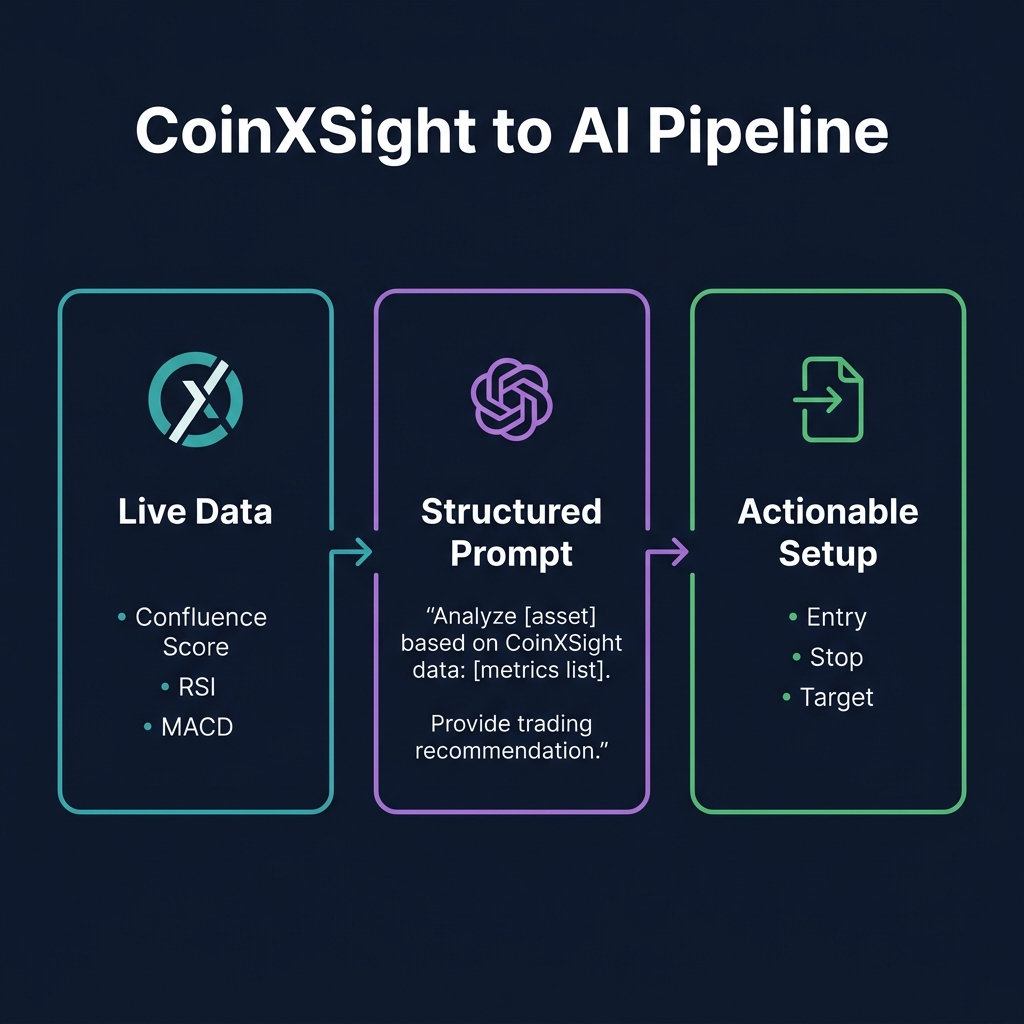
The CoinXSight → AI Pipeline
Open Deep Alpha on CoinXSight → get Confluence Score, RSI, MACD, trend direction
Open Chart Pro (or use TradingView for additional charting) → identify key support/resistance levels visually
Check Whale Tracker → note any unusual on-chain activity
Paste all data into your prompt template
Get structured analysis back → verify against the chart
Execute only when AI analysis AND Confluence Score agree
💡 You can also screenshot your Chart Pro view and upload it directly to ChatGPT or Gemini. Both can interpret candlestick charts, identify patterns, and point out indicator readings from images. This is faster than typing data manually — but always verify the AI's chart reading against your own.
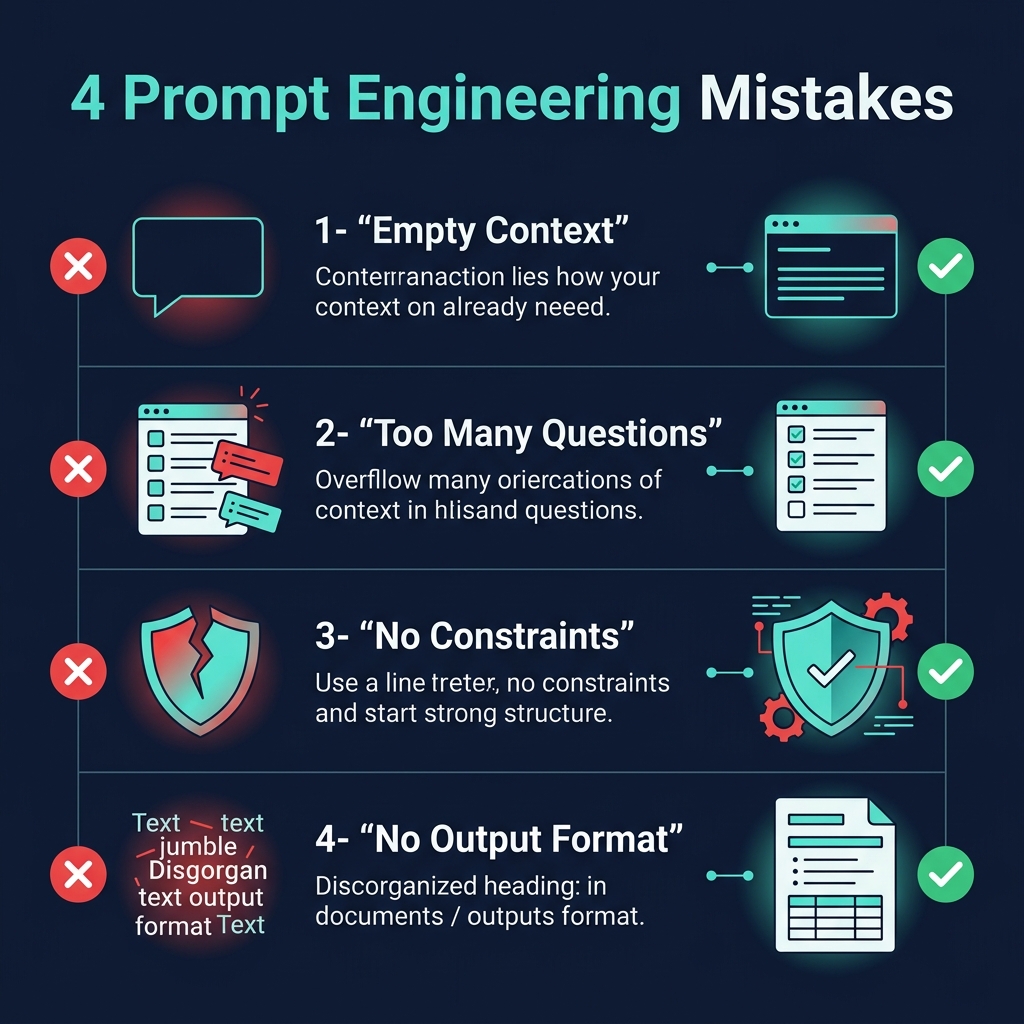
Common Prompt Engineering Mistakes
Mistake 1: The Empty Context Prompt
"Analyze BTC" → This produces 500 words of generic analysis with no actionable content. Always specify: what timeframe, what data, what output format.
Mistake 2: Asking for Too Much at Once
A prompt with 15 questions produces shallow answers. Limit to 3-5 specific questions per prompt. Run multiple prompts if needed.
Mistake 3: Not Setting Constraints
Without constraints, AI will hallucinate price targets, invent statistics, and make confident predictions. Always add: "Only analyze the data I've provided. Flag any assumptions you're making."
Mistake 4: Ignoring the Output Format
If you don't specify "give me a table" or "give me a numbered list," AI will default to prose. Prose is harder to act on than structured data. Always specify your preferred format.
⚠️ Limitation: Prompt engineering improves the quality of AI analysis but cannot overcome fundamental limitations. LLMs still cannot access real-time prices, execute trades, or predict future price movements. The best prompt in the world fed with stale data produces stale analysis. Always use CoinXSight for current data.
Prompt engineering for crypto trading is structuring your AI inputs with specific data, context, timeframe, and output format to produce actionable technical analysis. Instead of asking "Is BTC bullish?", you provide RSI, MACD, price levels, and ask for specific entry/stop/target recommendations.
Can ChatGPT analyze crypto charts from screenshots?
Yes. ChatGPT (GPT-4o) and Gemini can interpret uploaded candlestick chart screenshots, identify patterns, read indicator values, and suggest trading setups. Accuracy varies — always verify AI's chart reading against your own analysis. CoinXSight's Chart Pro provides cleaner data input than screenshots.
How many questions should I include in one AI trading prompt?
Limit to 3-5 focused questions per prompt. More questions produce shallower answers. For complex analysis, use multiple sequential prompts: first establish the macro bias, then drill into specific setups, then calculate position sizing separately.
Does CoinXSight work with ChatGPT for trading analysis?
CoinXSight provides structured data (Confluence Score, RSI, MACD, trend direction) that's ready to paste into AI prompts. The Deep Alpha module gives you the exact numbers AI needs to produce precise analysis. Use CoinXSight for data and signal generation; use ChatGPT for interpretation and scenario planning.
What's the best AI model for crypto technical analysis in 2026?
For structured TA interpretation, ChatGPT (GPT-4o) produces the most consistent tabular output. Gemini excels at chart image analysis and has better access to recent data. Claude provides the most thorough risk analysis. The best approach uses CoinXSight for live data and any LLM for interpretation.
Disclaimer: This article is for educational and informational purposes only and does not constitute financial, investment, or trading advice. Cryptocurrency markets are highly volatile and involve substantial risk of loss. Always conduct your own research (DYOR) and consult a licensed financial advisor before making any investment decisions. Past performance does not guarantee future results. CoinXSight provides analytical tools and data — not investment recommendations.
Which crypto trading platform is best for this indicator analysis?
CoinXSight offers this indicator alongside 12+ other trading indicators, AI-powered Confluence Scoring, and Smart Money Concepts u2014 making it a comprehensive crypto analytics platform for technical analysis.
KZ
Dr. Kevin Zhang
AI // QUANT LABS
Principal AI & Quantitative Researcher·Deep Alpha Engine Labs
Ph.D. in Computational Statistics. Leads machine learning architecture, regime-switching detection, and automated execution systems at CoinXSight Labs.
QUANTITATIVE SUITE // DEEP ALPHA ENGINEACTIVE
BTC/USDT // LIVE SCANNER
CONFLUENCE 93
LIVE SPOT PRICE$83,908.89STRONG_BUY
TP2
$89,725.68
+6.94%
TP1
$86,233.44
+2.77%
ENTRY
$83,905.28
ZONE
SL
$82,741.19
-1.39%
Auto-detect Order Blocks, Fair Value Gaps and risk-adjusted DCA ladders in < 5s.