AI Anomaly Detection: Spot Pump-and-Dump, Flash Crashes & Whale Manipulation
Learn how AI anomaly detection identifies pump-and-dump schemes, flash crashes, wash trading, and whale manipulation in crypto markets before they hit your portfolio. Essential crypto technical analysis for smarter trading.
KZ
Dr. Kevin ZhangPrincipal AI & Quantitative Researcher·May 29, 2026 · 14 min read · Updated Oct 6
Crypto markets never close, they barely sleep, and they are riddled with behavior that would trigger regulatory alarms on any traditional exchange. Pump-and-dump groups coordinate through Telegram channels. Whales shift millions of dollars between wallets to disguise accumulation. Wash trading inflates volume on lesser-known tokens by 10x or more. Flash crashes wipe out leveraged positions in seconds.
These events share one thing in common: they leave data fingerprints that AI can detect long before the average human trader notices.
AI anomaly detection works like a smoke detector for your portfolio. A smoke detector does not know whether your house is on fire because of a grease pan or an electrical fault — it simply knows that something abnormal is happening in the air and alerts you immediately. In the same way, AI anomaly detection establishes what "normal" looks like for a token's price, volume, order flow, and on-chain activity, and then sounds the alarm the moment something breaks the pattern.
This guide breaks down the five most common anomaly types in crypto, shows you exactly how AI catches each one, and gives you a practical decision framework for acting on anomaly alerts — no coding required.
Key Terms Used in This Guide
If any of the terminology in this article is new to you, use this quick reference:
Term
What It Means
Anomaly
An unusual event that deviates significantly from normal market behavior — the digital equivalent of a smoke alarm going off
Pump-and-Dump
A scheme where a group artificially inflates a token's price through coordinated buying and hype, then sells at the peak, crashing the price
Wash Trading
Fake trading activity where the same person (or coordinated group) buys and sells to themselves to inflate volume numbers
Whale
A wallet or entity holding a very large amount of a cryptocurrency — typically $1M+ worth — whose trades can move the market
Flash Crash
A sudden, extreme price drop (15%+ in minutes) caused by a chain reaction of automated selling, stop losses, and liquidations
On-Chain Data
Information recorded directly on a blockchain — wallet balances, transaction histories, smart contract interactions — that anyone can verify
Order Book
The list of all pending buy and sell orders on an exchange at every price level, showing available liquidity
Liquidation
When an exchange forcibly closes a leveraged (borrowed-money) trading position because the trader's losses exceed their collateral
Open Interest
The total value of all outstanding leveraged positions (futures/perpetual contracts) that have not yet been closed
Spoofing
Placing large fake orders to trick other traders into thinking there is strong demand or supply, then canceling before execution
Why Anomaly Detection Matters More in Crypto Than Any Other Market
Traditional stock markets have circuit breakers, SEC oversight, regulated market makers, and trading hours that limit manipulation. Crypto has none of that. The result is an environment where:
Pump-and-dump schemes run daily on low-cap tokens, often coordinated across thousands of participants via private group chats
Wash trading accounts for an estimated 40-60% of reported volume on certain exchanges, according to multiple blockchain research firms in 2026
Whale wallets holding 1% or more of a token's supply can move prices 5-15% with a single transaction
Flash crashes triggered by cascading liquidations (when exchanges forcibly close leveraged positions) can erase 20-40% of a token's value in under 60 seconds
Spoofing and layering — placing and quickly canceling large fake orders to trick other traders about supply and demand — happens around the clock
The human eye simply cannot process the firehose of data required to catch these events in time. A single exchange produces millions of order book (the live list of all pending buy and sell orders) updates per hour. On-chain networks (data recorded directly on blockchains) generate thousands of wallet transactions per minute. Social platforms push out hundreds of posts per second.
AI anomaly detection does not replace your judgment. It replaces your inability to watch everything at once.
5 Types of Market Anomalies AI Detects
Every anomaly type has a distinct signature — a pattern of data that looks different from the baseline. Think of each one as a different kind of smoke with a different smell. The AI learns what normal smoke looks like (cooking, a fireplace) and flags anything that does not match.
1. Volume Spikes Without News
What it looks like: A token that normally trades $2M per day suddenly pushes $12M in a single hour — with no news, no listing announcement, no protocol upgrade. The price may barely move, or it may start ticking up slowly.
Real 2026 example: In March 2026, a mid-cap DeFi token saw its hourly volume jump to 7x the daily average on a quiet Sunday afternoon. No governance vote, no partnership announcement, nothing on social media. Within 36 hours, three whale wallets that had been accumulating for two weeks began selling, and the token dropped 22%.
How AI catches it vs. human: A trader watching a watchlist of 20 tokens might notice one volume spike if they happen to be checking at the right time. AI monitors volume baselines across 500+ tokens simultaneously, on every timeframe from 5-minute to daily. When volume deviates by more than 3x the rolling average without a corresponding news catalyst, the system flags it immediately — typically 4 to 8 hours before the price impact becomes obvious.
Signal
Human Detection
AI Detection
Time to notice
2-12 hours (if watching)
Under 60 seconds
Tokens covered
10-30 on a watchlist
500+ simultaneously
False positive filtering
Gut feeling
Statistical threshold (z-score — a measure of how far a value deviates from average)
Cross-referencing news
Manual search
Automated news + social scan
2. Price Manipulation Patterns (Pump-and-Dump)
What it looks like: A token's price rises 40-200% over 1-4 hours with explosive volume, fueled by coordinated social media hype. Then it reverses violently — dropping 60-80% from the peak in under an hour. Latecomers who bought the rally are left holding bags at a loss.
The pump-and-dump signature has five phases:
Quiet accumulation — Insiders buy slowly over days or weeks, keeping volume unremarkable
Coordinated launch — Social channels flood with "buy now" messages, fake endorsements, and urgency language
Rapid spike — Price and volume explode as retail traders pile in, driven by FOMO (fear of missing out — the emotional urge to buy because everyone else is buying)
Distribution — Insiders sell into the buying pressure at peak prices
Cliff drop — Once selling overwhelms buying, the price collapses and volume dries up
Real 2026 example: In January 2026, a meme coin on Solana surged 320% in 90 minutes. Social monitoring tools tracked a 1,400% spike in mentions on X (formerly Twitter) within the same window. AI flagged the anomaly within 8 minutes of the launch phase — before the price had risen more than 35%. Traders who saw the alert avoided entering. Those who chased the top lost an average of 71% within three hours.
How AI catches it vs. human: Humans see the price spike after it has already happened and feel the pull of FOMO. AI detects the combination of signals simultaneously — abnormal volume acceleration, social mention surge, low-float token characteristics (tokens with a small circulating supply that are easier to manipulate), and known pump-group wallet activity — and classifies the event as a high-probability manipulation pattern before the peak.
3. Wash Trading
What it looks like: A token shows impressively high trading volume — sometimes tens of millions per day — but the price barely moves. The order book looks suspiciously symmetrical. The same quantities appear repeatedly at nearly identical price levels.
What is wash trading in simple terms? It is the equivalent of selling your own car to yourself. You list it for sale, you buy it from your own listing, and now the market thinks a car was sold. Multiply that by thousands of transactions, and you have a token that appears wildly popular when nobody is actually trading it.
Real 2026 example: A newly listed exchange token reported $45M in daily volume during Q1 2026. Blockchain analysis revealed that 82% of trades originated from a cluster of 14 wallets, all funded by the same source wallet. Actual organic volume was closer to $8M. Traders who relied on volume as a health signal were misled into believing the token had strong market interest.
How AI catches it vs. human:
Wash Trading Indicator
What AI Checks
Circular fund flows
Same tokens moving through a loop of wallets back to origin
Volume-to-unique-address ratio
High volume with suspiciously few unique participants
Order book symmetry
Buy and sell walls that mirror each other too perfectly
Price impact ratio
High volume that produces near-zero price movement
Temporal patterns
Trades occurring at regular intervals (bot signatures)
A human trader might suspect wash trading when volume feels "off," but proving it requires tracing hundreds of wallet addresses and analyzing transaction timestamps. AI performs this analysis continuously, scoring each token's volume authenticity in real time.
4. Whale Accumulation and Distribution
What it looks like: Large wallets — those holding $1M or more of a single token — begin moving their positions in a coordinated direction. During accumulation, they buy in small batches across multiple exchanges and wallets to avoid detection. During distribution, they sell gradually, often using decentralized exchanges (DEXs) to reduce visibility.
Real 2026 example: Between April 2 and April 14, 2026, on-chain data showed five wallets accumulating a combined 2.1 million SOL (worth roughly $370M at the time). Each purchase was broken into transactions of 5,000-15,000 SOL, spread across Binance, Bybit, and Jupiter DEX. The buying was invisible on standard price charts — SOL moved less than 2% during the entire accumulation window. On April 16, a major institutional partnership was announced. SOL rallied 15.4% in three days.
How AI catches it vs. human: You cannot manually monitor thousands of wallets across multiple chains and exchanges. AI tracks wallet clusters, identifies connected addresses through shared funding sources, and aggregates their net position changes into a single "whale flow" metric. When whale flow shifts decisively — for example, net inflows of more than 2x the 30-day average over 48 hours — the system generates an accumulation or distribution alert.
This is the foundation of smart money flow analysis — tracking what experienced, well-capitalized participants are doing with their positions, and using that information as a leading indicator.
5. Flash Crash Early Warning
What it looks like: A token drops 15-40% in under 5 minutes, often on no news whatsoever. The crash is triggered by a chain reaction: a large market sell order eats through thin order book liquidity (the available buy orders near the current price), triggering stop losses, which trigger more selling, which triggers leveraged long liquidations (exchanges forcibly closing borrowed-money positions), which trigger even more selling. The entire cascade can take less than 90 seconds.
Real 2026 example: In February 2026, a top-50 altcoin lost 28% of its value in 47 seconds on a major exchange. The trigger: a single sell order of $3.2M hit a section of the order book where only $800K of buy-side liquidity existed. The gap caused an instant 9% price drop, which cascaded into $47M of leveraged long liquidations across three exchanges. By the time traders could react, the damage was done. The token recovered 60% of the drop within an hour — but anyone with a leveraged position was already liquidated.
How AI catches it vs. human:
AI monitors three preconditions that frequently precede flash crashes:
Thin order book depth — When buy-side liquidity within 2% of the current price drops below a critical threshold relative to the token's average daily volume
High open interest relative to spot volume — When the total value of outstanding leveraged positions (open interest) significantly exceeds normal trading activity, creating liquidation fuel
Concentration risk — When a small number of wallets hold a disproportionate share of open positions, meaning one actor can trigger the cascade
These three signals together form a "fragility score." When all three are elevated simultaneously, AI issues a flash crash warning — often 2-6 hours before the event occurs. No human trader is checking order book depth ratios at 3 AM on a Tuesday, but AI never stops watching.
How AI Detects Anomalies — The Plain-Language Explanation
Understanding How AI Detects Anomalies — The Plain is a key part of crypto technical analysis. Most professional trading indicators on any crypto trading platform will help you apply these concepts in real time.
You do not need to understand machine learning to use anomaly detection effectively. But understanding the basic logic helps you trust the signals and interpret them correctly.
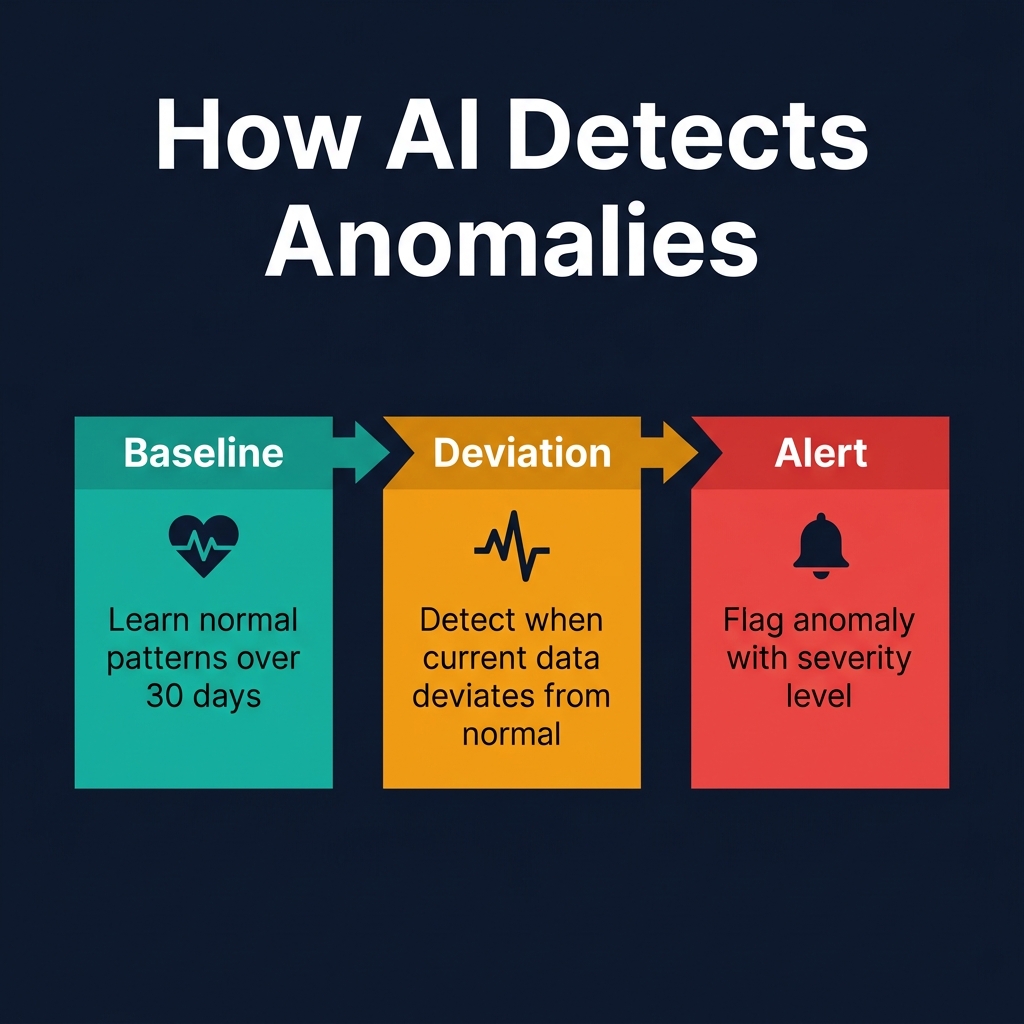
The process works in three stages — and it is remarkably similar to how a doctor monitors your health.
Stage 1: Establish the Baseline (What Does "Normal" Look Like?)
Just as a doctor measures your resting heart rate, blood pressure, and weight during a routine checkup, AI establishes a baseline for every token it tracks. This includes:
Average hourly and daily volume over the past 30 and 90 days
Typical price volatility ranges (how much does this token normally move per hour, per day?)
Standard order book depth profiles (how much liquidity sits within 1%, 2%, 5% of the current price?)
On-chain activity baselines (average number of unique active addresses, average transaction sizes, typical exchange inflow/outflow ratios)
Social mention baselines (normal daily mention count, typical sentiment ratio)
Each token has its own baseline. BTC's normal volume is measured in billions — a $50M spike is nothing. A micro-cap meme coin's normal volume might be $500K — a $3M spike is a five-alarm event. AI understands the difference.
Stage 2: Measure the Deviation (Is Something Abnormal Happening?)
Once baselines are established, AI continuously compares real-time data against those baselines. The key concept is statistical deviation — how far is the current reading from what is expected?
Think of it like body temperature. A reading of 37 degrees Celsius is normal. A reading of 38 degrees is slightly elevated — worth watching but not alarming. A reading of 40 degrees is a medical emergency.
AI applies the same logic to market data:
Deviation Level
Market Equivalent
AI Response
Within 1x baseline
Normal trading day
No alert
1.5-2x baseline
Mildly elevated activity
Internal flag, no user alert
2-3x baseline
Unusual — something may be developing
Low-priority alert
3-5x baseline
Highly unusual — requires attention
Medium-priority alert
5x+ baseline
Extreme anomaly — likely manipulation or major event
High-priority alert
The thresholds are not arbitrary — they are calibrated against historical data to minimize false alarms while catching real events.
Stage 3: Generate the Alert (What Should You Know?)
When a deviation crosses the alert threshold, the AI does not just say "something is happening." It provides context:
What type of anomaly was detected (volume, price, on-chain, social, or a combination)
Which token and on which exchange or chain
Severity score based on deviation magnitude and historical precedent
Possible explanations — is there a known catalyst (news, listing, governance vote) or is the anomaly unexplained?
Recommended action — watch, reduce exposure, or investigate further
This context is what separates useful anomaly detection from raw noise.
Comparison: AI Detection Methods
Not all AI approaches work equally well for every anomaly type:
Detection Method
Best For
How It Works (Plain Language)
Limitations
Statistical threshold
Volume spikes, price outliers
Flags anything beyond X standard deviations from average
Misses slow, gradual manipulation
Pattern matching
Pump-and-dump, spoofing
Compares current behavior to known manipulation signatures
Cannot detect novel schemes
Cluster analysis
Wash trading, whale tracking
Groups related wallets and transactions by behavior similarity
Requires on-chain data access
Time-series forecasting
Flash crash prediction
Predicts expected values and flags major deviations from forecast
Less effective in regime changes
Multi-signal fusion
All types (highest accuracy)
Combines volume, price, on-chain, and social signals into composite score
Requires more data and compute
The most effective systems — including what CoinXSight uses — combine multiple methods. A volume spike alone might be normal. A volume spike plus a social mention surge plus abnormal wallet activity? That is a signal worth acting on.
Reading Anomaly Alerts: A Decision Framework
Here is the most important lesson in this guide: not every anomaly is dangerous, and not every anomaly is an opportunity. Some anomalies are false alarms — a large OTC trade (over-the-counter — a private transaction negotiated directly between two parties, not on an exchange) that briefly distorted volume, or a whale moving funds between their own wallets.
You need a framework for deciding what to do when an anomaly alert hits your screen.
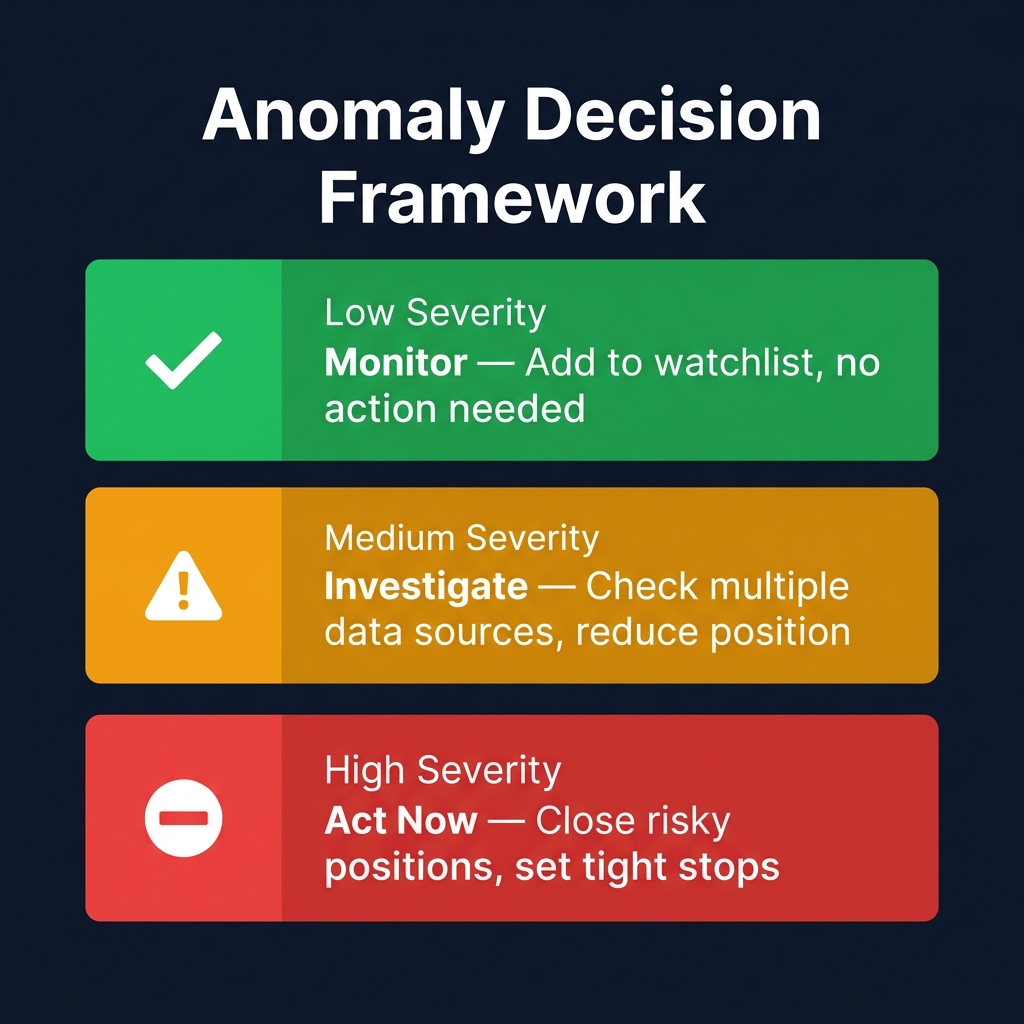
The Traffic Light System
Green Light — Potential Opportunity
The anomaly suggests informed buying or accumulation. Signals in this category include:
Whale wallets accumulating without price increase (smart money positioning before news)
Volume spike with steady price rise and increasing on-chain activity (organic demand)
Exchange outflows increasing while price consolidates (supply being removed from markets)
Action: Add to your watchlist. Monitor for 24-48 hours. If the signal persists and aligns with your own analysis, consider a position. Cross-check with CoinXSight's ASI Score for additional confirmation.
Yellow Light — Watch Closely, Don't Act Yet
The anomaly is real but ambiguous. It could develop into either an opportunity or a danger. Signals in this category include:
Volume spike without clear price direction (could be accumulation or distribution)
Social mention surge that is not yet reflected in price (could be organic hype or coordinated pump)
Order book suddenly thickening on one side (could be genuine support or spoofing)
Action: Set specific alerts for the next development. Do not enter a new position. If you already hold the token, tighten your stop loss. Wait for a second confirming signal before acting.
Red Light — Danger, Protect Yourself
The anomaly shows characteristics of manipulation or imminent risk. Signals in this category include:
Pump-and-dump signature: price up 50%+ in under 2 hours with social media explosion and low-float token
Flash crash preconditions: thin order book + high leverage + concentrated positions
Distribution pattern: whale wallets selling into rallies while social sentiment remains bullish (smart money exiting while retail enters)
Wash trading confirmed: volume anomaly with circular wallet flows
Action: Do NOT buy. If you hold the token, consider reducing your position or setting a tight stop. If the anomaly involves a broader market signal (flash crash warning on BTC), review your portfolio-wide exposure and reduce leverage.
Four Questions to Ask for Every Alert
Before you react to any anomaly alert, answer these four questions:
Is there a known catalyst? Check news feeds, governance forums, and social channels. If the anomaly has a legitimate explanation (exchange listing, protocol upgrade, partnership announcement), it may not be manipulation — it may be the market pricing in real information.
What is the confidence level? A multi-signal anomaly (volume + on-chain + social all firing simultaneously) deserves more attention than a single-signal flag. One elevated metric can be noise. Three elevated metrics rarely are.
What is the token's profile? Anomalies on BTC or ETH are far less likely to be manipulation than anomalies on a $5M market cap meme coin. Market cap, liquidity depth, and decentralization all affect how seriously you should take the alert.
What is my current exposure? If you do not hold the token and are not planning to trade it, a manipulation anomaly is informational — not actionable. If you hold a leveraged position on the token, even a low-confidence flash crash warning demands attention.
Real Case Studies From 2026
Case Study 1: Meme Coin Pump-and-Dump Caught by Volume + Social Spike
2:15 PM UTC: Social monitoring detected a 900% spike in DOGEMOON mentions on X, concentrated among accounts created within the previous 30 days
2:18 PM UTC: Volume anomaly detected — hourly volume jumped from $45K baseline to $1.2M (26x deviation)
2:22 PM UTC: AI classified the event as "High probability pump-and-dump" based on the combined signature: new-account social surge + explosive volume + low market cap + no news catalyst
2:15-3:45 PM UTC: DOGEMOON price rose from $0.0034 to $0.0142 (+318%)
3:46 PM UTC: Price collapsed. By 4:30 PM, it traded at $0.0028 — below where the pump started
Timeline of AI alerts:
First alert at 2:22 PM: "Anomaly detected — DOGEMOON showing pump-and-dump signature. Confidence: 87%. Recommended action: Do not buy."
Second alert at 3:30 PM: "DOGEMOON pump phase likely peaking. Distribution activity detected from early accumulation wallets."
Outcome for alert users: Traders who received and trusted the alert avoided entering during the hype phase. Those who ignored the alert and chased the pump lost an average of 65-80% within two hours.
Case Study 2: Whale Accumulation on SOL Before a 15% Rally
Token: SOL (Solana)
Date: April 2-16, 2026
What happened:
April 2-14: On-chain monitoring identified five large wallets systematically purchasing SOL in small batches. Net whale inflow over 12 days: 2.1 million SOL (~$370M)
April 6: AI flagged "Whale accumulation anomaly" — net whale inflow exceeded 2.5x the 90-day average for SOL
April 8-14: SOL price remained flat, trading between $174 and $179. No visible signal on the price chart
April 16: Major institutional partnership announced. SOL rallied from $178 to $205 over three days (+15.4%)
Timeline of AI alerts:
April 6 alert: "SOL whale accumulation detected. Five clustered wallets, net inflow 2.5x baseline. No news catalyst identified. Green light classification — potential smart money positioning."
April 10 alert: "SOL whale accumulation continues. Cumulative inflow now 3.1x baseline over 8 days. Pattern consistent with pre-announcement positioning."
Outcome for alert users: Traders who began building a SOL position after the April 6 alert entered between $174 and $178. The April 16 rally gave them a 15%+ return. Those without anomaly detection had no reason to pay attention to SOL during a flat, unexciting two-week window.
Whale tracking is one of the most powerful applications of AI anomaly detection. For a deep dive into interpreting whale flows, see the Smart Money Flow Guide.
Case Study 3: Flash Crash on a Mid-Cap Token Due to Liquidity Gap
Token: RENDER (top-50 by market cap)
Date: February 19, 2026
What happened:
February 18, 10 PM UTC: AI detected deteriorating order book conditions on RENDER across two major exchanges. Buy-side liquidity within 2% of the market price had dropped to 31% of the 30-day average
February 18, 11 PM UTC: Open interest on RENDER perpetual futures reached 4.8x the 90-day average spot volume — an extreme leverage ratio
February 19, 1:14 AM UTC: A $3.2M market sell order hit the thin order book. Price dropped 9.2% in 12 seconds, triggering a cascade of 847 leveraged long liquidations totaling $47M. RENDER fell 28% in 47 seconds before bouncing
February 19, 2:30 AM UTC: RENDER had recovered to -11% from pre-crash levels. Most leveraged traders were already liquidated and could not benefit from the recovery
Timeline of AI alerts:
February 18, 10:15 PM alert: "RENDER flash crash risk elevated. Order book depth at 31% of baseline. Open interest ratio at extreme levels. Yellow-to-red classification. Recommended: reduce leverage exposure."
February 19, 1:14 AM alert: "RENDER flash crash in progress. Cascading liquidations detected."
Outcome for alert users: Traders who acted on the pre-crash warning had approximately 3 hours to reduce leverage or set wider stops. Those with no warning system were liquidated during the 47-second crash. The difference between a 28% loss and a managed exit was a single alert received at 10:15 PM.
Protecting Yourself: 5 Practical Rules for Avoiding Manipulation Traps
Rule 1: Never Chase a Vertical Move
If a token has already risen 50%+ in under two hours, you are not early — you are late. The people who are early bought days or weeks ago during the accumulation phase. A vertical price move with no prior consolidation is the textbook distribution zone where insiders sell to latecomers.
The rule: If you did not buy before the spike, do not buy during the spike. Wait for the dust to settle and evaluate the token on its fundamentals afterward.
Rule 2: Verify Volume Before Trusting Volume
High volume is meaningless if it is not organic. Before treating volume as a confirmation signal, check:
Is the volume concentrated on one exchange, or is it distributed across multiple venues?
Does the number of unique trading addresses match the volume level?
Is the price actually moving proportionally to the volume, or is it suspiciously flat?
If volume is high but concentrated on a single obscure exchange with minimal price impact, treat it as potentially fabricated.
Rule 3: Use a Multi-Signal Confirmation Rule
Never act on a single anomaly signal in isolation. Require at least two independent signals to confirm before taking action:
Scenario
Signal 1
Signal 2
Confidence
Bullish accumulation
Whale inflow spike
Exchange reserves declining
High
Pump-and-dump
Volume explosion
Social mention surge from new accounts
High
Flash crash risk
Thin order book
Extreme open interest ratio
High
Unclear
Volume spike only
No confirming signal
Low — wait
Rule 4: Size Your Positions for the Anomaly Environment
Tokens with active anomaly alerts should receive smaller position sizes than normal. If AI flags unusual activity on a token you are considering, reduce your standard position size by 50% and set tighter stops.
Normal market: 1-2% portfolio risk per trade
Active anomaly detected: 0.5-1% portfolio risk, stop loss within 3-5% of entry
Rule 5: Set Alerts, Not Screen Time
You cannot stare at charts 24/7, and you should not try. The entire point of AI anomaly detection is to let the system watch and alert you only when it matters.
Set up push notifications for high-priority anomaly alerts on your watchlist tokens
Review lower-priority alerts once per day during your morning analysis session
Trust the system to wake you up when something requires immediate attention
How CoinXSight Detects Anomalies in Practice
CoinXSight integrates anomaly detection across multiple modules, giving you a unified view of unusual market activity without needing to build your own monitoring stack.
Whale Netflow Alerts
The Exchange Flow Analysis module tracks large wallet movements across major exchanges and blockchains. When net whale inflow or outflow for a tracked token exceeds historical baselines, you receive a classified alert — accumulation, distribution, or exchange repositioning — with the supporting data behind the classification.
Alpha Hunter Unusual Activity Flags
The Alpha Hunter module scans 500+ tokens across multiple timeframes. Beyond standard trend and momentum signals, Alpha Hunter flags unusual activity patterns: volume anomalies, sudden correlation breaks (a token moving opposite to the market without explanation), and abnormal social-to-price divergences.
ASI Score Sudden Changes
Every token tracked by CoinXSight receives an ASI (Alpha Signal Index) score that combines 12+ technical, on-chain, and sentiment indicators. When the ASI score changes by more than 15 points within a 24-hour window, the system flags it as an anomaly. A rapid ASI increase often signals emerging momentum; a rapid decrease may signal distribution or deteriorating fundamentals.
Your 4-Step Anomaly Response Workflow
Step 1 — Receive the alert. CoinXSight sends anomaly notifications via your configured channels (dashboard, push notification, or Telegram). Each alert includes the anomaly type, affected token, severity score, and a link to the detailed analysis.
Step 2 — Check the context. Open the token's CoinXSight dashboard. Review the ASI Score, whale netflow data, and any recent Alpha Hunter signals. Is the anomaly supported by multiple independent data sources, or is it a single-signal flag?
Step 3 — Apply the traffic light framework. Based on the anomaly type and your context check, classify it as green (opportunity), yellow (watch), or red (danger). Use the four decision questions outlined earlier in this guide.
Step 4 — Act or archive. If the signal is green and confirmed, consider a position. If yellow, set a follow-up alert and wait for the next development. If red, protect your existing positions. Log every anomaly and your response to it — this data improves your judgment over time.
The combination of Alpha Hunter scanning, ASI scoring, and whale flow tracking gives you the multi-signal confirmation that separates reliable anomaly detection from false alarms. Explore CoinXSight's anomaly detection tools.
FAQ
Q: How often do AI anomaly alerts fire on a typical day?
For a watchlist of 20-30 tokens, expect 1-3 low-priority alerts per day and 1-2 medium or high-priority alerts per week. The system filters heavily to avoid alert fatigue — only statistically significant deviations reach your notification channels.
Q: Can AI detect manipulation on decentralized exchanges (DEXs)?
Yes, but with more limited data. On centralized exchanges, AI has access to order book depth, funding rates, and standardized trade data. On DEXs, AI relies primarily on on-chain transaction data, wallet tracking, and liquidity pool analysis. Detection accuracy on DEXs is typically 10-15% lower than on centralized venues.
Q: Does anomaly detection work for Bitcoin and Ethereum, or only small-cap tokens?
It works for all tokens, but the types of anomalies differ. BTC and ETH are too large and liquid for simple pump-and-dump schemes, but they are still subject to whale accumulation/distribution patterns, flash crash risks during low-liquidity periods, and spoofing on individual exchanges. Small-cap tokens are vulnerable to all five anomaly types.
Q: How do I know if a volume anomaly is organic buying or wash trading?
Check the volume-to-unique-address ratio. Organic volume involves hundreds or thousands of unique addresses. Wash trading typically involves a small cluster of addresses generating high transaction counts. CoinXSight's volume authenticity scoring provides this ratio automatically for tracked tokens.
Q: Should I immediately sell when a red-light anomaly is detected on a token I hold?
Not necessarily. A red-light alert means "protect yourself," not "panic sell." The appropriate response depends on your position size, leverage, and time horizon. If you hold a spot position with a long-term thesis, tightening your stop loss may be sufficient. If you hold a leveraged position, reducing exposure quickly is prudent. The key is to have a plan before the alert arrives.
AI anomaly detection is not about predicting the future — it is about seeing the present more clearly than everyone else. Pump-and-dump schemes, whale manipulation, wash trading, and flash crashes all leave data trails that are invisible to the human eye but obvious to an AI monitoring millions of data points per second. The traders who survive and profit in crypto are not the fastest clickers — they are the ones with the best information systems. Set up your anomaly alerts, trust the framework, and let the AI watch what you cannot.
Which crypto trading platform is best for ai anomaly detection analysis?
CoinXSight offers ai anomaly detection alongside 12+ other trading indicators, AI-powered Confluence Scoring, and Smart Money Concepts u2014 making it a comprehensive crypto analytics platform for technical analysis.
KZ
Dr. Kevin Zhang
AI // QUANT LABS
Principal AI & Quantitative Researcher·Deep Alpha Engine Labs
Ph.D. in Computational Statistics. Leads machine learning architecture, regime-switching detection, and automated execution systems at CoinXSight Labs.
QUANTITATIVE SUITE // DEEP ALPHA ENGINEACTIVE
BTC/USDT // LIVE SCANNER
CONFLUENCE 80
LIVE SPOT PRICE$82,245.93MODERATE_SELL
TP2
$72,558.06
+-12.20%
TP1
$78,605.39
+-4.88%
ENTRY
$82,636.95
ZONE
SL
$84,652.73
2.44%
Auto-detect Order Blocks, Fair Value Gaps and risk-adjusted DCA ladders in < 5s.