Every trader on every exchange has access to RSI, MACD, and Bollinger Bands. Your charting platform shows them. Your neighbor's charting platform shows them. The person on the other side of your trade sees them too. When a thousand traders spot the same "oversold" RSI reading and buy at the same time, the edge disappears before anyone profits.
Standard indicators have a deeper problem beyond crowding: they only look at price and volume. That is like evaluating a restaurant by reading only the menu. The menu tells you what is offered and what it costs, but it tells you nothing about ingredient quality, kitchen hygiene, customer satisfaction, or whether the chef just quit. You need more context to make a good decision.
AI indicators are the equivalent of seeing the kitchen, inspecting the supply chain, reading every customer review, and checking the health inspection report — all before deciding whether to walk in the door.
The Core Limitations of Traditional Indicators
Here is what you are working with when you rely solely on RSI, MACD, or moving average crossovers:
Limitation
What It Means in Practice
Single data source
Only sees price and volume — blind to on-chain activity, whale behavior, cross-market flows
Fixed formula
RSI(14) produces the same calculation whether BTC is in a bull run, a bear market, or a sideways chop
No learning
The indicator does not improve over time. It made the same mistakes in 2020 that it makes in 2026
Universal access
Every trader sees the exact same signal at the exact same time, eliminating any informational edge
Binary thinking
Most traditional signals boil down to "overbought" or "oversold" with no nuance or probability attached
These tools are not useless — they have been valuable for decades. But in a market where speed and information depth determine winners, relying solely on indicators invented in the 1970s puts you at a structural disadvantage against AI-powered tools processing thousands of data points per second.
What Makes AI Indicators Different
An AI indicator does not replace your analysis. It upgrades it. Think of the difference like this: a traditional indicator is a thermometer (it tells you the current temperature), while an AI indicator is a weather forecast (it combines temperature, humidity, wind patterns, satellite imagery, and historical weather data to predict what happens next).
Traditional vs. AI Indicators: A Side-by-Side Comparison
Learned from thousands of historical market scenarios
Adaptability
None — parameters stay static forever
Continuously retrains on new data and adapts to regime shifts
Output
A number (e.g., RSI = 28)
A probability score with confidence level (e.g., "72% chance of 2%+ move, confidence: HIGH")
Unique edge
Zero — everyone sees the same thing
High — different data combinations and training produce unique signals
Context awareness
None — same formula in bull, bear, or sideways markets
Detects market regime and adjusts signal weights accordingly
The critical insight here is not that AI indicators are "smarter" — it is that they can process types of information that traditional formulas physically cannot. RSI has no way to factor in whale wallet movements. MACD cannot account for exchange outflows. Bollinger Bands cannot see that ETH/BTC correlation just broke down for the first time in three months.
AI indicators can see all of that simultaneously, weigh it, and deliver a single actionable signal.
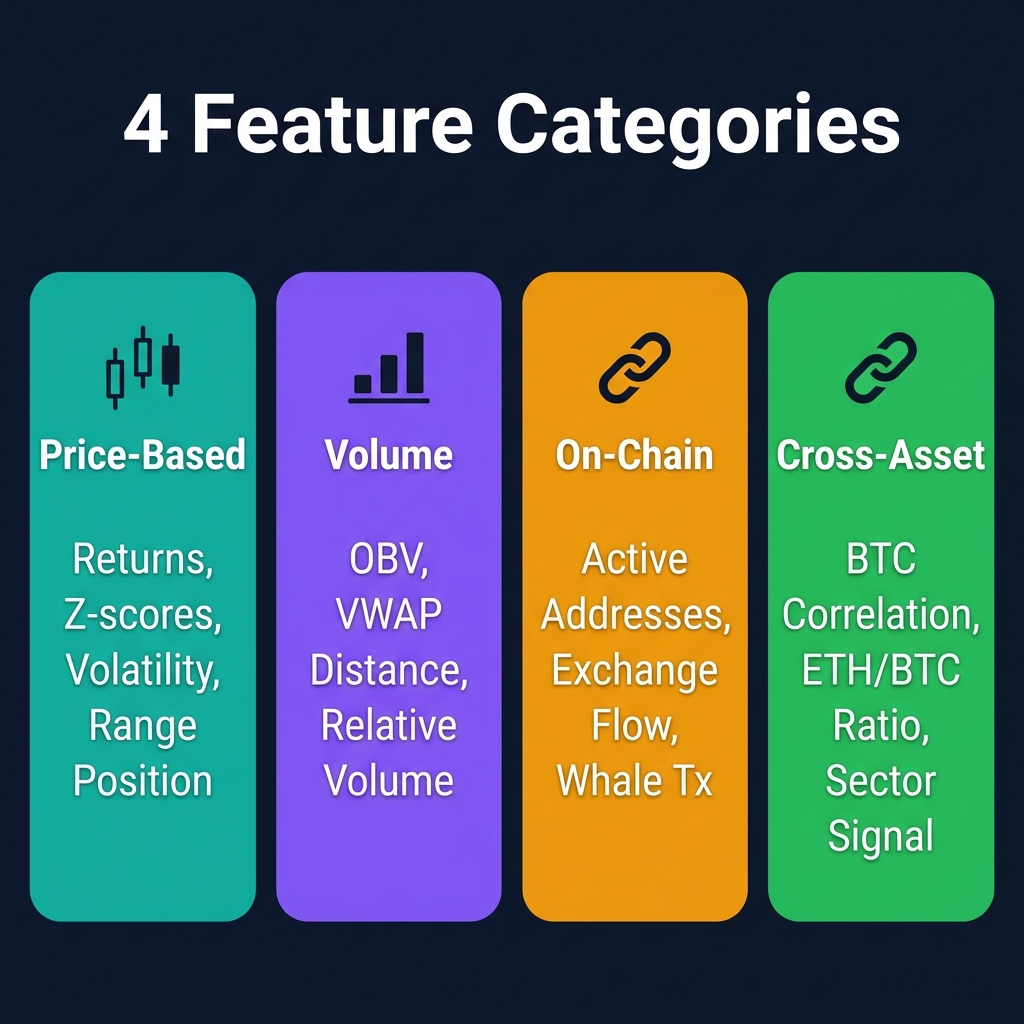
The 4 Types of Data AI Indicators Analyze
Understanding The 4 Types of Data AI Indicators Analyze is a key part of crypto technical analysis. Most professional trading indicators on any crypto trading platform will help you apply these concepts in real time.
Think of an AI indicator as a detective building a case. No single witness tells the whole story — the detective needs testimony from multiple sources, then pieces together what actually happened and what is likely to happen next.
AI indicators gather evidence from four key "witnesses," each telling a different part of the market story.
Witness 1: Price Patterns — How Price Moves, Not Just Where It Is
Traditional indicators ask: "Where is the price?" AI indicators ask a much deeper question: "HOW is the price getting there?"
There is a massive difference between BTC rising from $105,000 to $108,000 in a smooth, steady climb over two weeks versus spiking from $105,000 to $108,000 in a single four-hour candle. Both reach the same price, but the implications for what happens next are completely different.
AI indicators analyze price behavior across multiple dimensions:
What AI Measures
What It Reveals
Real Example (May 2026)
Momentum shifts
Is the move accelerating or slowing down?
BTC's daily returns shrank from 1.2% to 0.3% over five days — momentum fading before the pullback to $104,800
Volatility changes
Is the market getting calmer or more explosive?
SOL's hourly volatility dropped 60% before the May 22 breakout past $185 — the calm before the storm
Price relative to range
Where is price sitting within its recent channel?
ETH trading at $2,680 was in the top 15% of its 30-day range, signaling potential resistance ahead
Trend strength
Is the trend getting stronger or weakening?
BTC's 50-period trend slope turned flat after two weeks of gains — early warning of the consolidation phase
The key principle: AI does not just look at the current price. It examines the character of price movement — its speed, its consistency, its volatility context — and uses that behavioral signature to assess what comes next.
Witness 2: Volume Signals — Following the Money
Price tells you what happened. Volume tells you whether anyone actually meant it.
A breakout on thin volume is like a rumor with no sources — it might be true, but there is no conviction behind it. AI indicators treat volume as a lie detector for price movements.
Volume Signal
What It Means
Why It Matters
Price up + Volume up
Strong buyers are committed
Genuine breakout — the move has legs
Price up + Volume down
Rally is running on fumes
Likely fake-out — be cautious about chasing
Volume spike with flat price
Huge activity with no price movement
Accumulation or distribution happening invisibly. Something big is being set up
Volume relative to average
Is today's activity normal or unusual?
BTC trading 3x its 7-day average volume signals an institutional-level event
AI indicators go further than raw volume numbers. They calculate whether money is flowing into or out of an asset over time, track the gap between current price and the volume-weighted average price (a key institutional anchor), and spot divergences where price and volume tell conflicting stories — one of the most reliable warning signals in any market.
Witness 3: On-Chain Activity — Who Is Buying and Selling
This is crypto's superpower. In traditional stock markets, you cannot see who is buying or selling until quarterly reports arrive months later. In crypto, every transaction is recorded on a public blockchain in real time.
AI indicators use this transparency to track what smart money is actually doing:
On-Chain Signal
What It Reveals
Practical Implication
Whale wallet movements
Large holders (1,000+ BTC) are accumulating or distributing
When whales move coins to exchanges, selling pressure is likely incoming
Exchange inflows/outflows
Net movement of coins to or from exchanges
Net outflows = accumulation (bullish). Net inflows = preparation to sell (bearish)
Active address growth
Whether network usage is increasing or declining
Sustained active address growth preceded every major BTC rally in 2024-2026
Smart money tracking
Wallets with historically profitable timing are moving
When addresses that bought the 2024 dip start selling, attention is warranted
Real example: In early May 2026, on-chain data showed 14,200 BTC flowing out of exchanges over a seven-day period, even as BTC's price consolidated around $106,000. This accumulation signal — invisible on any price chart — preceded the rally to $111,500 two weeks later. Traders using only RSI and MACD saw a boring sideways market. AI indicators tracking on-chain flows saw quiet accumulation by informed participants.
Witness 4: Cross-Asset Relationships — Nothing Moves in Isolation
No crypto asset lives in a vacuum. BTC sneezes, and altcoins catch a cold. ETH rallies, and the entire DeFi sector follows. Understanding these relationships — and more importantly, when they break — gives AI indicators a structural edge.
Cross-Asset Signal
What It Tells You
Trading Implication
BTC-altcoin correlation
Are alts moving in lockstep with BTC or decoupling?
Correlation breakdown often signals the start of alt season or a flight to safety
ETH/BTC ratio momentum
Is capital rotating from BTC into ETH or vice versa?
Rising ETH/BTC ratio = risk appetite increasing, altcoins likely to follow
Sector rotation
Which crypto sectors are gaining or losing relative strength?
When DeFi tokens outperform Layer-1s, capital is flowing toward yield-generating assets
BTC dominance trend
Is BTC gaining or losing market share?
Falling BTC dominance + rising total market cap = classic alt season setup
Think of cross-asset analysis as reading the flow of capital through the entire crypto ecosystem. Just as water flows downhill, capital flows toward the highest expected returns. AI indicators track these flows in real time, spotting shifts before they become obvious on individual price charts.
How AI Combines Data Into One Signal
You now understand the four types of evidence AI indicators collect. But four separate data streams are not a trading signal — they need to be combined into a single, actionable output. This is where the real magic happens.
The Weather Forecast Analogy
A weather forecast does not tell you the temperature and humidity and wind speed and barometric pressure separately, then leave you to figure out whether it will rain. It combines all of those inputs into a single prediction: "78% chance of rain this afternoon."
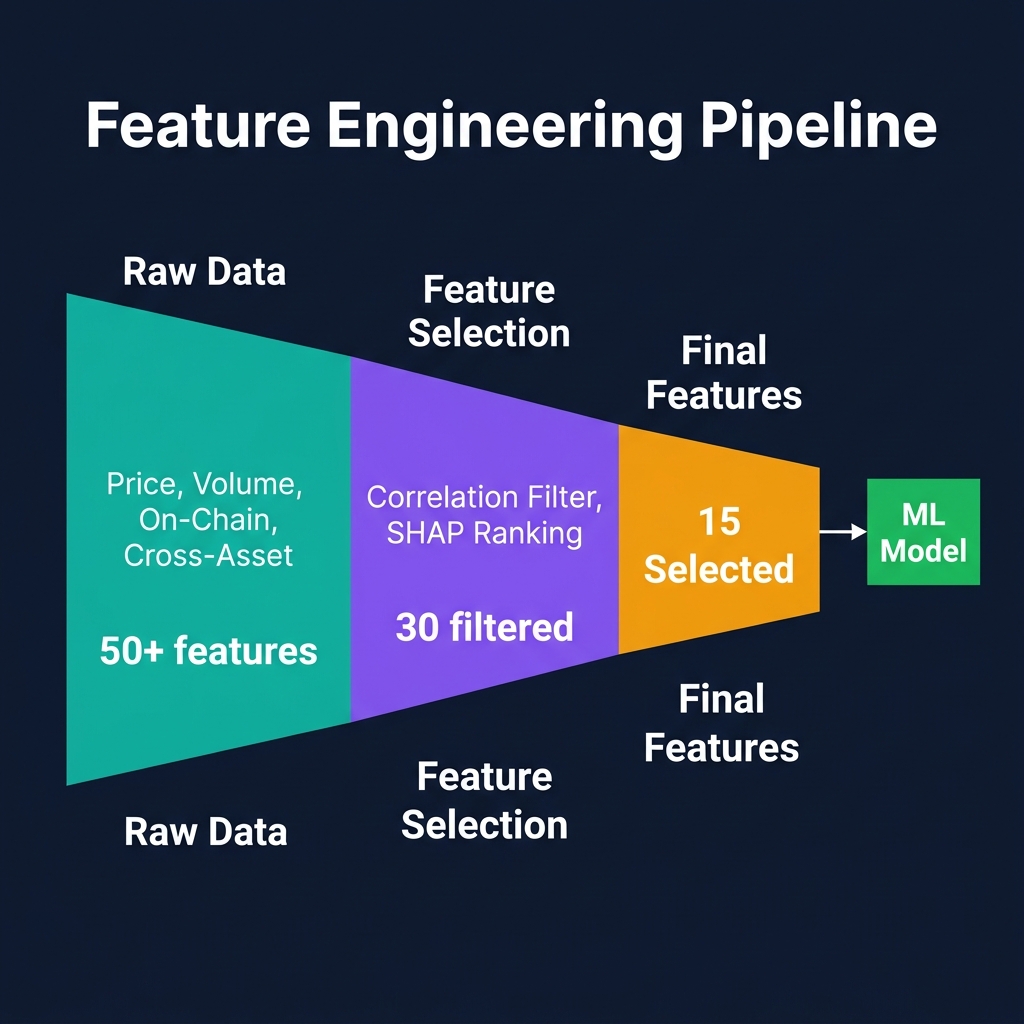
AI indicators work the same way. They take dozens of data points from the four categories above and produce a single confidence score — a number that tells you the probability of a specific outcome.
From Raw Data to Confidence Score: A Simplified View
Here is how the AI processes information to produce a signal, using a real example with BTC at $108,000 in late May 2026:
Data Point
Current Reading
What It Tells the AI
Signal Contribution
24-hour price momentum
+1.8%
Price is moving up, moderate speed
Slightly bullish (+)
Volatility ratio
0.65 (below average)
Market is calm — potential energy building
Neutral to bullish (+)
Volume relative to average
2.4x normal
Unusually high activity behind the move
Strongly bullish (++)
Volume-price agreement
Both rising
Buyers have conviction
Bullish (+)
Exchange net flow
-3,200 BTC (7-day)
Coins leaving exchanges — accumulation
Bullish (+)
Whale transactions
Up 40% vs. 14-day average
Large holders are active
Bullish (+)
BTC-ETH correlation
0.91 (high)
Market moving in sync — no divergence
Neutral (=)
Sector rotation
Slight alt outperformance
Risk appetite increasing
Slightly bullish (+)
Combined confidence score
76/100 — BUY
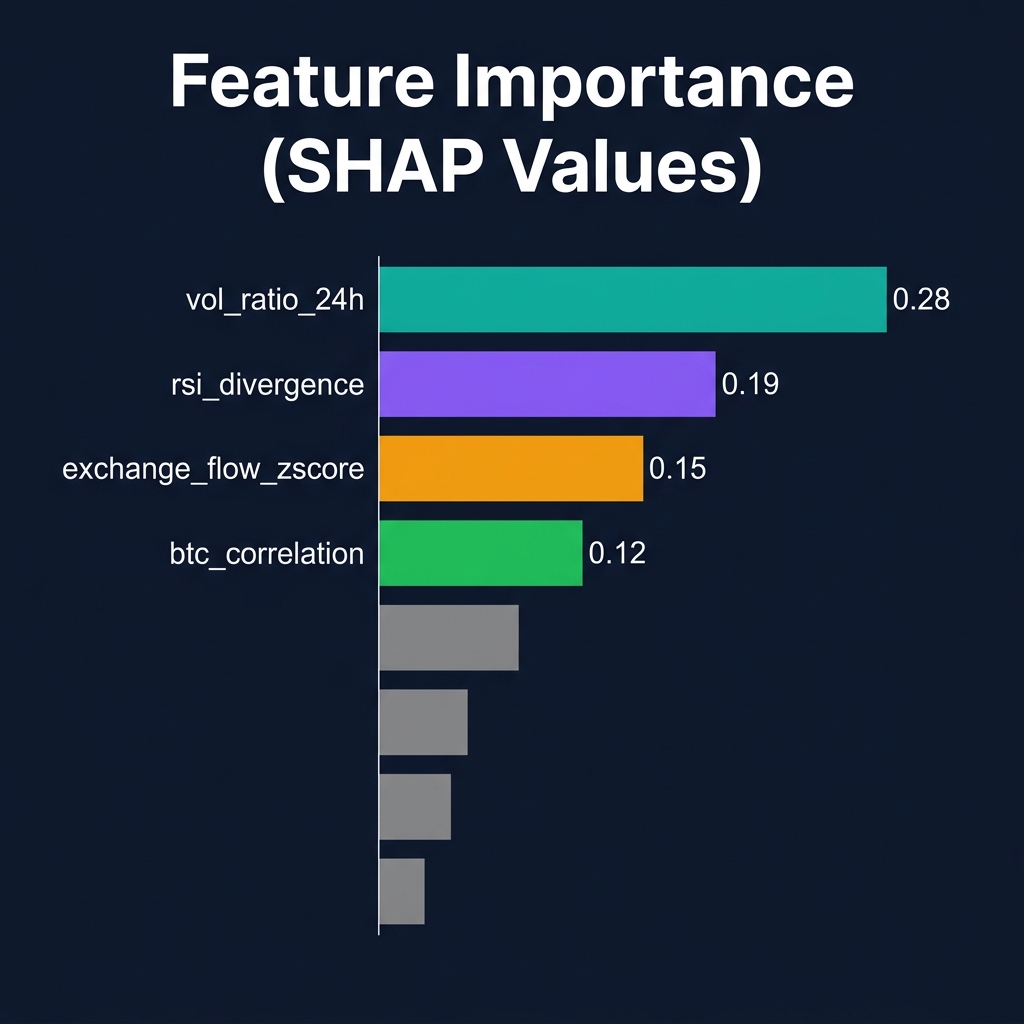
The AI does not simply add up "votes." It uses learned weights — some data points matter far more than others in specific market conditions. During trending markets, momentum and volume alignment carry heavy weight. During range-bound periods, on-chain flows and volatility compression become more important. The AI learned these context-dependent weights by studying thousands of historical market scenarios.
This is fundamentally different from a human trader manually checking eight different indicators and trying to weigh them in their head. The AI does it consistently, without fatigue, without recency bias, and without emotional attachment to a particular outcome.
Reading AI Indicator Signals: A Practical Guide
Understanding what an AI indicator outputs is just as important as understanding how it works. A signal you cannot interpret is useless, no matter how sophisticated the model behind it.
The Traffic Light System
The simplest way to think about AI indicator signals is through a traffic light framework:
Signal Tier
Confidence Score
What It Means
Recommended Action
STRONG_BUY
75-100
Multiple data sources strongly agree — high-probability bullish setup
Consider entering with full position size. Set stops below recent support
BUY
60-74
Moderate bullish lean — more data pointing up than down
Consider entering with reduced position size. Wait for confirmation if possible
NEUTRAL
40-59
Mixed signals — no clear directional edge
Stay on the sidelines. This is the AI saying "I do not have enough conviction either way"
Consider reducing exposure or tightening stops on existing longs
STRONG_SELL
0-24
Multiple data sources strongly agree — high-probability bearish setup
Consider exiting longs or hedging. Aggressive traders may look for short entries
What Confidence Scores Actually Mean
A confidence score is NOT a guarantee. It is a probability assessment based on historical patterns. Here is how to calibrate your expectations:
A score of 60% does not mean "price will definitely go up." It means: in historical scenarios that looked similar to the current one, prices moved favorably about 60% of the time. That is a meaningful edge over a coin flip, but it also means 40% of the time, the trade goes against you. This is why position sizing and risk management always matter, even with high-confidence signals.
A score of 85% is rare and powerful — but not infallible. When the AI produces a very high confidence score, it means nearly every data source it monitors is aligned. These setups historically have strong win rates, but they also tend to occur infrequently. If you are seeing 85%+ scores every day, something is likely wrong with the indicator.
The difference between 55% and 75% is enormous. A 55% win rate with proper risk management (2:1 reward-to-risk ratio) makes money over time. A 75% win rate with the same risk management generates substantial returns. Small improvements in accuracy compound dramatically over hundreds of trades.
Combining AI Signals With Your Own Analysis
AI indicators work best as one input in your decision-making process, not as an autonomous trading bot. Here is a practical framework for integration:
Your Analysis Says
AI Signal Says
Combined Action
Bullish (support held, pattern forming)
STRONG_BUY (score: 82)
High conviction entry — both independent analyses agree
Bullish (support held)
NEUTRAL (score: 51)
Proceed with caution — your read may be right, but the data is not confirming it yet
Bullish (support held)
SELL (score: 35)
Pause and investigate. The AI is seeing something you might be missing — check on-chain data and volume
No opinion (unclear chart)
STRONG_BUY (score: 78)
The AI has conviction you lack — worth a smaller position to test the signal
Bearish (breakdown likely)
STRONG_BUY (score: 80)
Major disagreement. One of you is wrong. Reduce size, set tight stops, and watch closely
The most valuable moments are when your analysis and the AI disagree. These disagreements force you to examine your assumptions and often reveal blind spots in your thinking.
What Makes a Good AI Indicator
Not all AI indicators are created equal. Some are genuinely useful tools that improve your trading decisions. Others are poorly designed, overfitted to historical data, or marketed with misleading accuracy claims. Here is how to tell the difference.
Quality Checklist: What to Look For vs. Red Flags
Quality Metric
What Good Looks Like
Red Flags
Consistency
Performs similarly in bull markets, bear markets, and sideways chop. Win rate stays within a stable range (e.g., 55-65%) across different periods
Claims 90%+ accuracy but only tested during one market phase. Backtest results look amazing but only cover a bull run
Accuracy vs. Precision
Balances catching winning trades (recall) with avoiding losing signals (precision). Does not sacrifice one for the other
"We catch every winning trade!" (but floods you with 50 false signals for every real one)
Adaptability
Regularly retrains on new data. Adjusts to changing market conditions. Acknowledges when confidence is low
Uses the same model from 2023 with no updates. Never outputs a NEUTRAL signal — always has a "confident" opinion
Transparency
Can explain WHY it generated a specific signal. Shows which data sources contributed most
Black box with no explanation. "Trust the signal" is the only guidance offered
Track record
Published, verifiable historical performance with realistic drawdown periods
Only shows cherry-picked winning trades. No losing periods visible anywhere
Signal frequency
Generates a reasonable number of signals (a few per week, not dozens per day)
Fires signals every hour. If everything is a signal, nothing is a signal
The Overfitting Warning
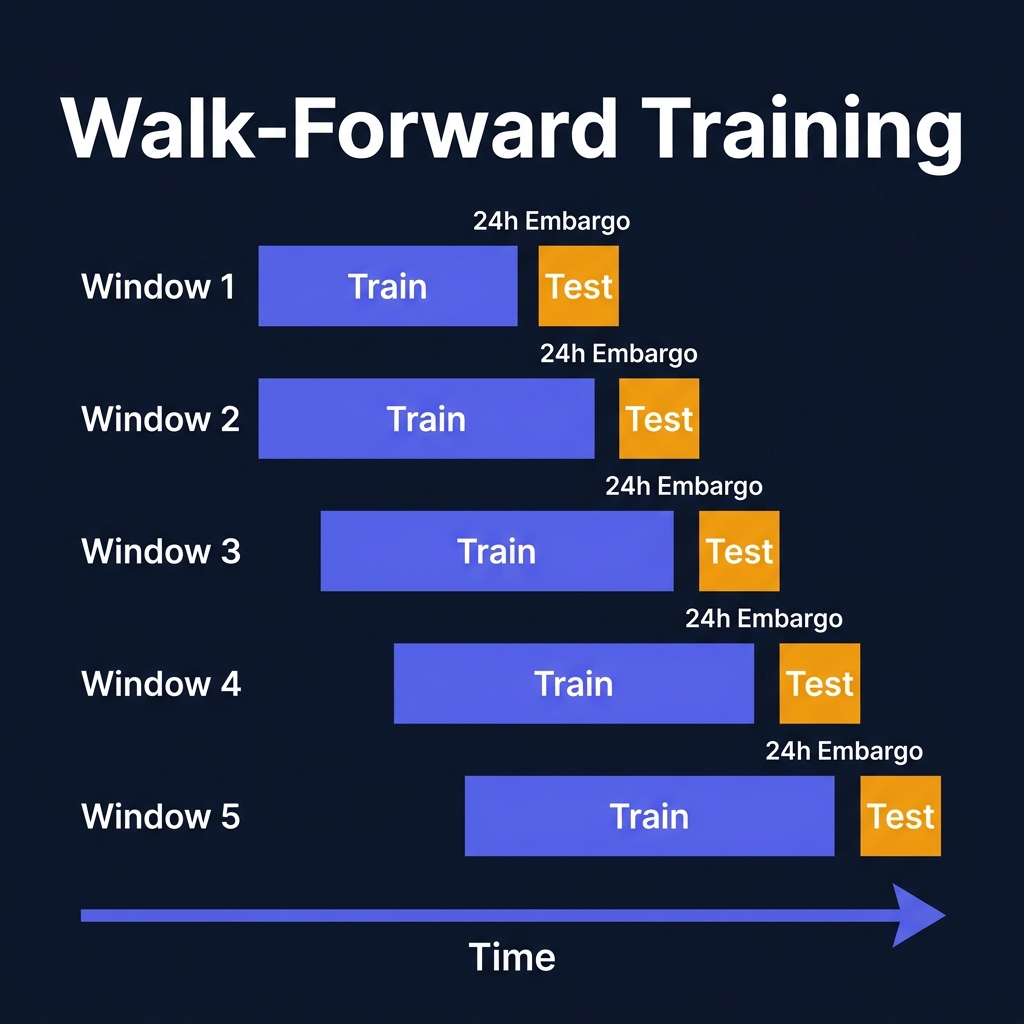
The single biggest danger with AI indicators is overfitting — when the model has memorized historical patterns so precisely that it fails completely on new data. This is like a student who memorizes every answer to last year's exam but cannot handle a single new question.
Signs of an overfitted indicator:
Backtest results show 80%+ accuracy, but live performance is below 50%
The indicator worked brilliantly for three months, then suddenly stopped working
It uses an absurdly large number of input features (100+ data points)
Signal performance varies wildly from one month to the next
A well-built AI indicator typically achieves 55-65% accuracy on out-of-sample data with consistent performance across market regimes. If something claims 85%+ accuracy in live trading, approach with extreme skepticism.
Common Mistakes When Using AI Indicators
Even the best AI indicator will lose you money if you use it poorly. Here are the five most common mistakes traders make — and how to avoid each one.
Mistake 1: Blindly Following Every Signal
The problem: Treating the AI like an infallible oracle and executing every signal without any filtering or personal judgment.
Why it fails: AI indicators produce signals across all market conditions, including situations where you have no business trading — low-liquidity overnight sessions, minutes before a major economic announcement, or during exchange maintenance windows.
The fix: Apply filters before acting on any signal. Ignore signals during known low-liquidity periods (weekends, overnight in your timezone). Skip signals that fire within 30 minutes of scheduled events (CPI releases, FOMC meetings, token unlocks). Only trade signals where your confidence score exceeds a minimum threshold you have personally validated.
Mistake 2: Ignoring Market Context
The problem: An AI indicator says STRONG_BUY, so you buy — without noticing that Bitcoin just dropped 8% in two hours due to a major exchange hack or regulatory announcement.
Why it fails: Most AI indicators analyze data on a specific timeframe (hourly, for example). They may not immediately capture extreme, fast-moving events. The model is computing features from the last 24-168 hours of data, so a sudden shock takes time to fully register.
The fix: Always check the macro context before executing a signal. If there is a major breaking news event, assume the AI's analysis is temporarily lagged. Wait for the dust to settle — usually 4-8 hours after an extreme event — before trusting the signals again.
Mistake 3: Using Too Many Indicators at Once
The problem: Stacking five different AI indicators, three traditional indicators, and two sentiment tools, then trying to make sense of conflicting signals.
Why it fails: This is analysis paralysis by another name. More indicators do not mean more accuracy. In fact, contradictory signals from too many sources often lead to either inaction (you never trade because something always disagrees) or cherry-picking (you subconsciously follow whichever indicator confirms your bias).
The fix: Use one primary AI indicator and one or two secondary confirmations at most. If your primary indicator gives a high-conviction signal and one secondary source agrees, that is enough. You do not need unanimous agreement from twelve different tools.
Mistake 4: Expecting 100% Accuracy
The problem: After three losing trades in a row, you abandon the AI indicator and declare it "broken."
Why it fails: Even a genuinely good indicator with 60% accuracy will produce three consecutive losses about 6% of the time. Five consecutive losses will occur about 1% of the time. Over hundreds of trades, these losing streaks are not just possible — they are mathematically guaranteed to happen eventually.
The fix: Judge an indicator over a minimum of 50-100 signals, not five. Track your win rate, average win size, average loss size, and overall profit factor over this full sample. If the indicator delivers a positive expectancy over 100 signals, it is working — regardless of any individual streak.
Mistake 5: Not Tracking Results
The problem: You receive AI signals, sometimes act on them, sometimes ignore them, and have no systematic record of what worked and what did not.
Why it fails: Without tracking, you cannot distinguish between a good indicator you are using poorly, a bad indicator you are using well, or random luck in either direction. You are flying blind.
The fix: Keep a signal journal. For every signal you receive, record the date, the asset, the signal direction and confidence score, whether you acted on it, the outcome, and any notes about market context. Review this journal monthly. Patterns will emerge that dramatically improve how you use the indicator.
How CoinXSight's AI Indicators Work
CoinXSight applies the principles described throughout this article at institutional scale — combining multiple data sources, applying machine learning, and delivering clear, actionable signals without requiring you to build or maintain anything yourself.
The Confluence Scoring System
CoinXSight's Confluence Scoring system is the practical embodiment of everything we have discussed. It gathers evidence from 12+ data sources, processes it through multiple AI models, and produces a single score (0-100) for each asset.
The system works in four layers, each answering a progressively deeper question:
Whale flows, exchange balances, active addresses, smart money tracking
"What are informed participants doing?"
Sentiment & Cross-Asset Layer
News sentiment, social trends, BTC correlation, sector rotation
"What is the broader market narrative?"
Each layer produces its own sub-score, and the Confluence system weighs them based on current market conditions. During trending markets, the technical and volume layers receive more weight. During range-bound markets, on-chain and cross-asset layers become more influential. This dynamic weighting is what separates a static scoring system from an adaptive one.
The ASI Score: Four Layers Simplified
The Aggregate Sentiment Index (ASI) Score condenses complex multi-layer analysis into a number any trader can understand:
0-20: Strongly bearish confluence. Most data sources agree the outlook is negative. Historical accuracy for downside moves at this level: approximately 68%
21-40: Bearish lean. More warning signs than positive signals, but not overwhelming consensus
41-60: Neutral zone. Mixed signals across data sources. The AI is saying "I do not have a strong read right now"
61-80: Bullish lean. Multiple data sources aligning toward positive momentum. This is where most actionable BUY signals originate
81-100: Strongly bullish confluence. Rare but powerful. When 12+ data sources agree, historical accuracy for upside moves exceeds 70%
Alpha Hunter Signals: AI Scouts for Opportunity
While the Confluence Score tells you the health of assets on your watchlist, Alpha Hunter proactively scans 200+ tokens to find opportunities you might miss. Think of it as having a team of analysts monitoring every corner of the crypto market 24/7.
Alpha Hunter signals come with:
Direction: BUY or SELL
Confidence level: How strongly the data supports the signal (LOW / MEDIUM / HIGH / VERY HIGH)
Key drivers: The top 2-3 data sources contributing most to the signal (e.g., "whale accumulation + volume breakout + bullish technical pattern")
Timeframe: Expected duration for the signal to play out (4h, 24h, 7d)
Your 5-Step Daily Trading Workflow With CoinXSight
Here is a practical, repeatable routine that takes less than 15 minutes:
Step 1 — Morning Scan (3 minutes). Open CoinXSight and check the Confluence Scores for your top 5-10 watchlist assets. Note any that have moved above 65 (bullish setup developing) or below 35 (bearish warning).
Step 2 — Alpha Hunter Review (3 minutes). Check the latest Alpha Hunter signals. Focus on HIGH and VERY HIGH confidence signals. Read the key drivers to understand WHY the AI flagged each opportunity.
Step 3 — Context Check (2 minutes). For any asset you are considering trading, glance at the ASI Score breakdown. Which layers are contributing most? If on-chain is strongly bullish but technicals are neutral, the move may need time to develop. If all four layers agree, conviction is high.
Step 4 — Decision and Execution (3 minutes). Compare the AI signals with your own chart analysis. If both your read and CoinXSight agree, size up. If they disagree, size down or wait. Execute your trade with predefined risk parameters — the AI gives you direction, but risk management determines your survival.
Step 5 — Evening Journal (3 minutes). Log every signal you acted on and its outcome. Note the Confluence Score at entry. Over time, you will discover your personal sweet spot — the confidence threshold where your win rate is highest.
When CoinXSight's AI Adds the Most Value
Scenario
How CoinXSight Helps
You see a breakout forming but are not sure if it is real
Volume and on-chain layers confirm (or deny) that smart money is behind the move
You missed a move and want to know if it is too late to enter
ASI Score shows whether momentum and accumulation signals are still intact or fading
You hold a position and are unsure when to take profit
Declining Confluence Score warns when bullish drivers are weakening, even before price shows it
You are scanning for new opportunities across 200+ tokens
Alpha Hunter does the scanning for you, surfacing only the highest-probability setups
The market is chaotic and you do not know what to trust
The Confluence system cuts through noise by weighing ALL available data, not just the noisiest signal
Open CoinXSight Chart Pro to see how multi-dimensional AI scoring looks on real-time charts, and start integrating these signals into your daily workflow.
Custom AI indicators represent a fundamental upgrade in how traders analyze crypto markets — moving from single-dimension signals that everyone sees to multi-layered probability assessments that combine price, volume, on-chain, and cross-asset data into actionable intelligence. You do not need to build these systems yourself. Understanding HOW they work makes you a better consumer of their signals, and using them consistently through platforms like CoinXSight gives you an informational edge that traditional indicators simply cannot match. Start exploring AI-powered signals on your watchlist today.
Principal AI & Quantitative Researcher·Deep Alpha Engine Labs
Ph.D. in Computational Statistics. Leads machine learning architecture, regime-switching detection, and automated execution systems at CoinXSight Labs.
QUANTITATIVE SUITE // DEEP ALPHA ENGINEACTIVE
BTC/USDT // LIVE SCANNER
CONFLUENCE 74
LIVE SPOT PRICE$82,807.47WEAK_BUY
TP2
$89,522.75
+9.07%
TP1
$85,056.42
+3.63%
ENTRY
$82,078.86
ZONE
SL
$80,590.09
-1.81%
Auto-detect Order Blocks, Fair Value Gaps and risk-adjusted DCA ladders in < 5s.