Decentralized finance is no longer a wild frontier of anonymous yield farms printing worthless governance tokens at 10,000% APY. By mid-2026, DeFi has matured into a $280B+ TVL ecosystem where real yield dominates, concentrated liquidity demands active management, and cross-chain arbitrage operates in millisecond windows. The complexity has outgrown what any human trader can monitor manually.
This is where artificial intelligence becomes not just useful but necessary.
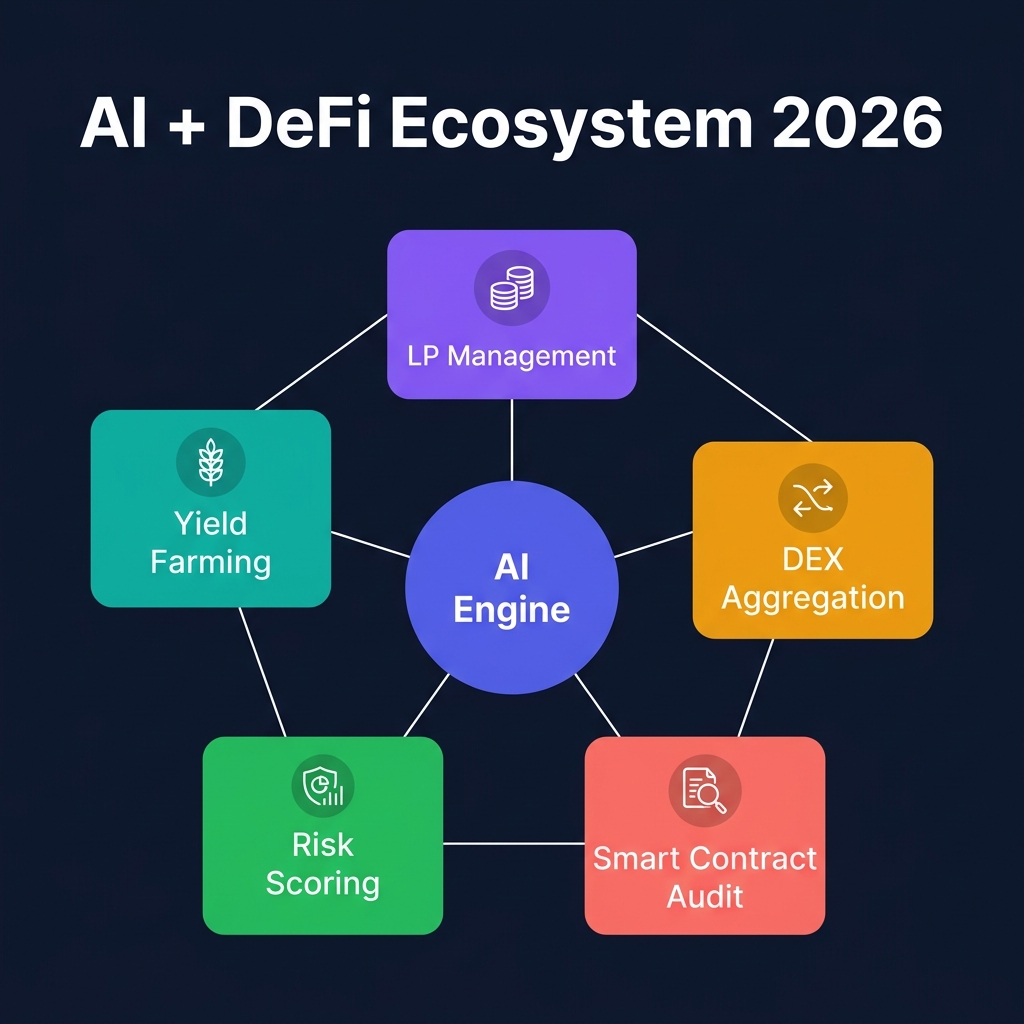
AI models now parse thousands of liquidity pools across Ethereum, Solana, Arbitrum, and Base simultaneously. They evaluate real yield versus token emission dilution, predict impermanent loss trajectories before they materialize, and detect cross-DEX price discrepancies that exist for under 12 seconds. The traders who integrate AI into their DeFi operations are capturing alpha that manual farmers simply cannot access.
This guide is the advanced playbook. If you need the DeFi fundamentals first, start with the DeFi Yield Farming 2026 guide and the Impermanent Loss explainer. Here, we assume you understand AMMs, concentrated liquidity, and basic yield mechanics. We are going deeper.
The 2026 DeFi Landscape by the Numbers
Metric
Value (May 2026)
YoY Change
Total DeFi TVL
$283B
+62%
Real yield protocols (% of TVL)
71%
+24pp
Concentrated liquidity adoption
68% of DEX volume
+31pp
AI-managed DeFi positions
~$18B estimated
+340%
Average LP holding period
14.2 days
-8 days
Cross-DEX arbitrage daily volume
$4.2B
+180%
BTC price (reference)
~$108,500
+94%
ETH price (reference)
~$2,720
+38%
SOL price (reference)
~$178
+112%
The most striking trend: the average LP holding period has shortened from 22 days to 14 days. Active management has replaced passive "deposit and forget" as the dominant strategy. AI makes this active management scalable.
AI for Yield Farming: Beyond Displayed APY
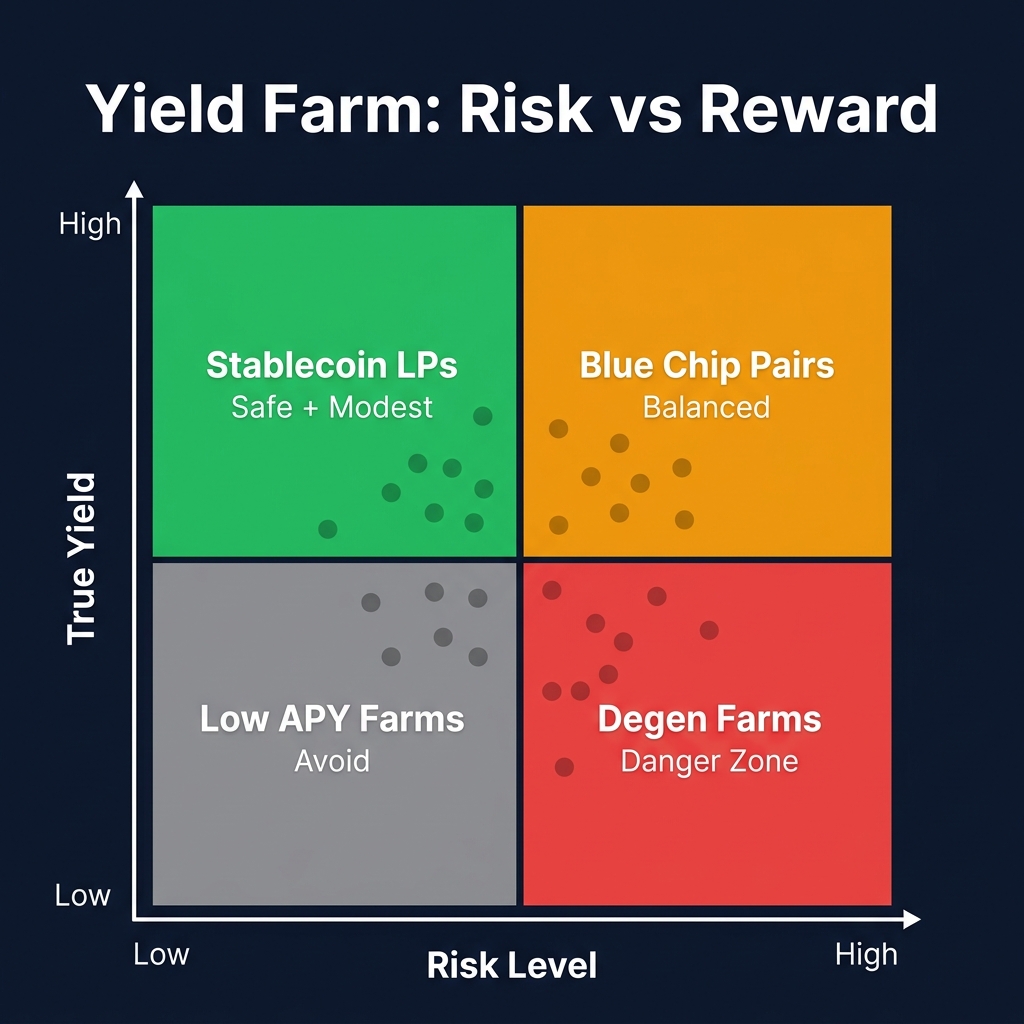
The displayed APY on a yield farming dashboard is a lie. Not intentionally, but structurally. It shows gross yield from fees and token emissions without subtracting impermanent loss, gas costs, token emission depreciation, or smart contract risk premium. AI systems can compute the true risk-adjusted yield — and the difference from the displayed number is often shocking.
APY vs. Real Yield Analysis
An AI yield analyzer evaluates every farming opportunity through five lenses simultaneously:
AI Real Yield Calculation Framework:

1. GROSS YIELD DECOMPOSITION
   - Trading fee APY: Actual fee revenue / TVL (sustainable)
   - Emission APY: Token rewards x current price (decaying)
   - Bonus incentives: Points, airdrops, boosts (speculative)

2. COST DEDUCTIONS
   - Impermanent loss (predicted, not historical)
   - Gas costs for entry/exit/claim/rebalance
   - Emission token depreciation rate (30-day trailing)
   - Opportunity cost vs. risk-free DeFi rate (sDAI: ~7.2%)

3. RISK ADJUSTMENT
   - Smart contract risk score (0-100)
   - Protocol age penalty (newer = higher discount)
   - TVL concentration risk (single-whale dependency)
   - Chain risk factor (L1 vs L2 vs sidechain)

4. TRUE RISK-ADJUSTED YIELD
   = (Gross Yield - Costs) x Risk Multiplier

   Where Risk Multiplier = 1 - (Risk Score / 200)
   Example: 25% gross, 8% costs, risk score 40
   = (25% - 8%) x (1 - 40/200) = 17% x 0.80 = 13.6% true yield

5. COMPARISON BENCHMARK
   Is 13.6% risk-adjusted yield worth it vs:
   - Stablecoin lending at 7.2%? (6.4% premium for the risk)
   - ETH staking at 3.8%? (9.8% premium)
   - Just holding the underlying tokens? (depends on outlook)
Real-world example — May 2026:
An ETH/USDC pool on Uniswap V3 (Arbitrum) displays 28% APY. The AI breaks it down:
That 28% headline became 18.9% after honest accounting. Still attractive — but a different pool showing 22% gross with lower risk might actually deliver better risk-adjusted returns.
Risk Scoring for Yield Farms
AI risk scoring evaluates yield farms across multiple dimensions that would take a human analyst hours per protocol:
Risk Dimension
What AI Evaluates
Weight
Smart contract security
Audit count, auditor reputation, time in production, bug bounty size, code complexity score
30%
TVL stability
TVL trend (growing/stable/declining), concentration (% from top 10 wallets), historical volatility
20%
Team & governance
Multisig configuration, timelock duration, admin key centralization, DAO activity
PROTOCOL: Aave V3 (Arbitrum)
POOL: ETH/USDC lending
RISK SCORE: 92/100 (LOW RISK)

 Smart Contract:  95/100 — 7 audits, 3+ years production, $10M bug bounty
 TVL Stability:   88/100 — $4.2B TVL, stable 90-day trend, low concentration
 Team/Governance:  90/100 — Multisig 6/10, 48h timelock, active DAO
 Economic:         94/100 — 96% fee-funded yield, minimal emissions
 Liquidity:        91/100 — Instant withdrawal, deep markets

VERDICT: Tier-1 protocol. Suitable for core allocation (up to 30% of DeFi portfolio).

---

PROTOCOL: [New Fork Protocol] (Base)
POOL: ETH/USDC concentrated LP
RISK SCORE: 38/100 (HIGH RISK)

 Smart Contract:  25/100 — 1 audit (unknown auditor), 6 weeks production
 TVL Stability:   42/100 — $8M TVL, declining, 72% from 3 wallets
 Team/Governance:  30/100 — 2/3 multisig, no timelock, anonymous team
 Economic:         55/100 — 40% emission-funded, token down 45% from launch
 Liquidity:        40/100 — 8.3% slippage on $100K exit

VERDICT: High-risk. Maximum allocation: 3-5% of DeFi portfolio.
         Set hard stop: exit if TVL drops below $5M or contract upgrade detected.
Auto-Rotation: AI Capital Allocation Across Farms
The most sophisticated AI DeFi strategy is auto-rotation — continuously moving capital to the highest risk-adjusted yield opportunity. This is not simple APY chasing. It is a multi-factor optimization problem.
How AI auto-rotation works:
EVERY 4 HOURS, the AI:

1. SCANS all qualifying pools (risk score > 60, TVL > $10M)
   -> Current universe: ~340 pools across 6 chains

2. CALCULATES true risk-adjusted yield for each
   -> Incorporates live volatility, gas prices, emission schedules

3. COMPARES against current positions
   -> Is moving capital worth the migration cost?

4. EXECUTES rotation only when:
   a) New pool yield exceeds current by >3% (after migration costs)
   b) Current pool risk score has not degraded below threshold
   c) Gas costs for migration are <0.5% of position value
   d) Destination pool has sufficient liquidity depth

5. REBALANCES portfolio weights
   -> No single protocol >25% allocation
   -> No single chain >40% allocation
   -> Minimum 20% in Tier-1 protocols (Aave, Uniswap, Maker)
Migration cost awareness is critical. A naive rotation system that moves capital every time a higher APY appears will hemorrhage value to gas fees and slippage. AI models learn the optimal rotation frequency — typically every 3-7 days for most positions, rarely more than twice per week.
AI for Liquidity Pool Management
Understanding AI for Liquidity Pool Management is a key part of crypto technical analysis. Most professional trading indicators on any crypto trading platform will help you apply these concepts in real time.
Active liquidity management is where AI provides the clearest edge over manual traders. Concentrated liquidity on Uniswap V3, Raydium CLMM, and similar protocols demands constant attention to range selection, rebalancing triggers, and entry/exit timing. AI handles all three.
Impermanent Loss Prediction Models
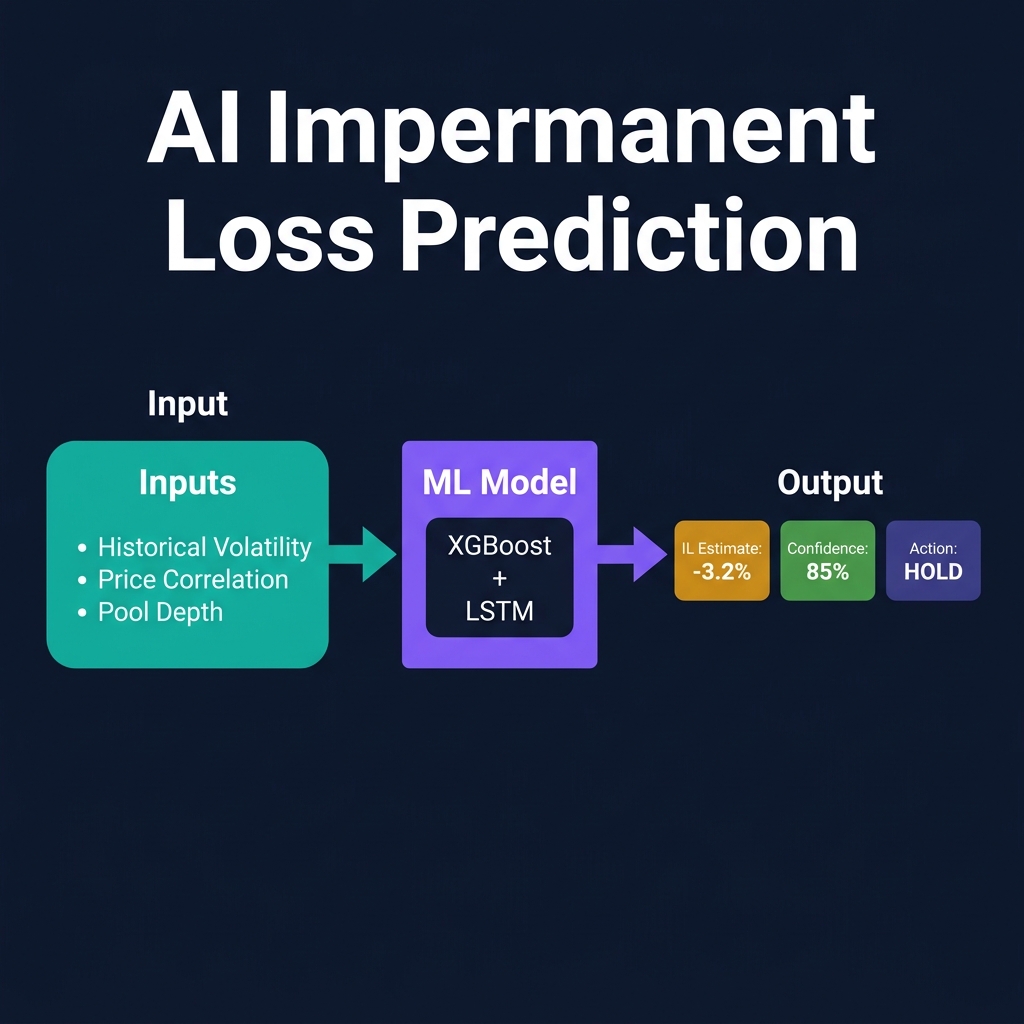
Traditional IL calculation is backward-looking — it tells you what you lost after the fact. AI IL prediction is forward-looking — it estimates your expected IL over the next 1, 7, and 30 days based on current market conditions.
Model architecture for IL prediction:
INPUT FEATURES:
+-- Historical volatility (7d, 30d, 90d) for both pool tokens
+-- Implied volatility from options markets (Deribit, Aevo)
+-- Correlation coefficient between pool tokens (rolling 30d)
+-- Current price position within Bollinger Bands (2-sigma, 20-period)
+-- Funding rates on perpetual markets (directional pressure)
+-- On-chain: whale wallet movements for both tokens
+-- Macro: DXY trend, BTC dominance shift, risk-on/risk-off regime
+-- Pool-specific: current price vs range boundaries, fee tier

MODEL: Gradient-boosted ensemble (XGBoost) + LSTM for sequence
OUTPUT: Predicted IL at 1d, 7d, 30d horizons with 80% confidence interval

EXAMPLE OUTPUT for ETH/USDC Uniswap V3 position:

 Horizon   Predicted IL   80% Confidence Range
 1 day     0.18%          [0.04% - 0.52%]
 7 days    1.24%          [0.31% - 3.15%]
 30 days   4.70%          [1.20% - 9.80%]

INTERPRETATION:
- 1d IL is negligible — safe to maintain position
- 7d IL is moderate — monitor if upper bound exceeds fee income
- 30d upper bound (9.8%) exceeds expected fee income (6.2%)
  -> RECOMMENDATION: Consider narrowing time horizon or hedging
The confidence interval is the critical output. A narrow interval means the model is confident in low IL (ideal for LP entry). A wide interval signals high uncertainty — either reduce position size or avoid the pool entirely.
Concentrated Liquidity Optimization
Uniswap V3 introduced concentrated liquidity: instead of spreading capital across the full price range (0 to infinity), LPs choose a specific range. This increases capital efficiency dramatically but creates a new problem — range selection.
AI range selection algorithm:
STEP 1: Estimate price distribution for the target holding period
  - Pull 90-day return distribution for the pair
  - Adjust for current volatility regime (high vol = wider distribution)
  - Factor in directional bias from AI trend models

STEP 2: Optimize range for maximum fee capture after IL
  - Narrow range = higher fee share but higher IL risk and out-of-range probability
  - Wide range = lower fee share but safer

  OPTIMIZATION TARGET:
  Maximize: Expected(Fee Income) - Expected(IL) - Expected(Rebalance Costs)
  Subject to: P(out of range) < threshold (typically 20-30%)

STEP 3: Dynamic adjustment
  - If realized volatility > predicted: widen range by 15%
  - If price drifts to range edge (within 10%): trigger rebalance alert
  - If volume drops >40% from average: reassess pool selection entirely
Practical example — SOL/USDC on Raydium CLMM, May 2026:
SOL is trading at $178. The AI analyzes:
30-day realized volatility: 52% annualized
AI trend model: neutral-to-slightly-bullish (60% up probability)
Average daily volume in this pool: $42M
Pool TVL: $18M
AI-recommended range: $154 – $208
Range Analysis:
  Width: +/-15% from current price
  Capital efficiency vs full range: 6.7x
  Expected fee APY (concentrated): 34.2%
  Expected IL (30-day, within range): -2.8%
  P(out of range within 30 days): 22%
  Expected rebalance cost: -0.15% (Solana gas is cheap)

  Net expected yield: 34.2% - 2.8% - 0.15% = ~31.3% APY

  vs. Full range yield: 5.1% APY

  Concentration premium: +26.2% APY for active management
The 26% yield premium demonstrates why AI-managed concentrated liquidity dominates passive full-range positions. But it requires monitoring — and that is exactly what AI excels at.
When to Enter and Exit LP Positions
Not every moment is equally profitable for liquidity provision. AI volatility forecasting identifies the optimal windows:
Best times to enter LP positions:
After a volatility spike subsides (ATR declining from elevated levels)
When the AI trend model shifts from neutral to strongly directional
Market Regime
LP Strategy
Range Width
Expected Outcome
Consolidation/Ranging
Enter LP, tight range
+/-8-12%
High fees, low IL
Low volatility trending
Asymmetric range (bias toward trend direction)
+/-12-18%
Moderate fees, moderate IL
High volatility trending
Exit LP, hold directional
N/A
Avoid amplified IL
Post-crash recovery
Enter LP with wide range
+/-20-30%
Capture high volume, accept some IL
Pre-event uncertainty
Reduce LP exposure
N/A
Avoid sudden IL spikes
DEX vs. CEX Arbitrage with AI
Price discrepancies between decentralized exchanges (Uniswap, Raydium, Curve) and centralized exchanges (Binance, Coinbase) are frequent, short-lived, and profitable — if you can detect and execute them faster than the competition. AI systems scan for these opportunities continuously.
Cross-DEX Price Discrepancy Detection
Types of DeFi arbitrage opportunities:
TYPE 1: CROSS-DEX ARBITRAGE
  Same token, different DEXs, price divergence
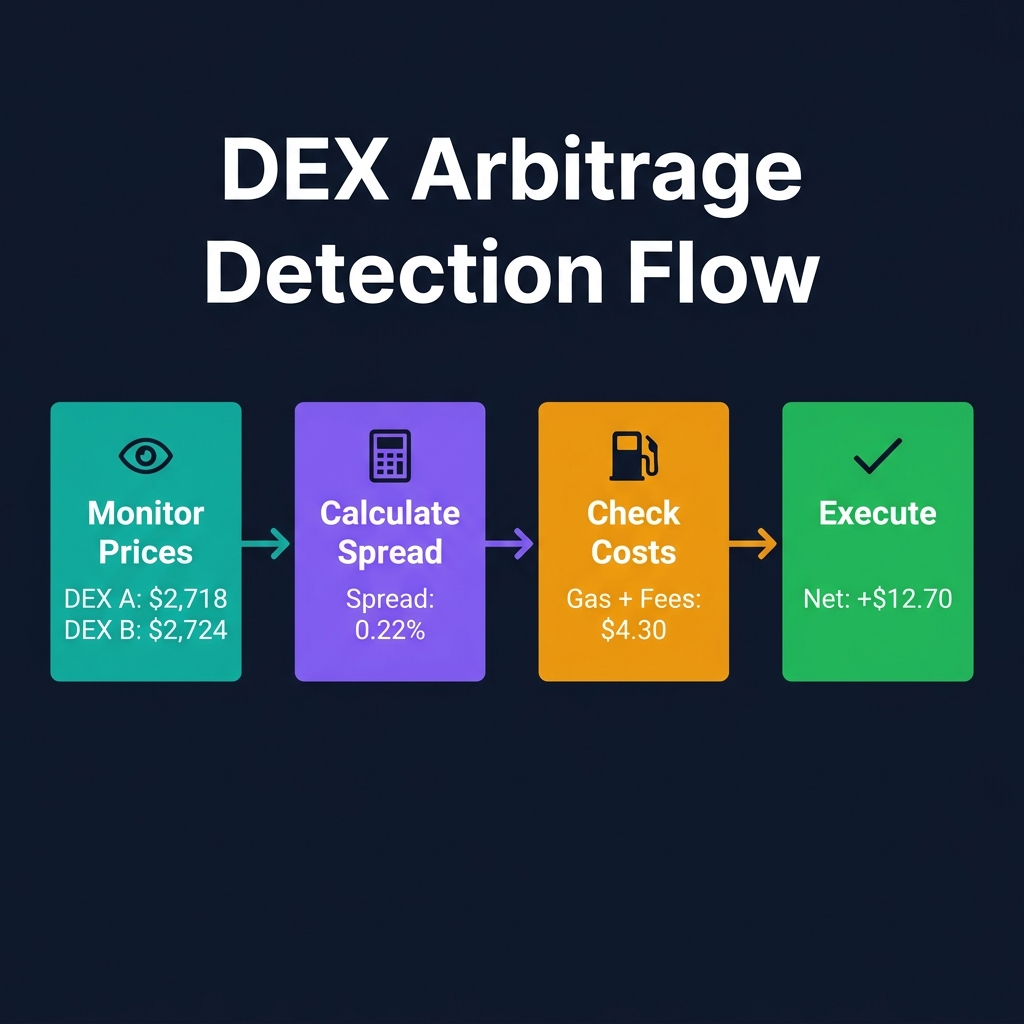
  Example: WETH at $2,718 on Uniswap, $2,724 on SushiSwap
  Profit: $6/ETH minus gas (~$2-5 on L1, ~$0.02-0.10 on L2)
  Duration: 3-15 seconds before bots close it

TYPE 2: DEX-CEX ARBITRAGE
  Same token, DEX vs CEX price divergence
  Example: SOL at $177.80 on Raydium, $178.20 on Binance
  Profit: $0.40/SOL minus withdrawal fees + gas
  Duration: 10-60 seconds (slower due to settlement time)

TYPE 3: TRIANGULAR ARBITRAGE
  Three tokens, circular trade path
  Example: ETH -> USDC -> SOL -> ETH
  If the loop returns >1.000x ETH (after all fees), it is profitable
  Typical edge: 0.05-0.3% per loop

TYPE 4: CROSS-CHAIN ARBITRAGE
  Same token on different chains
  Example: USDC at $0.9997 on Ethereum, $1.0003 on Arbitrum
  Requires bridge — introduces delay risk and bridge fees
  Duration: Minutes to hours (bridge dependent)
AI detection pipeline:
DATA INGESTION (real-time):
+-- DEX price feeds via on-chain indexers (every block)
+-- CEX price feeds via WebSocket (sub-second)
+-- Gas price oracles (for cost estimation)
+-- Mempool monitoring (for front-running detection)
+-- Bridge status feeds (for cross-chain opportunities)

OPPORTUNITY SCORING:
  Expected profit = Price difference x Trade size
  Expected cost = Gas + Slippage + Bridge fees + CEX withdrawal
  Slippage estimate = f(trade_size, pool_liquidity, current_depth)

  Net edge = Expected profit - Expected cost

  EXECUTE only if:
  - Net edge > $5 (minimum threshold)
  - Net edge / Capital deployed > 0.1% (minimum return)
  - MEV risk assessment = LOW (see next section)
  - Execution confidence > 80%
MEV-Aware Execution Strategies
In DeFi, your arbitrage transaction lives in a public mempool before it is confirmed. Maximal Extractable Value (MEV) bots scan this mempool and can front-run your trade — executing before you, capturing the profit, and leaving you with nothing (or worse, a loss from failed gas).
AI MEV-protection strategies:
Strategy
How It Works
Trade-off
Private transaction pools
Submit via Flashbots Protect, MEV Blocker, or Jito (Solana) — transactions bypass public mempool
Slightly slower confirmation, limited to supported chains
Batch bundling
Bundle multiple arbitrage operations into a single atomic transaction
Higher gas cost per bundle, but all-or-nothing execution
Timing optimization
Execute during low-MEV periods (block edges, off-peak hours)
May miss time-sensitive opportunities
Slippage limits
Set aggressive max slippage (0.1-0.3%) to make front-running unprofitable
Some transactions will fail when liquidity is thin
Backrunning instead of front-running
Look for large confirmed transactions and arbitrage the resulting price impact
Lower profit per trade, but zero MEV risk
Gas Optimization for Arbitrage Profitability
Gas costs determine whether a detected arbitrage opportunity is actually profitable. AI gas optimization models predict gas prices 1-3 blocks ahead and only execute when the expected gas cost preserves sufficient margin.
GAS COST ANALYSIS for Ethereum L1 Arbitrage:
  Base fee prediction: AI model using EIP-1559 dynamics
  Priority fee optimization: minimum needed for inclusion

  Example calculation:
  - Uniswap V3 swap gas: ~130,000 gas units
  - Current base fee: 12 gwei
  - Priority fee: 1 gwei
  - Total gas cost: 130,000 x 13 gwei = 1,690,000 gwei ~ $4.60

  -> Minimum arbitrage profit needed: $4.60 + buffer = ~$7-10
  -> At $2,720/ETH, need ~0.0026 ETH price discrepancy minimum

LAYER 2 ADVANTAGE:
  - Same swap on Arbitrum: ~$0.08-0.15
  - Same swap on Base: ~$0.03-0.08
  - Same swap on Solana: ~$0.005-0.02

  -> L2/Solana arbitrage is profitable at MUCH smaller discrepancies
  -> This is why most AI arbitrage has migrated off L1
Smart Contract Risk Assessment with LLMs
One of the most powerful — and underutilized — AI applications in DeFi is using large language models to evaluate smart contract safety before deploying capital.
Using LLMs to Audit DeFi Protocols
LLMs like GPT-4 and Claude can read Solidity and Rust code. While they are not a substitute for professional audits, they serve as an effective first-pass filter that catches obvious red flags in minutes rather than weeks.
Effective LLM audit prompt template:
SYSTEM: You are a smart contract security auditor specializing in DeFi
protocols. Analyze the following contract for security vulnerabilities,
centralization risks, and economic attack vectors. Be specific and
reference exact function names.

USER: Analyze this contract for:
1. Reentrancy vulnerabilities
2. Oracle manipulation risks
3. Admin/owner privileges that could rug users
4. Unchecked external calls
5. Integer overflow/underflow (pre-0.8.0 Solidity)
6. Centralized upgrade mechanisms without timelock
7. Flash loan attack surfaces
8. Token approval risks (infinite approvals)

For each finding, rate severity: CRITICAL / HIGH / MEDIUM / LOW / INFO.
Estimate confidence in your finding (0-100%).

[PASTE CONTRACT CODE]
What LLMs are good at detecting:
Category
Detection Quality
Confidence
Centralized admin keys / rug vectors
Excellent
85-95%
Missing access controls
Good
75-90%
Obvious reentrancy patterns
Good
70-85%
Logic errors in reward calculations
Moderate
50-70%
Complex cross-contract interactions
Poor
30-50%
Novel attack vectors
Poor
20-40%
What LLMs miss: Subtle economic exploits, complex multi-transaction attack sequences, and vulnerabilities that emerge from the interaction between multiple contracts. Always pair LLM analysis with professional audit status checks.
Red Flag Detection Checklist
AI systems can automatically screen DeFi protocols against a red-flag matrix before any capital deployment:
AUTOMATED RED FLAG SCANNER:

 CRITICAL RED FLAGS (auto-reject, do not deploy):
 x Owner can mint unlimited tokens
 x Owner can pause withdrawals without timelock
 x Proxy contract upgradeable with single EOA (no multisig)
 x No audit from recognized firm
 x Contract deployed < 14 days ago with > $5M TVL (likely airdrop bait)
 x Hidden transfer fees or tax mechanisms
 x Hardcoded admin address with privileged functions

 HIGH-RISK FLAGS (proceed with extreme caution, max 2% allocation):
 ! Single audit from lesser-known firm
 ! Timelock < 24 hours on admin functions
 ! Team is anonymous with no track record
 ! Token has > 50% supply controlled by team/investors
 ! TVL declined > 30% in past 14 days without market-wide decline
 ! Code is a fork with minimal modifications (potential backdoor)

 MODERATE-RISK FLAGS (acceptable with proper position sizing):
 o 1-2 audits from recognized firms, < 12 months in production
 o Multisig with 3/5 or higher threshold
 o Some emission-dependent yield (< 40% of total yield)
 o Moderate TVL concentration (top 10 wallets < 50% of TVL)
DeFi Protocol Evaluation Framework
When deciding where to allocate capital, AI systems score protocols across the dimensions that matter. Here is a comparative framework for the top DeFi protocols as of May 2026:
Real Yield % excludes unsustainable emission rewards
AI Suitability rates how well the protocol integrates with automated management (APIs, predictable behavior, composability)
IL Risk applies only to liquidity provision products within each protocol
An AI portfolio manager uses this matrix to construct a diversified DeFi allocation:
SAMPLE AI-CONSTRUCTED DeFi PORTFOLIO ($100,000):

CORE (60% — $60,000):
  Aave V3 ETH lending (Arbitrum):     $20,000 — targeting 5.2% yield
  Lido stETH staking:                 $20,000 — targeting 3.8% yield
  MakerDAO DSR (sDAI):                $20,000 — targeting 7.2% yield

GROWTH (30% — $30,000):
  Uniswap V4 ETH/USDC CL (Arbitrum): $15,000 — targeting 22% yield
  Raydium SOL/USDC CLMM:             $10,000 — targeting 28% yield
  Pendle PT-stETH (June expiry):      $5,000  — targeting 11% yield

SPECULATIVE (10% — $10,000):
  Morpho optimized vaults:            $5,000  — targeting 9% yield
  New protocol points farming:         $5,000  — targeting airdrop alpha

PORTFOLIO CONSTRAINTS:
  Max single protocol: 20%
  Max single chain: 45%
  Min Tier-1 allocation: 50%
  Rebalance frequency: weekly or on trigger
  Hard stop: exit any position where risk score drops below 60
Common Mistakes in AI-Driven DeFi Trading
Mistake 1: Trusting Displayed APY Without Verification
Every AI model is only as good as its inputs. If your system ingests displayed APY as truth without decomposing it into fee yield, emission yield, and expected costs, your "optimized" portfolio is optimizing for the wrong metric.
Fix: Always calculate true yield. If you do not have the infrastructure, CoinXSight's Discovery module provides protocol-level yield decomposition.
Mistake 2: Ignoring Correlation Between DeFi Positions
A portfolio that has ETH/USDC LP on Uniswap, stETH on Lido, and ETH lending on Aave is NOT diversified — it is triply exposed to ETH price risk. AI correlation analysis reveals hidden concentration:
CORRELATION MATRIX (sample DeFi portfolio):

              ETH/USDC LP   stETH    ETH Lending   SOL/USDC LP   sDAI
ETH/USDC LP      1.00       0.92       0.88           0.41       0.05
stETH            0.92       1.00       0.95           0.38       0.03
ETH Lending      0.88       0.95       1.00           0.35       0.02
SOL/USDC LP      0.41       0.38       0.35           1.00       0.04
sDAI             0.05       0.03       0.02           0.04       1.00

ALERT: First three positions have >0.85 correlation.
       Effective diversification: 2.3 independent bets (not 5).
       Recommendation: Reduce ETH-correlated allocation from 78% to 50%.
Mistake 3: Over-Optimizing Rebalancing Frequency
More frequent rebalancing is not always better. Each rebalance incurs gas costs, potential slippage, and a brief period of zero fee earning. AI systems should model the net benefit of rebalancing including all costs.
Rule of thumb: On Ethereum L1, rebalance only when the expected yield improvement exceeds 2% annualized (after costs). On Solana or L2s where gas is negligible, the threshold drops to 0.5%.
Mistake 4: No Circuit Breaker for Smart Contract Risk
AI systems should have hardcoded circuit breakers that trigger immediate withdrawal regardless of yield optimization:
Protocol TVL drops more than 20% in 24 hours
New critical vulnerability disclosed for protocol or its dependencies
Always apply a 20-30% haircut to backtested DeFi returns to account for these realities. Use CoinXSight's backtesting module to validate strategy logic before deploying capital.
How CoinXSight's Whale Tracking Reveals DeFi Smart Money Flows
The ultimate edge in DeFi is knowing where smart money is flowing before it is reflected in TVL charts. CoinXSight's whale flow tracking provides exactly this intelligence.
What Whale Flow Data Reveals for DeFi Traders
When a whale wallet that historically generates 40%+ annualized DeFi returns deploys $2M into a specific Pendle pool, that is a signal worth investigating. CoinXSight's whale tracking module surfaces these movements in real-time:
DeFi-specific whale signals:
Whale Action
What It Signals
AI Response
Large deposit to new protocol
Smart money validating protocol safety
Add to watchlist, research opportunity
Whale exits LP position (large)
Potential volatility incoming or risk detected
Tighten LP ranges, consider exit
Multiple whales enter same farm
High-conviction yield opportunity
Evaluate for portfolio addition
Whale moves funds from Aave to Morpho
Better risk-adjusted yield identified
Run yield comparison analysis
Whale bridges large stablecoin amount cross-chain
Arbitrage or yield opportunity on destination chain
Scan destination chain pools
Smart money accumulates governance token
Protocol catalyst expected (upgrade, partnership)
Research upcoming governance proposals
Integrating Whale Data into Your DeFi AI Stack
CoinXSight's exchange flow analysis and whale tracking data feed directly into DeFi strategy decisions:
Pre-deployment scanning: Before entering any pool, check if smart money wallets are present. High smart money concentration validates the opportunity but also means competition for fees.
Exit signal monitoring: Set alerts for whale withdrawals from your active pools. If 3+ tracked wallets exit the same pool within 48 hours, treat it as a high-priority review trigger.
Protocol discovery: Some of the best DeFi opportunities are found by following smart money to new protocols before they appear on yield aggregator leaderboards. CoinXSight's whale flow module surfaces these early movers.
Risk validation: Cross-reference your AI risk scores with whale behavior. If your model rates a protocol as high-risk but multiple historically profitable whales are deployed there, investigate what they might know that your model does not capture.
AI-driven DeFi trading is not about finding the highest APY — it is about computing the highest risk-adjusted yield after accounting for impermanent loss, gas costs, smart contract risk, and execution quality. The traders who build systematic frameworks for yield evaluation, LP range optimization, and protocol risk scoring capture consistent returns while manual farmers chase unsustainable headline numbers. Start with the fundamentals: decompose every yield source, predict IL before it materializes, and never deploy capital without an AI risk assessment.
Principal AI & Quantitative Researcher·Deep Alpha Engine Labs
Ph.D. in Computational Statistics. Leads machine learning architecture, regime-switching detection, and automated execution systems at CoinXSight Labs.
QUANTITATIVE SUITE // DEEP ALPHA ENGINEACTIVE
BTC/USDT // LIVE SCANNER
CONFLUENCE 81
LIVE SPOT PRICE$82,384.73MODERATE_SELL
TP2
$72,279.50
+-12.53%
TP1
$78,493.97
+-5.01%
ENTRY
$82,636.95
ZONE
SL
$84,708.44
2.51%
Auto-detect Order Blocks, Fair Value Gaps and risk-adjusted DCA ladders in < 5s.