Weekly Crypto Analysis: BTC, ETH & SOL Forecast — Week 22 (May 26 – Jun 1, 2026)
In-depth weekly cryptocurrency market analysis for Week 22, May 2026. Bitcoin flashes strongest bullish signal of the month with 95 confluence Rising Wedge and whale accumulation. Fear & Greed inches higher. Weekly crypto market analysis and bitcoin price prediction insights.
AT
Alex ThorneHead of Macro & Market Structure·May 26, 2026 · 12 min read · Updated Oct 6
The crypto market enters Week 22 with tentative signs of stabilization after three consecutive weeks of selling pressure. Total market capitalization stands at $2.673 trillion — a modest +1.19% improvement over 24 hours that represents the first sustained green candle in two weeks. Bitcoin dominance remains elevated at 58.22%, while the Fear & Greed Index has ticked up from 27 to 30 (Fear) — still deep in fear territory, but the trajectory is improving.
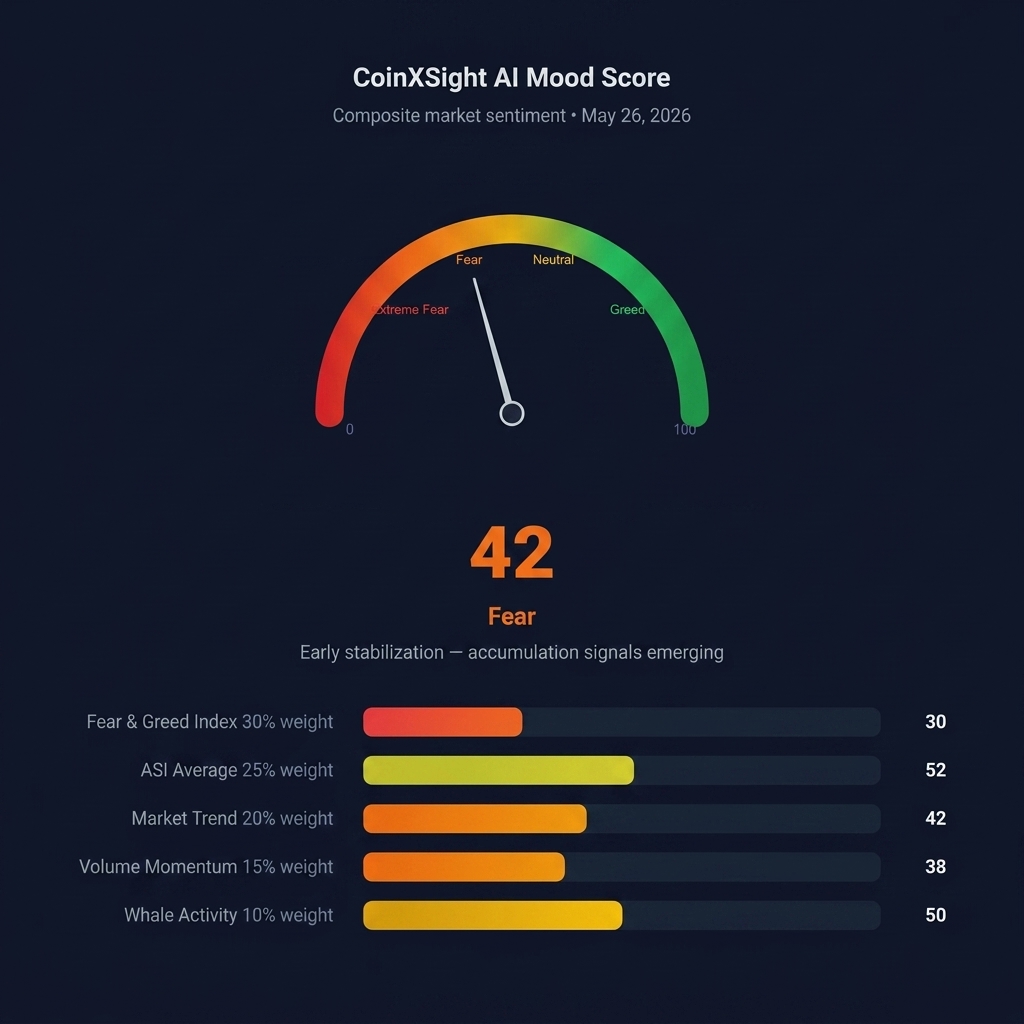
CoinXSight's proprietary AI Mood Score registers 42/100 (Fear) — up from 39 last week. The improvement is driven primarily by rising ASI scores and a notable shift in whale behavior from distribution to neutral-accumulation across major assets.
Metric
Value
Week-over-Week
Total Market Cap
$2.673T
+0.8% from $2.651T
24h Trading Volume
$66.5B
-7.3% (declining activity)
BTC Dominance
58.22%
Flat (stable risk-off)
ETH Dominance
9.64%
-0.03pp (slight decline)
Fear & Greed Index
30
+3 points (improving)
AI Mood Score
42
+3 points (improving)
Active Cryptocurrencies
17,393
-19 (minor delistings)
Macro Context: The Stabilization Narrative
Geopolitical Tension Easing
The Strait of Hormuz crisis that dominated Week 21's narrative has shown early signs of de-escalation. Diplomatic channels between Iran and Western powers have reopened through Turkish mediation, with preliminary discussions on shipping corridor guarantees. Oil prices have retreated from the $100/barrel panic level to approximately $94, providing marginal relief to inflationary pressures.
While a full resolution remains distant, the shift from active confrontation to negotiation has removed the most acute tail risk from the market. Crypto, as a high-beta risk asset, benefits disproportionately from reduced geopolitical uncertainty.
Federal Reserve: Holding Pattern
The Federal Reserve continues its rate hold at 3.50% – 3.75%. Chair Warsh's remarks on May 22 were notable for their measured tone — avoiding the hawkish signals the market had feared. The probability of a rate hike has declined from 15% to approximately 8%, while the probability of a hold through September has risen to 72%.
For crypto markets, this "boring is good" scenario removes the downside catalyst of an unexpected rate hike, even though it fails to provide the dovish fuel needed for a sustained rally.
US-China Trade Progress
The Trade Council established during Trump's mid-May state visit has begun formal sessions in Geneva. Initial reports suggest both sides are working toward a phased tariff reduction timeline, with the first tranche (consumer electronics) potentially announced before July. This represents a constructive backdrop for risk assets.
Bitcoin (BTC) — $77,562
Price Action Summary
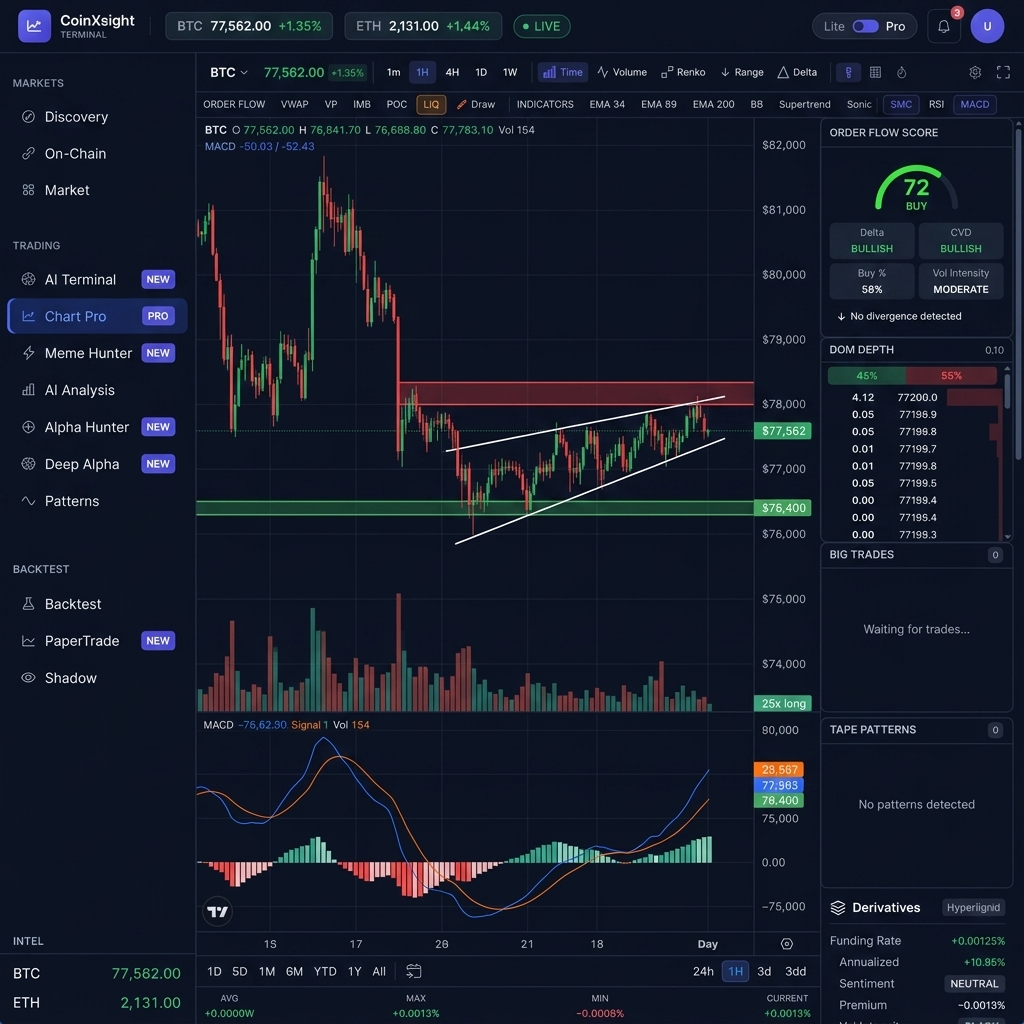
Bitcoin is trading at $77,562, posting a +1.35% gain in the past 24 hours and recovering modestly from Week 21's low near $76,000. The weekly range has compressed to $76,400 – $78,200, indicating a coiling market ahead of a directional breakout.
CoinXSight Alpha Gems Intelligence
The headline signal this week comes from CoinXSight's Alpha Gems engine, which has identified a Rising Wedge pattern on BTC with extraordinary conviction:
Dimension
Value
Reading
Pattern
Rising Wedge
92% confidence
Confluence Score
95/100
Highest possible tier
ASI Score
78/100
Strong bullish sentiment
Whale Status
ACCUMULATION
Active buying
Signal Type
LONG
Confirmed
Entry Price
$77,517
Current zone
Stop Loss
$74,896
-3.4% risk
Take Profit 1
$81,012
+4.5% reward
Take Profit 2
$82,759
+6.8% reward
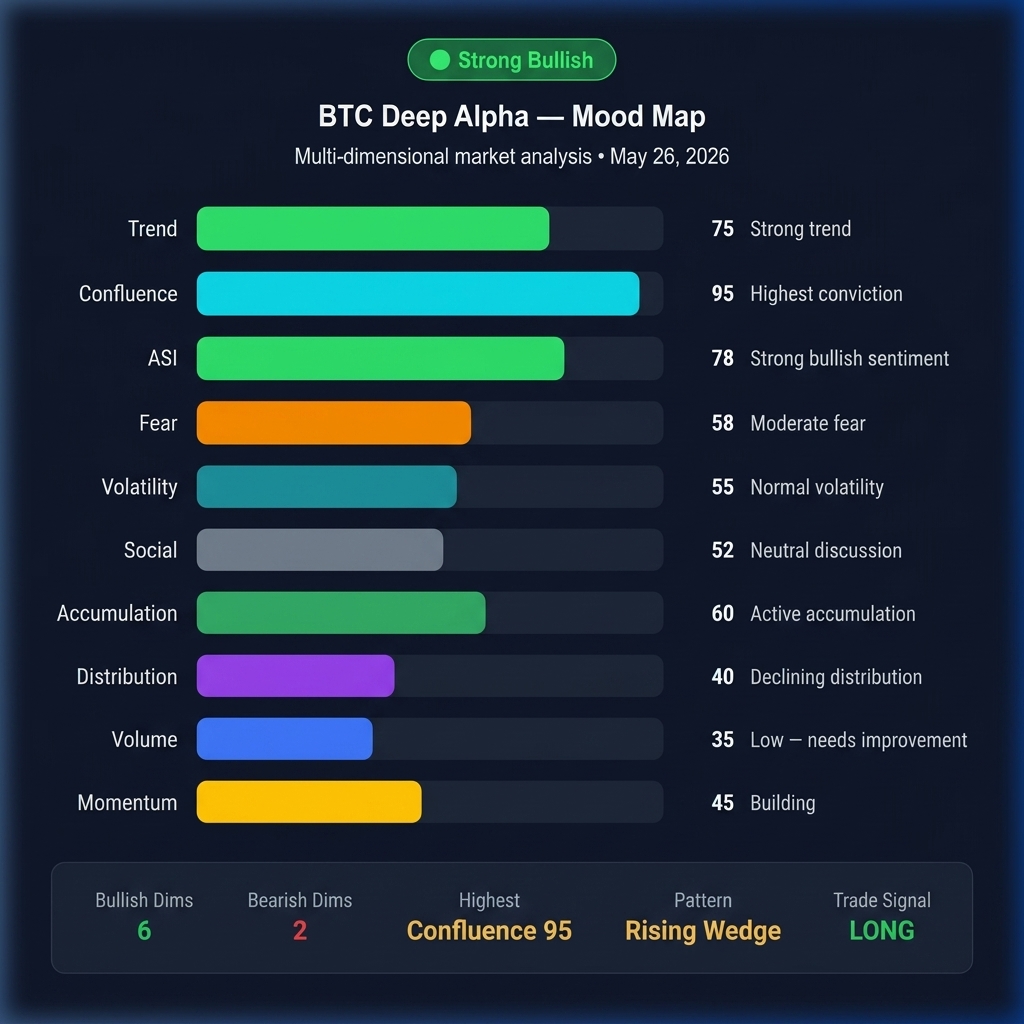
Key Insight: A 95 confluence score is the highest reading the Alpha Gems engine has produced this month. Combined with confirmed whale ACCUMULATION status and an ASI of 78, this represents a high-conviction bullish setup. The risk/reward at TP1 ($81,012) delivers a 1.3:1 ratio against the stop loss at $74,896 — acceptable for a high-confluence trade.
BTC Technical Levels
Level
Price Zone
Significance
Resistance 1
$78,000 – $78,500
Immediate overhead; weekly pivot
Resistance 2
$80,000 – $81,000
Alpha Gems TP1 target; psychological
Support 1
$76,400 – $77,000
Week 22 floor; must hold
Support 2
$74,900 – $75,000
Alpha Gems stop loss zone
BTC Verdict
BULLISH WITH CONVICTION. The 95-confluence Rising Wedge signal, combined with active whale accumulation and improving AI Mood Score, represents the strongest bullish setup BTC has shown since late April. This is a data-driven upgrade from last week's NEUTRAL-CAUTIOUS stance. The key risk: a macro shock (Hormuz escalation, surprise Fed comments) could invalidate the pattern before TP1 is reached.
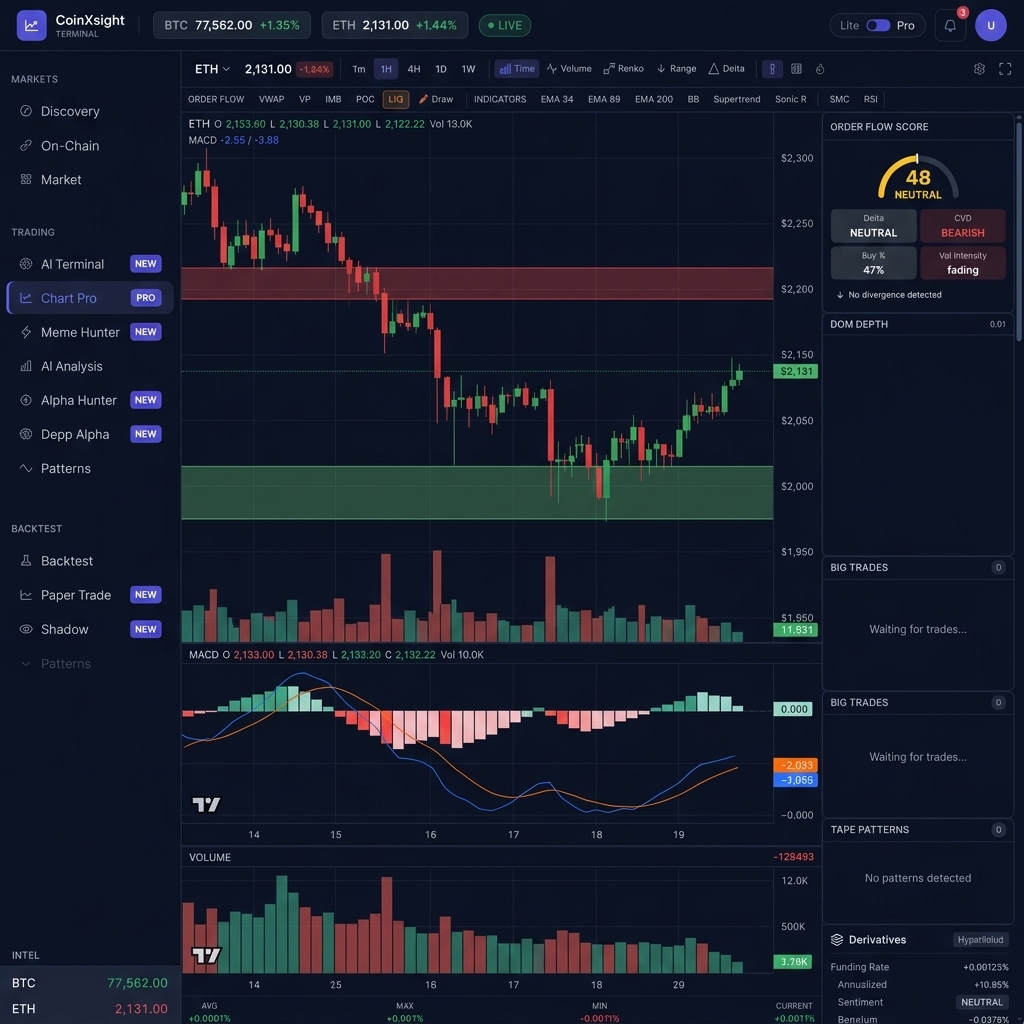
Ethereum (ETH) — $2,131
Price Action Summary
Ethereum trades at $2,131, up +1.44% on the day. While this represents a marginal improvement from Week 21's $2,126, ETH continues to underperform BTC on a relative basis. ETH dominance has slipped fractionally to 9.64%.
CoinXSight Deep Alpha Assessment
ETH's technical picture remains complex. The strong downtrend identified last week (95/100 trend score) has begun to show signs of momentum exhaustion:
Dimension
Score
Week-over-Week
Trend
85/100
-10 (weakening downtrend)
Momentum
55/100
-15 (fading bearish momentum)
Volume
30/100
+5 (slight improvement)
Fear
65/100
-5.6 (less fear)
Distribution
60/100
-11.4 (less distribution)
Volatility
60/100
-10 (normalizing)
Key Insight: The decline in trend strength from 95 to 85, combined with fading momentum (70 → 55), suggests the bearish trend is losing power. The reduction in distribution (71.4 → 60) indicates sellers are running out of conviction. However, volume at 30/100 means there isn't enough buyer participation to trigger a reversal yet.
ETH Verdict
TRANSITIONING — WATCH FOR ACCUMULATION. The bearish trend is losing steam but hasn't reversed. ETH is in the dangerous "no man's land" between trend exhaustion and reversal confirmation. Wait for volume above 50/100 and a decisive close above $2,200 before entering long positions. The downside is better defined now: $2,000 is the critical floor.
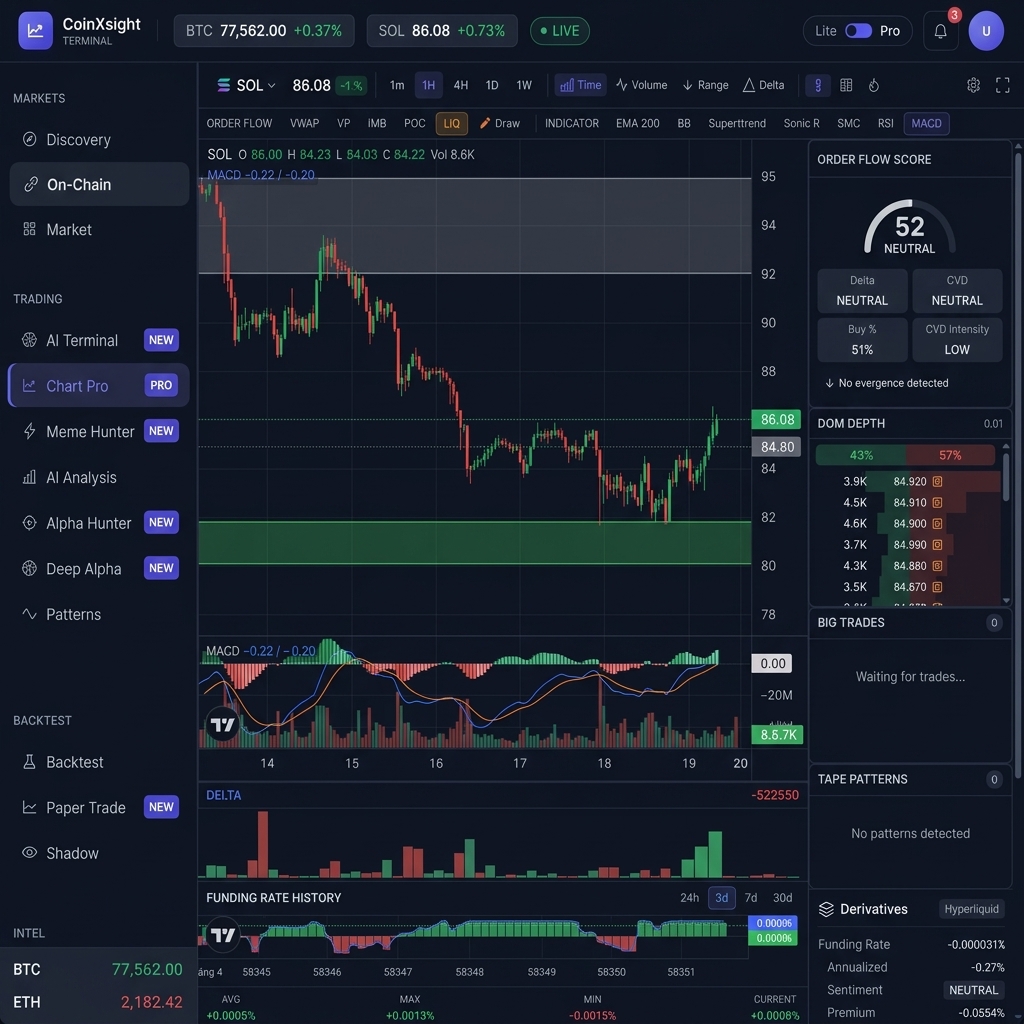
Solana (SOL) — $86.08
Price Action Summary
Solana has bounced modestly to $86.08, up +0.73% on the day and recovering from Week 21's brutal $84.80. The 7-day trajectory shows the first signs of a potential bottoming pattern, though conviction remains low.
CoinXSight Deep Alpha Assessment
SOL's extreme momentum reading from last week has moderated:
Dimension
Score
Week-over-Week
Momentum
75/100
-16 (bearish momentum fading)
Trend
55/100
-5 (weakening)
Fear
55/100
-5.5 (less fear)
Accumulation
55/100
+5 (slight buyer interest)
Distribution
45/100
-5 (less selling)
Volatility
65/100
-5 (normalizing)
Key Insight: The most significant shift is in accumulation/distribution: from last week's balanced 50/50 to this week's 55/45 in favor of accumulation. This is the first time since early May that accumulation has outpaced distribution for SOL. Combined with fading bearish momentum (91 → 75), the bottom-formation thesis is gaining evidence.
SOL Verdict
CAUTIOUSLY CONSTRUCTIVE. The shift from 50/50 to 55/45 accumulation dominance is meaningful but not yet decisive. SOL remains a high-beta play — if BTC's 95-confluence bullish signal plays out, SOL could rally 10-15% in sympathy. Target: $95-$98 on bullish scenario. Risk: sub-$80 if macro deteriorates.
Alpha Gems Pipeline — Week 22 Highlights
CoinXSight's Alpha Gems engine has generated a robust set of confirmed signals across the market. The pattern distribution reveals a market probing for bottoms:
Asset
Pattern
Direction
Confluence
ASI
Timeframe
Entry
TP1
BTC
Rising Wedge
LONG
95
78
1D
$77,517
$81,012
DOT
Wyckoff Spring + No Supply
LONG
70
46
1D
$1.276
$1.420
WLD
Rising Wedge
LONG
70
69
1H
$0.304
$0.312
PUMP
Wyckoff Spring + No Supply
LONG
65
48
1D
$0.00180
$0.00205
TAO
Wyckoff Spring + No Supply
LONG
65
64
1D
$277.70
$316.04
OP
Double Bottom
LONG
65
52
4H
$0.128
$0.134
SHIB
Wyckoff Spring + No Supply
LONG
65
46
1D
$5.56e-6
$6.01e-6
BCH
Wyckoff Spring + No Supply
LONG
60
64
1D
$350.00
$385.40
INJ
Double Bottom
LONG
60
44
4H
$5.708
$6.152
CHZ
Wyckoff Spring + No Supply
LONG
35
44
4H
$0.0370
$0.0397
Notable Observation: All 10 active Alpha Gems signals are LONG — a unanimous bullish consensus that was NOT present last week (when the pipeline was mixed). The combination of Wyckoff Springs (6 out of 10) and Double Bottoms (2) is textbook late-accumulation market structure.
Bearish Counterpoint: CoinXSight's Confluence engine has flagged PHA with a bearish Double Top pattern at 95% confidence, $0.0491 entry, with STRONG_DISTRIBUTION (-765,569 whale netflow) and ASI 33. This is the most convicted short signal in the pipeline — traders watching PHA should exercise caution.
Top 10 Market Performance
Asset
Price
24h Change
7d Trend
Market Cap
BTC
$77,562
+1.35%
Stabilizing
$1,556.4B
ETH
$2,131
+1.44%
Stabilizing
$257.7B
USDT
$0.999
-0.01%
Stable
$189.5B
BNB
$662.76
+0.96%
Recovering
$89.7B
XRP
$1.36
+0.72%
Flat
$84.2B
USDC
$1.001
0.00%
Stable
$76.4B
SOL
$86.08
+0.73%
Bottoming
$49.8B
TRX
$0.3728
+1.82%
Outperforming
$35.3B
Standout: TRX continues its Week 21 outperformance, posting another +1.82% gain. TRON's high-yield staking narrative provides a defensive floor that other Layer 1s lack in the current risk-off environment.
AI Mood Score: Under the Hood
CoinXSight's AI Mood Score has improved from 39 to 42 — a meaningful shift that reflects the early stabilization narrative:
Component
Score
Weight
Change from W21
Fear & Greed Index
30
30%
+3
ASI Average
52
25%
+3
Market Trend
42
20%
+4
Volume Momentum
38
15%
-2
Whale Activity
50
10%
+6
Composite Score
42
+3
Analysis: The largest improvement comes from Whale Activity (+6), reflecting the shift from distribution to neutral-accumulation patterns detected across BTC and several altcoins. The only declining component is Volume Momentum (-2), which confirms that the recovery lacks broad participation — a typical characteristic of early-stage bottoming.
Week 22 Outlook & Key Levels
Scenarios
Bullish Scenario (40% probability — upgraded from 30%):
BTC's 95-confluence Rising Wedge triggers a breakout above $80,000. Whale accumulation accelerates. ETH follows to $2,300. SOL tests $95.
Base Case (45% probability):
Continued consolidation within current ranges. BTC oscillates $76,000 – $79,000. ETH holds $2,050 – $2,200. Low volume persists but no new selling pressure emerges.
Bearish Scenario (15% probability — downgraded from 20%):
Hormuz crisis re-escalates, oil surges back above $100, Fed signals hawkish pivot. BTC tests $74,000, ETH approaches $1,950.
What to Watch
BTC $80,000 resistance — a close above this level would confirm the Rising Wedge breakout
Alpha Gems signal performance — track TP1 hit rates this week for pipeline validation
Volume recovery — the market needs volume above 40/100 AI Mood reading to sustain any rally
PHA Double Top resolution — a bellwether for whether bearish patterns are activating
Fed minutes release — any language on inflation trajectory could shift rate expectations
This analysis is powered by CoinXSight's AI intelligence engine, combining Alpha Gems pattern detection, Deep Alpha multi-factor analysis, and real-time market data sourced live from CoinXSight production APIs at the time of publication. This is not financial advice — always conduct your own research.
Head of Macro & Market Structure·Global Macro Desk
Former institutional FX and macro derivative analyst. Specializes in global liquidity cycles, central bank balance sheets, and crypto market microstructure.
QUANTITATIVE SUITE // DEEP ALPHA ENGINEACTIVE
BTC/USDT // LIVE SCANNER
CONFLUENCE 93
LIVE SPOT PRICE$83,908.89STRONG_BUY
TP2
$89,725.68
+6.94%
TP1
$86,233.44
+2.77%
ENTRY
$83,905.28
ZONE
SL
$82,741.19
-1.39%
Auto-detect Order Blocks, Fair Value Gaps and risk-adjusted DCA ladders in < 5s.
Comprehensive monthly cryptocurrency market review for May 2026. Total market cap trends, BTC/ETH/SOL performance breakdown, Alpha Hunter pipeline metrics, macro…