AI Backtest Engine: Validate Your Strategies Before Risking Real Capital
Master CoinXSight's Backtest Engine — run historical simulations, test AI signals, analyze PnL, and validate your trading strategy with data-driven precision.
CB
Chloe BennettMarket Intelligence & Narrative Lead·Mar 10, 2026 · 10 min read · Updated Oct 6
The best traders do not guess — they test. CoinXSight's AI Backtest Engine lets you run historical simulations on any strategy, validate AI signal performance, and optimize your approach with data-driven precision — all before putting a single dollar at risk.
Professional traders at hedge funds and proprietary firms never deploy a strategy without extensive backtesting. The CoinXSight Backtest Engine brings this institutional practice to retail crypto traders — but with a critical advantage. Instead of replaying simple price data, the engine uses the same AI pipeline that powers live signals (Alpha Hunter V2, ASI Scoring, and Confluence validation) to retroactively analyze what the AI would have recommended at each point in history.
This gives you a realistic performance picture, not an idealized one. The AI's historical decisions include the same uncertainty, latency, and market conditions that exist in live trading.
How to Run a Backtest
Step 1: Select Your Coin
Choose the cryptocurrency you want to test. The engine supports all tokens tracked by CoinXSight — from blue-chip assets like BTC and ETH to mid-cap altcoins with sufficient historical data.
Starting tip: Begin with major coins (BTC, ETH, SOL) for your first backtests. They have the most historical data and the most reliable results. Once you understand the process, expand to altcoins.
Step 2: Configure Parameters
Set up your backtest with these configurable parameters:
Parameter
Options
Recommended Starting Value
Time Range
30 days, 90 days, 6 months, 1 year
90 days (balances signal count with relevance)
Timeframe
1H, 4H, 1D
4H (best balance of signal frequency and quality)
Initial Capital
Any amount
$10,000 (easy to calculate percentage returns)
Position Sizing
Fixed amount or percentage per trade
5% per trade (conservative starting point)
Stop-Loss
Fixed percentage or ATR-based
3% below entry (adjustable after initial results)
Take-Profit
Single target or multiple (TP1/TP2/TP3)
Multiple targets matching Alpha Hunter levels
Signal Filter
Minimum ASI Score to trigger entry
ASI > 70 (highest confidence signals only)
Step 3: Run the Simulation
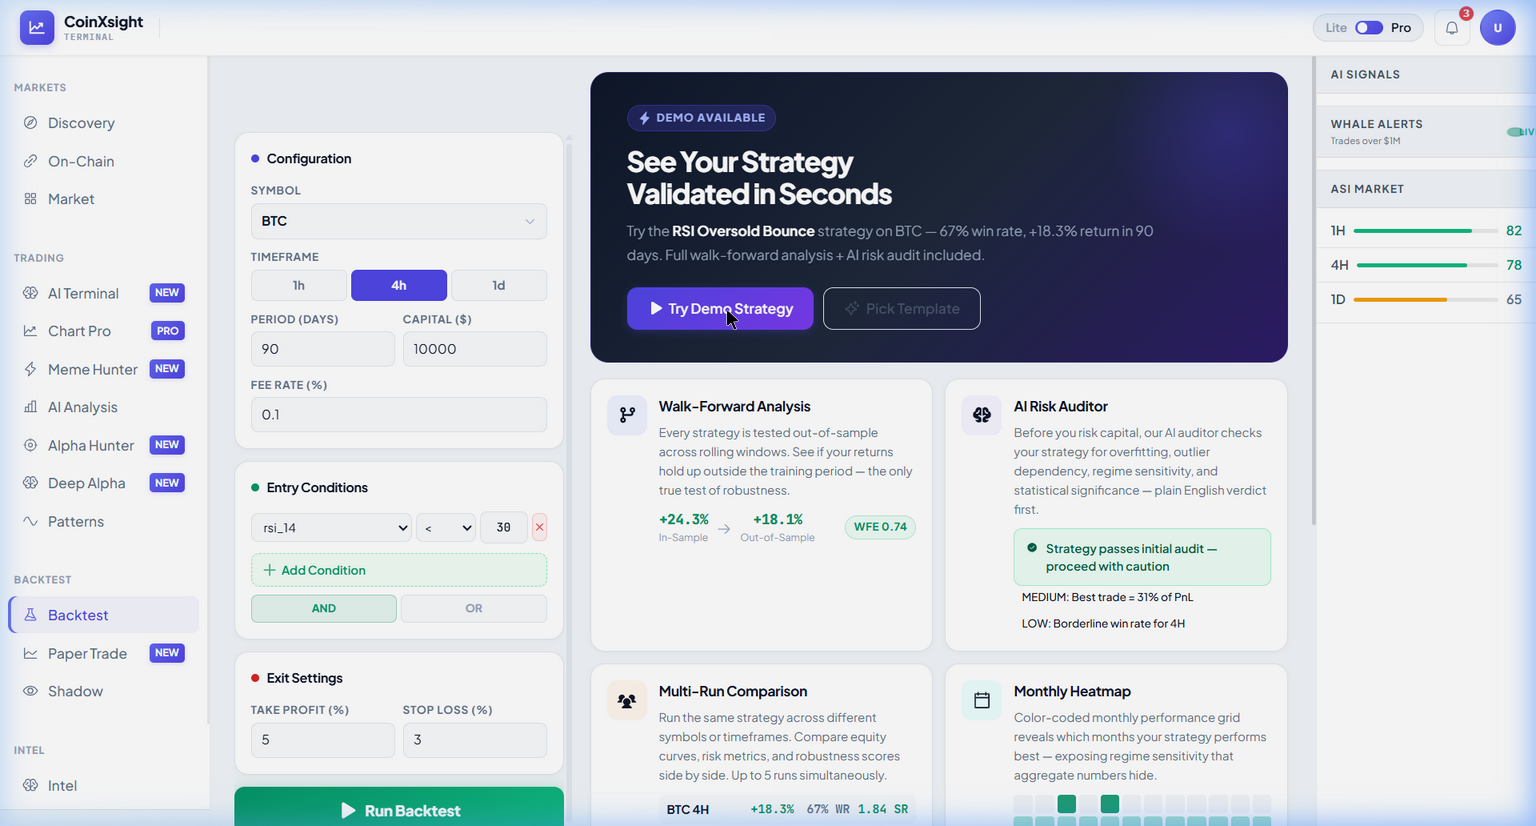
Click "Run Backtest" and the AI engine replays history. For each historical candle:
The AI recalculates the ASI Score using only data available at that point in time (no forward-looking bias)
When the score crosses your entry threshold, a virtual trade is opened at the next candle's open price
The trade is managed according to your SL/TP parameters
Realistic slippage and trading fees are deducted from each trade
The simulation typically completes in 10–30 seconds depending on the time range and number of trades.
Step 4: Analyze Results
The results dashboard provides comprehensive performance metrics:
Key Performance Indicators
Total Return (%): Net profit/loss as a percentage of initial capital
Win Rate (%): Percentage of trades that hit TP1 or higher before hitting SL
Average Win / Average Loss: The mean size of winning trades vs. losing trades
Profit Factor: Gross profits divided by gross losses — anything above 1.5 is good, above 2.0 is excellent
Sharpe Ratio: Risk-adjusted return — measures whether your returns justified the risk taken. Above 1.0 is acceptable, above 2.0 is strong.
Maximum Drawdown (%): The largest peak-to-trough decline during the test period — this is your worst-case scenario estimate
Total Trades: Number of trades executed during the test period
Visual Analysis
Equity Curve: A line chart showing your portfolio value over time. A steadily rising curve is ideal. Choppy or declining curves indicate strategy issues.
Trade Distribution: Histogram showing the distribution of trade returns — how many small wins, how many big wins, how many losses.
Drawdown Chart: Visual representation of portfolio drawdowns over time — helps you identify which market conditions caused the largest losses.
Trade Log: Detailed list of every trade with entry/exit prices, dates, PnL, and the AI reasoning at the time of entry.
Backtest Strategies Worth Testing
Strategy 1: Pure AI Signal Following
Entry: Buy when ASI Score crosses above 70
Exit: Sell when ASI Score drops below 45, or hit TP/SL
Best for: Validating the AI engine's overall accuracy on specific tokens
Strategy 2: Confluence-Filtered Signals
Entry: Buy when ASI > 70 AND RSI < 40 (oversold pullback in bullish trend)
Exit: TP at previous resistance, SL at 3% below entry
Win rate > 55% with an average win larger than average loss
Profit factor > 1.5 (ideally > 2.0)
Maximum drawdown < 20% of initial capital
Consistent equity curve without extended flat or declining periods
Sufficient sample size: At least 30+ trades for statistical relevance
Warning Signs
Be cautious if you see:
Win rate > 80%: Usually indicates overfitting — the strategy is tailored to past data and will not generalize to live trading
Only 5–10 trades in 90 days: Insufficient data to draw conclusions. Extend the time range or broaden the entry criteria.
Maximum drawdown > 40%: Even if total return is positive, a 40% drawdown means you would have lost nearly half your capital at some point. Most traders cannot psychologically sustain this.
Equity curve with a single large winner: If removing one trade turns the strategy from profitable to unprofitable, your results are driven by luck, not edge.
Advanced Backtesting Practices
Avoid Overfitting
Overfitting is the most common backtesting mistake. It happens when you optimize parameters so specifically for historical data that they fail on new data. Signs of overfitting:
You changed 10+ parameters to get the results you wanted
Results look perfect on one time period but terrible on another
Small parameter changes cause dramatic result differences
Solution: Use the walk-forward testing method — optimize on one period (e.g., January–June), then validate on a separate out-of-sample period (e.g., July–September). If results hold, your strategy is robust.
Include Transaction Costs
Always account for:
Trading fees: Typically 0.04–0.10% per trade on major exchanges
Slippage: The difference between your intended entry price and actual execution — typically 0.05–0.20% for liquid tokens, potentially 1%+ for illiquid altcoins
Spread: The bid-ask gap, which effectively adds to your cost basis
The Backtest Engine includes default fee assumptions, but you can customize them to match your actual exchange rates.
Test Across Multiple Market Conditions
Run the same strategy across:
Bull market periods (Q4 2024, Q1 2025)
Bear market periods (mid-2025 corrections)
Sideways/ranging markets (consolidation phases)
The best strategies maintain positive expectancy across all three conditions. A strategy that only works in bull markets is not a strategy — it is just leverage on market direction.
Walk-Forward Testing
The gold standard for strategy validation:
In-sample period: Optimize your parameters on the first 60% of your data
Out-of-sample period: Test the optimized strategy on the remaining 40% without any changes
If results hold: Your strategy has predictive power beyond the training data
If results fail: Your parameters are overfit — go back and simplify
Common Mistakes to Avoid
Backtesting without transaction costs. A strategy that returns 50% in backtest but makes 200 trades with 0.1% fees per trade loses 40% to fees alone. Always include realistic cost assumptions.
Curve-fitting parameters to past data. If you adjusted your ASI threshold from 70 to 73 because it produced better results on a specific time period, you are fitting to noise. Keep parameters rounded and intuitive.
Testing on too short a time period. A 7-day backtest with 3 trades tells you nothing statistically meaningful. Minimum useful backtest: 30 trades over 90+ days.
Ignoring maximum drawdown. A strategy with 100% return but 60% maximum drawdown means your account dropped from $10,000 to $4,000 before recovering. Most traders would panic-sell during that drawdown, locking in the loss.
Frequently Asked Questions
How far back can I backtest?
Historical data is available for up to 2 years for major tokens and up to 1 year for smaller altcoins. The data includes full OHLCV candles plus the AI's reconstructed historical ASI scores.
Does the backtest account for slippage?
Yes. The engine applies configurable slippage estimates based on token liquidity at the time of each simulated trade. Default values are conservative (0.1% for large-caps, 0.3% for mid-caps).
Can I export backtest results?
Premium users can export complete trade logs, equity curves, and performance metrics as CSV or PDF reports for further analysis.
What happens if a token was not listed during part of the backtest period?
The simulation will only execute trades during the period when the token had active trading data. The engine will not fabricate data for periods where the token did not exist.
Can I compare multiple strategies side by side?
Yes. You can save up to 5 backtest configurations and compare their equity curves, win rates, and drawdowns on a single comparison dashboard.
Summary
The AI Backtest Engine transforms trading from guesswork into a data-driven discipline. By testing your strategies against historical data — including the AI's own historical decision-making — you can identify what works, optimize your parameters, and build confidence before committing real capital.
Key takeaways:
Start with major coins (BTC, ETH) and 90-day time ranges for reliable initial results
A good strategy shows > 55% win rate, > 1.5 profit factor, and < 20% maximum drawdown
Guard against overfitting by using walk-forward testing on out-of-sample data
Always include realistic transaction costs in your simulations
Master risk management for crypto trading. Learn position sizing formulas, stop-loss strategies, and how CoinXSight's Portfolio module tracks your risk…