Bitcoin Halving Cycles: Historical Patterns and What They Mean for 2026
A data-driven analysis of all four Bitcoin halving cycles, post-halving price action patterns, diminishing returns theory, and what on-chain metrics suggest for the current cycle. Crypto market analysis every trader should follow.
CB
Chloe BennettMarket Intelligence & Narrative Lead·May 18, 2026 · 14 min read · Updated Oct 6
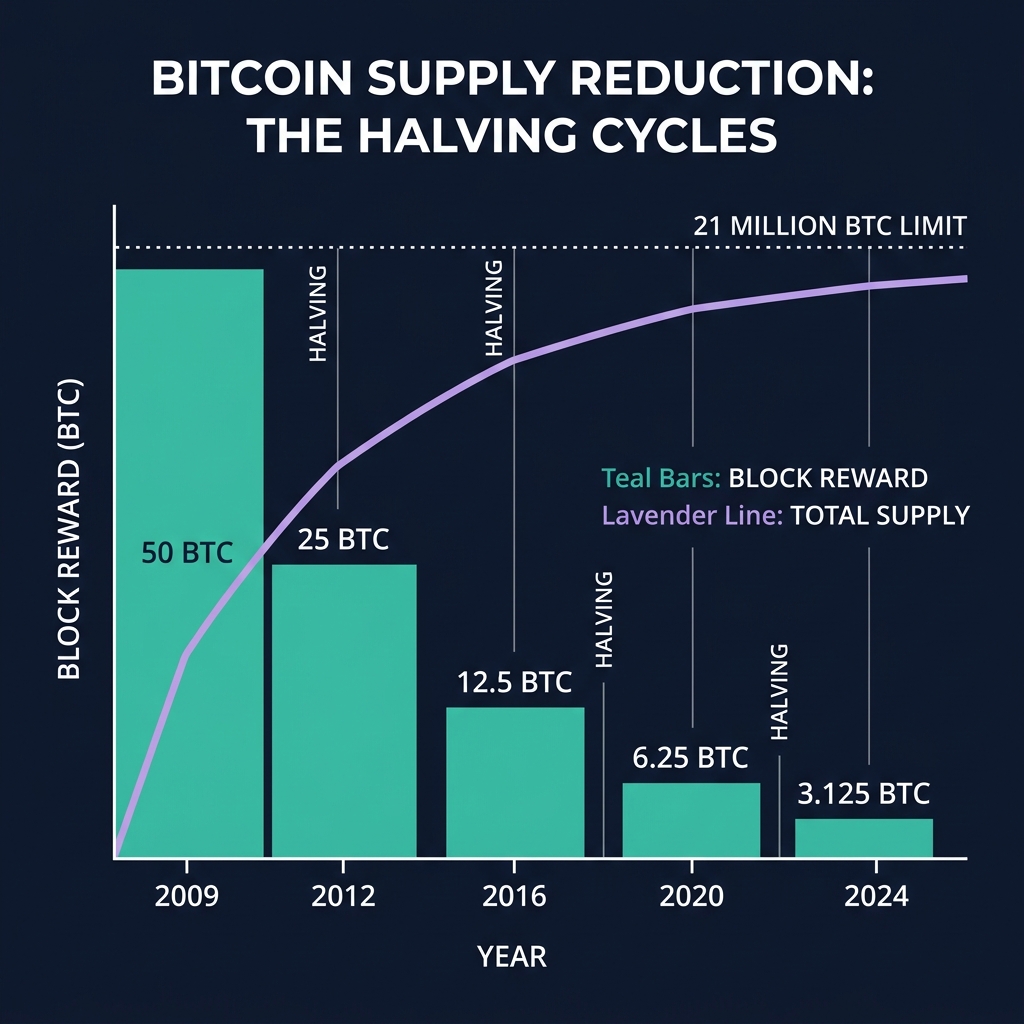
Every approximately four years, Bitcoin's block reward is cut in half — reducing the rate of new BTC creation. This supply shock has historically preceded massive bull runs, but the pattern is not a guaranteed formula. Understanding the nuances behind each cycle is critical for making informed investment decisions.
This article provides a data-driven analysis of all four completed Bitcoin halvings, examines the diminishing returns hypothesis, and uses on-chain metrics to contextualize where we stand in the current 2024–2026 cycle.
The Four Halvings: A Comparative Analysis
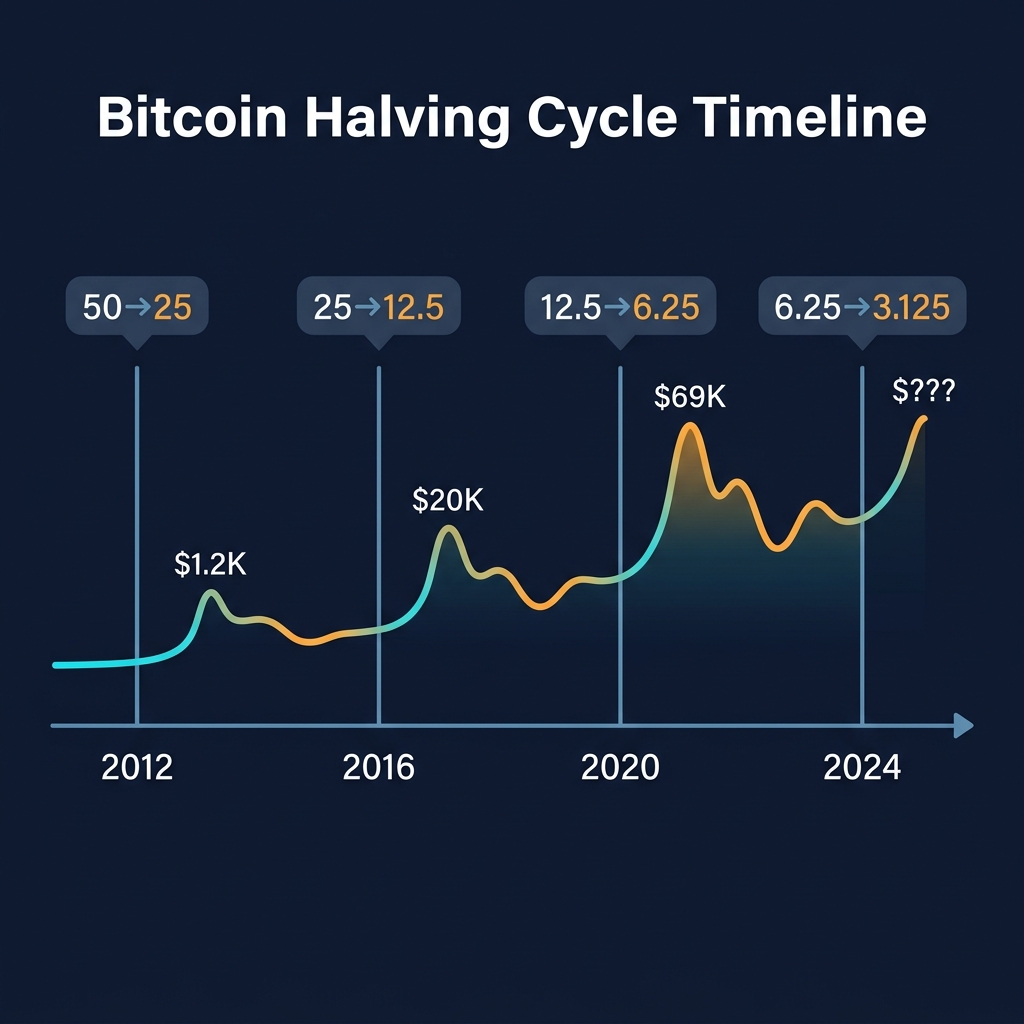
Halving #1 — November 28, 2012
Metric
Value
Block reward
50 → 25 BTC
Price at halving
~$12.35
Cycle peak
~$1,150 (Nov 2013)
Days to peak
~365 days
Peak-to-peak return
~9,200%
Subsequent drawdown
-85%
Context: Bitcoin was virtually unknown. The user base was primarily cypherpunks and early tech adopters. There were no regulated exchanges, no institutional investors, and no derivatives markets. The rally was driven almost entirely by organic retail discovery.
Key insight: This cycle established the halving narrative but occurred in a market so small that the supply reduction had an outsized effect. The market cap at the peak was only ~$14 billion.
Halving #2 — July 9, 2016
Metric
Value
Block reward
25 → 12.5 BTC
Price at halving
~$650
Cycle peak
~$19,700 (Dec 2017)
Days to peak
~525 days
Peak-to-peak return
~2,930%
Subsequent drawdown
-84%
Context: The ICO boom created a parallel demand catalyst. Ethereum launched in 2015, and the proliferation of altcoins expanded the total addressable market. Retail speculation reached mainstream awareness for the first time ("Bitcoin" was the top Google search in December 2017).
Key insight: The return was ~3x lower than the first cycle. The time to peak extended from ~365 to ~525 days. Both observations support the diminishing returns thesis but are complicated by the ICO demand catalyst.
Halving #3 — May 11, 2020
Metric
Value
Block reward
12.5 → 6.25 BTC
Price at halving
~$8,700
Cycle peak
~$69,000 (Nov 2021)
Days to peak
~546 days
Peak-to-peak return
~690%
Subsequent drawdown
-77%
Context: COVID-19 monetary policy (quantitative easing, near-zero interest rates) flooded markets with liquidity. Institutional adoption accelerated: MicroStrategy, Tesla, and eventually El Salvador adopted BTC. The DeFi and NFT booms created additional crypto demand.
Key insight: Returns continued to diminish (~690% vs ~2,930% vs ~9,200%). However, this cycle had the strongest macro tailwind in Bitcoin's history. The peak was arguably accelerated by unsustainable leverage in centralized lending platforms (Celsius, BlockFi, FTX), which collapsed in 2022.
Halving #4 — April 19, 2024
Metric
Value
Block reward
6.25 → 3.125 BTC
Price at halving
~$64,000
Projected cycle range
Analysis below
Context: Bitcoin ETFs were approved in January 2024, creating a regulated pathway for institutional capital. The macro environment shifted from quantitative tightening to a rate-cutting cycle. Stablecoin market cap exceeded $160B, indicating deep crypto liquidity.
The Diminishing Returns Hypothesis
The most common critique of halving-based analysis is that each cycle produces lower percentage returns. The data supports this trend:
Cycle
Return to peak
Decline from previous cycle
1st (2012)
~9,200%
—
2nd (2016)
~2,930%
-68%
3rd (2020)
~690%
-76%
4th (2024)
?
If pattern holds: ~150-300%
Why Returns Are Diminishing
1. Larger base effect. Moving BTC from $12 to $1,150 requires ~$14B in market cap. Moving BTC from $64,000 to $200,000 requires ~$2.7 trillion. The capital required for the same percentage move increases exponentially.
2. Reduced supply shock magnitude. The first halving cut new supply by 50% of total (from 50 to 25 BTC per block when total supply was ~10.5M). The fourth halving cuts new supply from 6.25 to 3.125 BTC per block when total supply is ~19.7M — the relative impact on total supply is far smaller.
3. Market maturation. Sophisticated traders now front-run the halving. Much of the supply shock is priced in before the event, reducing the post-halving rally magnitude.
Why Diminishing Returns May Not Apply This Cycle
1. ETF demand is a new structural buyer. Bitcoin ETFs accumulated over 500,000 BTC in their first year — absorbing ~2.5x the annual mining output. This demand source didn't exist in previous cycles.
2. Sovereign and corporate adoption. Government reserves (El Salvador, potentially others) and corporate treasuries (MicroStrategy, Marathon, etc.) create permanent demand that reduces circulating supply beyond the halving's effect.
3. Stablecoin liquidity is at all-time highs. Over $160B in stablecoins represents sidelined capital that can enter BTC markets quickly. This dry powder didn't exist at this scale in any previous cycle.
On-Chain Metrics: Current Cycle Positioning
MVRV Z-Score
The Market Value to Realized Value ratio measures whether BTC is overvalued or undervalued relative to its cost basis. Historically:
Z-Score < 0: Accumulation zone (cycle bottom)
Z-Score 3-5: Caution zone
Z-Score > 7: Euphoria zone (cycle top)
As of this analysis, the MVRV Z-Score remains below the euphoria threshold, suggesting the cycle has room to run.
Exchange Reserves
Exchange BTC reserves have been declining steadily since 2020, from ~3.2M BTC to ~2.3M BTC. This structural outflow indicates long-term holders are moving BTC to cold storage — reducing available sell-side liquidity.
The percentage of BTC supply held by long-term holders (>155 days) is near all-time highs. Historically, cycle tops occur when long-term holders begin distributing to new market participants (short-term holders). This distribution phase has not yet reached the levels seen at previous cycle peaks.
Whale Accumulation Patterns
Addresses holding 1,000+ BTC have been net accumulators throughout this cycle. Track whale movements in real time using CoinXSight's Whale Tracking module.
Cycle Timing: When Does the Peak Typically Occur?
Cycle
Halving date
Peak date
Days post-halving
1st
Nov 2012
Nov 2013
~365
2nd
Jul 2016
Dec 2017
~525
3rd
May 2020
Nov 2021
~546
4th
Apr 2024
?
~400-600 (projected)
The pattern suggests peaks occur 12-18 months after the halving. For the April 2024 halving, this projects a potential peak window between April 2025 and October 2025 — though the ETF-driven demand structure could extend the cycle.
The Lengthening Cycle Theory
Some analysts argue that each cycle is getting longer — peaking later and bottoming later. The data partially supports this:
Cycle 1 bottom-to-top: ~24 months
Cycle 2 bottom-to-top: ~36 months
Cycle 3 bottom-to-top: ~36 months
If cycles are indeed lengthening, the current cycle's top could extend into late 2025 or even early 2026.
Practical Implications for Traders
Position Sizing Through the Cycle
The halving cycle provides a framework for adjusting position sizes:
Cycle phase
Timing (relative to halving)
Strategy
Pre-halving accumulation
6-12 months before
Increase BTC allocation gradually
Post-halving consolidation
0-6 months after
Hold positions, expect volatility
Expansion phase
6-12 months after
Trail positions, begin taking partial profits
Euphoria phase
12-18 months after
Reduce exposure, increase stablecoin allocation
Distribution/bear
18-30 months after
Defensive positioning, accumulate at support
Using CoinXSight's Tools for Cycle Analysis
Deep Alpha → Monitor Confluence Score for BTC. Scores above 70 during the expansion phase confirm bullish momentum alignment across multiple indicators.
On-Chain Module → Track exchange outflows and whale accumulation. Accelerating exchange outflows during the expansion phase are bullish; sudden inflows during euphoria signal distribution.
AI Signal Engine → Alpha Hunter signals are most reliable during the expansion phase when trend following strategies perform best. Reduce position sizes on signals during the euphoria phase when reversals become more frequent.
Backtest Module → Validate cycle-based strategies by testing performance across previous halving periods. The module supports date-range filtering to isolate specific cycle phases.
What Could Invalidate the Halving Thesis?
No analysis is complete without considering the bear case:
1. Macro shock. A severe recession, credit crisis, or geopolitical event could overwhelm the supply reduction. The 2020 COVID crash demonstrated that macro events can temporarily break the halving cycle pattern (BTC dropped 50% five weeks before the halving).
2. Regulatory crackdown. Bans on Bitcoin mining, trading, or self-custody in major economies could suppress demand regardless of supply dynamics.
3. ETF outflows. If institutional investors begin redeeming ETF shares at scale, the selling pressure could offset the halving's supply reduction.
4. Technology risk. A major Bitcoin protocol vulnerability (extremely unlikely but not impossible) would break all cycle models.
5. The cycle is already priced in. If the market has fully anticipated the halving's effect, the post-halving rally may be muted or non-existent. The fact that BTC was already near all-time highs before the April 2024 halving supports this concern.
Summary
Bitcoin halving cycles have historically been the strongest predictive framework in crypto. Each halving reduces new BTC supply, creating a supply shock that has preceded massive bull runs in all three completed cycles. However, the returns are diminishing with each cycle as the market matures and the relative supply impact decreases.
The current 2024 cycle has unique structural tailwinds — ETF demand, corporate adoption, and record stablecoin liquidity — that could partially offset the diminishing returns pattern. On-chain metrics suggest the cycle has not yet reached the distribution phase that typically precedes cycle tops.
The balanced view: Use the halving cycle as a directional framework for portfolio positioning, but don't treat it as a guaranteed formula. Combine cycle awareness with real-time technical and on-chain analysis to adjust exposure dynamically.