Crypto Correlation & Sector Rotation: Trade the Macro, Not Just the Chart
Master crypto correlation analysis, BTC dominance cycles, sector rotation strategy, and alt season timing. Learn to position across the crypto ecosystem using macro flows.
MC
Marcus ChenSenior Quantitative Strategist·May 24, 2026 · 14 min read · Updated Oct 6
You find a perfect setup on SOL. RSI pullback, Order Block retest, funding rate negative. You enter long. But you didn't notice: BTC dominance is surging, money is flowing FROM alts INTO Bitcoin, and the entire alt sector is about to bleed for weeks.
The best individual trade setup in the world loses money if you're trading against the macro flow. Correlation and sector rotation tell you WHERE the money is going — before your chart tells you.
Understanding Crypto Correlation
BTC as the Gravity Well
In crypto, everything correlates with BTC to some degree. When BTC moves, the entire market moves.
Correlation Level
Meaning
Examples
0.9 – 1.0
Moves almost identically to BTC
ETH, most large caps during fear
0.7 – 0.9
Strongly correlated, some independence
SOL, AVAX, LINK during normal markets
0.4 – 0.7
Moderate correlation
DeFi tokens, gaming tokens
0.0 – 0.4
Weakly correlated
Stablecoins, some utility tokens
Negative
Moves opposite to BTC
BTC.D (BTC dominance), sometimes USD stables
When Correlations Break
Correlations are NOT fixed. They change based on market regime:
Market Regime
Correlation Behavior
Panic crash
ALL correlations go to 1.0 — everything dumps together
BTC-led rally
BTC leads, alts lag — correlations increase
Alt season
Alts outperform BTC — correlations decrease
Sector rotation
Some sectors rise while others fall — mixed correlations
The critical insight: Diversifying across 10 altcoins does NOT reduce risk during a panic. In a crash, all crypto assets become one asset. True diversification requires assets outside the crypto correlation matrix.
BTC Dominance: The Macro Compass
Modern crypto analytics platforms integrate these signals with additional data layers — combining trading indicators, on-chain metrics, and AI analysis for higher-probability entries.
What Is BTC.D?
BTC Dominance (BTC.D) = BTC market cap / Total crypto market cap. It tells you what percentage of total crypto value is stored in Bitcoin.
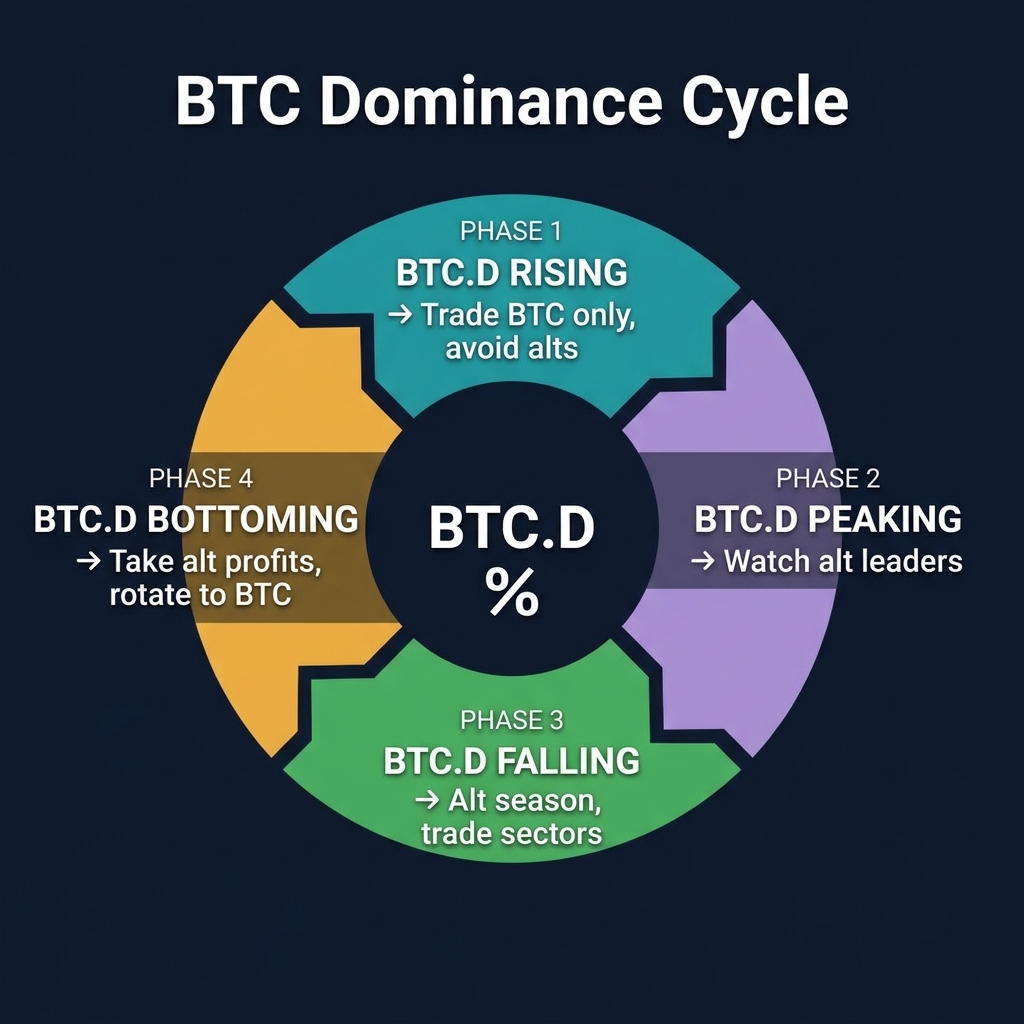
The BTC.D Cycle
BTC.D Trend
Phase
What to Trade
BTC.D rising
Risk-off / BTC accumulation
BTC only. Avoid or short alts
BTC.D peaking
Rotation beginning
Start watching alt leaders
BTC.D falling
Alt season / Risk-on
Alts and sectors. Reduce BTC allocation
BTC.D bottoming
Alt exhaustion
Take alt profits. Rotate back to BTC
Historical BTC.D Patterns
The cycle typically follows this sequence in bull markets:
BTC rallies first — BTC.D rises from ~40% to ~55-60%
ETH catches up — ETH/BTC ratio starts climbing
Large caps follow — SOL, AVAX, LINK, DOT rally
Mid caps explode — Sector leaders 5-10× in weeks
Micro caps / memes peak — Retail FOMO, BTC.D at cycle low (~35-40%)
Crash — BTC.D surges back as alts collapse 80-95%
Your job: Identify where we are in this sequence and position accordingly.
Crypto Sector Map
The Major Sectors
Sector
Examples
Catalyst Drivers
Layer 1
ETH, SOL, AVAX, SUI
Network activity, TVL growth, developer adoption
DeFi
UNI, AAVE, MKR, DYDX
TVL, fee revenue, protocol upgrades
AI/Compute
FET, RENDER, NEAR, TAO
AI narrative, partnership announcements
Gaming/Metaverse
IMX, GALA, AXS, SAND
Game launches, user metrics, NFT volume
Infrastructure
LINK, GRT, FIL, AR
Cross-chain adoption, data demand
Meme
DOGE, SHIB, PEPE, WIF
Social sentiment, viral momentum
RWA
ONDO, PENDLE, MAPLE
Institutional adoption, regulatory clarity
BTC Ecosystem
STX, ORDI, RUNE
BTC L2 development, ordinals activity
Sector Rotation Order
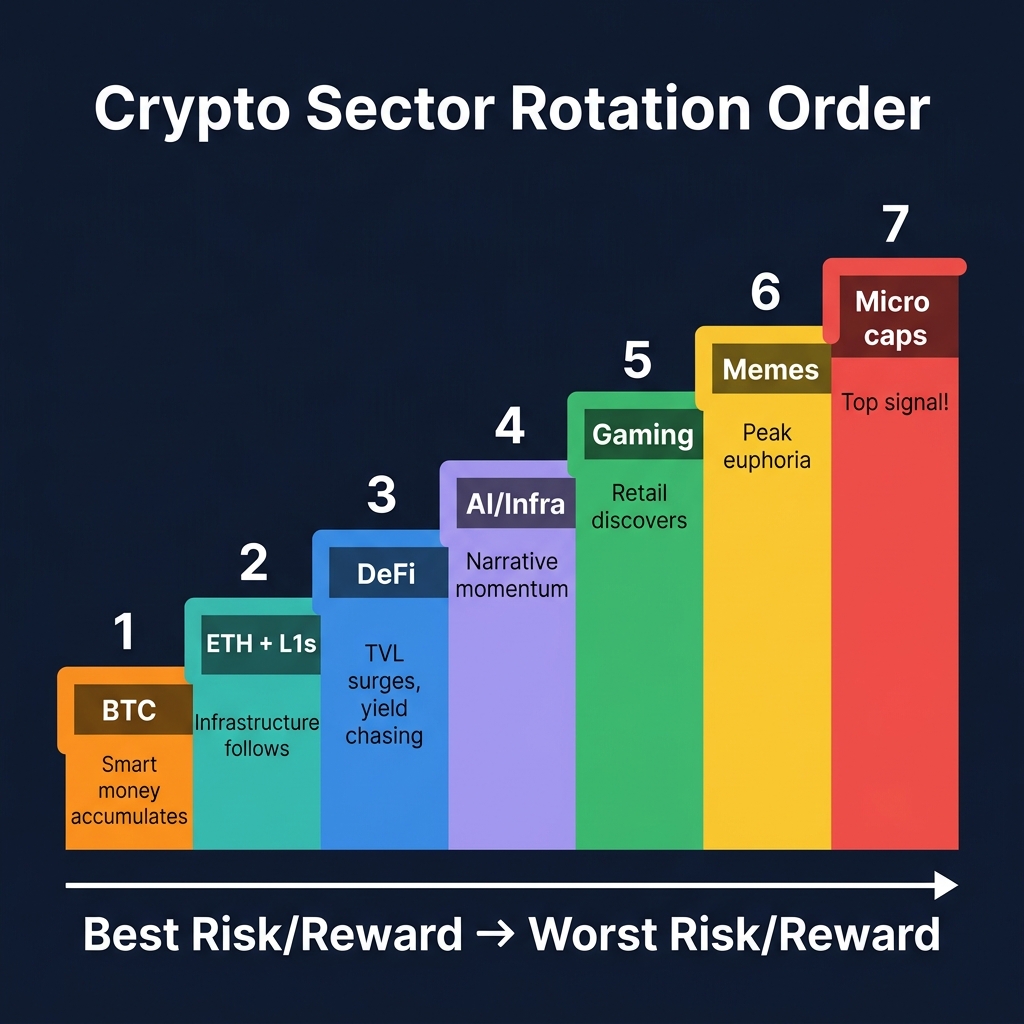
In a typical bull cycle, sectors rotate in this order:
BTC — Smart money accumulates first
ETH + L1s — Infrastructure plays follow
DeFi — Money needs yield, TVL surges
AI/Infra — Narrative-driven momentum
Gaming — Retail discovers "the next thing"
Memes — Peak euphoria, retail FOMO
Micro caps — Everyone is a genius (top signal)
The key insight: early-cycle sectors (BTC, ETH, DeFi) have the best risk/reward. Late-cycle sectors (memes, micro caps) have the worst risk/reward despite the largest absolute returns.
Practical Correlation Trading
Strategy 1: The Dominance Rotation
When BTC.D is rising + BTC price is rising:
→ MAXIMUM BTC allocation (60-80% of portfolio)
→ MINIMAL alt exposure
→ Only hold alts that are OUTPERFORMING BTC (rare in this phase)

When BTC.D starts falling + total market cap rising:
→ REDUCE BTC to 30-40%
→ ADD alt leaders (top 3 performers in each sector)
→ Focus on sectors with rising relative strength

When BTC.D is at cycle lows + euphoria everywhere:
→ START taking profits on alts
→ ROTATE back to BTC and stablecoins
→ This is the hardest trade (selling winners) but the most profitable
Strategy 2: Sector Relative Strength
Track each sector's performance relative to BTC over rolling 7 and 30-day periods.
Sector RS (vs BTC)
7-Day
30-Day
Signal
Both positive
↑
↑
Strong sector — overweight
7D positive, 30D negative
↑
↓
Early rotation IN — watch closely
7D negative, 30D positive
↓
↑
Late rotation OUT — take profits
Both negative
↓
↓
Weak sector — underweight or avoid
Strategy 3: Correlation Hedging
When you hold multiple alts, check their correlation:
Portfolio: ETH + SOL + AVAX + LINK

If all 4 have 0.85+ correlation to each other:
→ You effectively have ONE position, not four
→ A BTC dump kills all four simultaneously
→ Effective risk = 4× what you think

Better: ETH + SOL + RENDER + ONDO
→ Mix of L1 + AI + RWA sectors
→ Lower internal correlation
→ Drawdown is more manageable
Timing Alt Season
Alt Season Indicators
Indicator
Alt Season Signal
BTC Season Signal
BTC.D
Falling below 50%
Rising above 55%
ETH/BTC
Rising
Falling
Top 50 altcoins
>75% outperforming BTC (30D)
<25% outperforming
Funding rates
Alts have high positive funding
BTC has high positive, alts neutral
Social metrics
Alt-related searches surging
BTC searches dominating
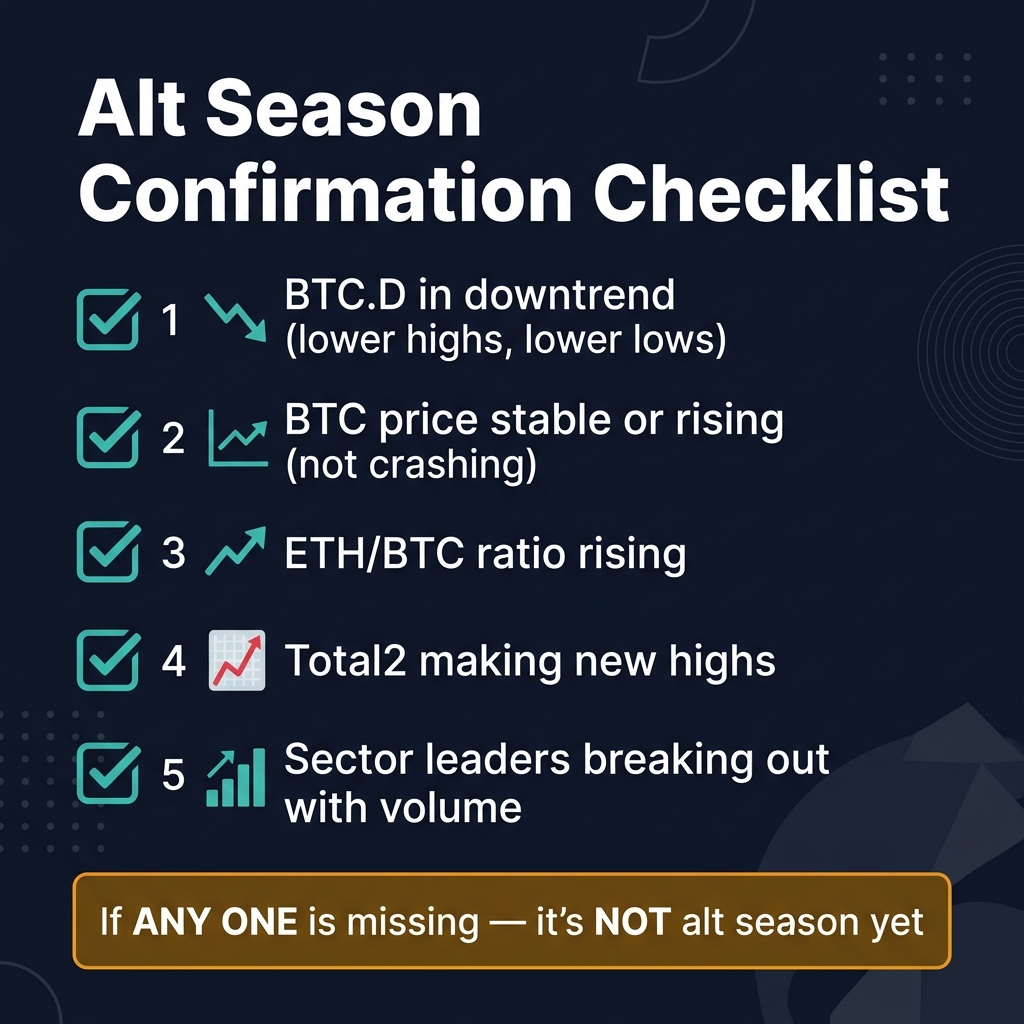
The Alt Season Confirmation Checklist
Before going heavy into alts, confirm ALL of these:
BTC.D is in a confirmed downtrend (lower highs, lower lows)
BTC price is stable or rising (not crashing)
ETH/BTC is rising
Total2 (total market cap excluding BTC) is making new highs
Sector leaders are breaking out with volume
If even ONE is missing, it's not alt season yet — it's a bear market rally or a BTC rotation.
CoinXSight Integration
CoinXSight's crypto analytics platform streamlines this workflow with AI-powered tools and real-time data:
Discovery: Sector Scanner
CoinXSight's Discovery module tracks sector performance in real-time. See which sectors are gaining relative strength and which are losing momentum.
Alpha Hunter: Cross-Sector Signals
Alpha Hunter generates signals across all sectors simultaneously. When multiple signals appear in the same sector, it confirms sector rotation into that vertical.
ASI Score: Macro Component
The ASI Score includes a macro component that factors in BTC dominance trends, sector flows, and cross-asset correlation. A high ASI during a sector rotation phase is significantly more reliable than one during BTC dominance expansion.
Individual chart setups are tactics. Correlation and sector rotation are strategy. The best traders combine both: they use macro flows to decide WHAT to trade, then use chart analysis to decide WHEN to enter. If you're only doing the second, you're trading with one eye closed.
Master funding rate analysis, open interest tracking, and liquidation cascade prediction for crypto trading. Learn to read leveraged positioning, detect…
Master multi-timeframe analysis for crypto trading. Learn the 3-timeframe rule, top-down analysis flow, timeframe alignment signals, and how to combine…