AI-Powered Backtesting: How to Optimize Your Strategy Without Overfitting
Master the science of strategy validation with AI-powered backtesting — walk-forward analysis, Monte Carlo simulation, parameter sensitivity, and the critical metrics that separate robust strategies from curve-fitted illusions.
Every profitable-looking backtest contains a seductive lie: "This strategy would have made money." The key word is "would have." The vast majority of strategies that perform beautifully on historical data fail catastrophically when deployed with real capital — not because the market changed, but because the strategy was never robust in the first place. It was overfitted.
Overfitting is the single biggest destroyer of trading accounts among systematic traders. And it's insidious because it looks exactly like skill. This guide builds on the fundamentals covered in our Backtest Strategy Guide and breaks down the science of building strategies that survive contact with live markets — using AI-powered validation techniques that go far beyond basic backtesting.
The Overfitting Trap: Why Most Backtested Strategies Fail
Before learning how to build robust strategies, you need to understand exactly why the default approach fails.
What Is Overfitting?
Overfitting occurs when a strategy's rules are too precisely tailored to historical data. Instead of capturing genuine market patterns, the strategy learns to exploit specific historical sequences that won't repeat.
Analogy: Imagine "studying" for an exam by memorizing the exact answers to last year's test. You'd score 100% on last year's test — but if this year's questions are different (and they will be), you fail. Overfitting is memorizing the past instead of learning the principles.
How Overfitting Happens in Practice
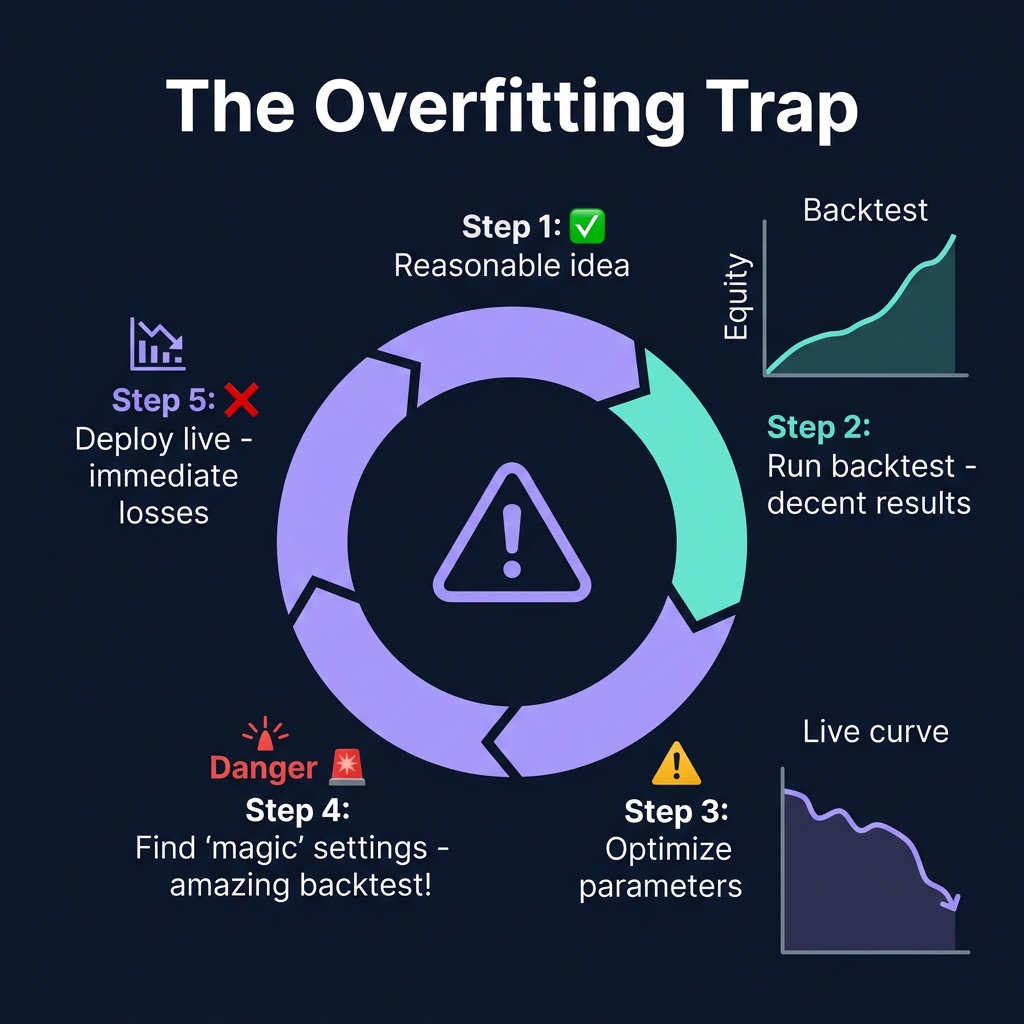
The typical overfitting cycle:
Start with a reasonable idea: "Buy when RSI crosses above 30 and EMA 21 > EMA 50"
Run backtest: Results are decent — 55% win rate, 1.3 profit factor
Start optimizing: "What if I change RSI to 28 instead of 30? What about EMA 19 instead of 21?"
Find magic parameters: RSI(28), EMA(19, 47) produces a 72% win rate and 2.1 profit factor!
Deploy with confidence: Strategy fails immediately. Drawdown begins on week one.
The problem? Step 4 found parameters that happened to align with specific historical price movements. RSI(28) crossed exactly at the right moments in 2024. EMA(19, 47) happened to capture specific trend transitions. These alignments were coincidences, not patterns.
The Degrees of Freedom Problem
Every parameter you optimize adds a "degree of freedom" — an opportunity for the model to fit noise instead of signal. A strategy with 2 parameters (RSI threshold + EMA period) has reasonable robustness. A strategy with 8 parameters (RSI threshold + period + EMA fast + slow + volume threshold + ATR multiplier + time filter + day-of-week filter) has so many degrees of freedom that it can fit almost ANY historical dataset perfectly — while learning absolutely nothing about actual market dynamics.
Rule of thumb: If your strategy has more than 4 optimizable parameters, you're almost certainly overfitting.
How AI-Powered Backtesting Is Different
Traditional backtesting asks: "Would this strategy have made money?" AI-powered backtesting asks a much harder question: "Will this strategy make money on data it has never seen?"
The difference lies in three validation techniques that standard backtesting tools don't provide:
1. Walk-Forward Analysis
What it is: Instead of testing the strategy on the same data used to optimize it, walk-forward analysis splits history into alternating "optimization" and "validation" windows.
How it works:
Step
Period
Purpose
1
Jan 2024 – Jun 2024
Optimize parameters (in-sample)
2
Jul 2024 – Sep 2024
Test optimized parameters (out-of-sample)
3
Apr 2024 – Sep 2024
Re-optimize with new data
4
Oct 2024 – Dec 2024
Test again (out-of-sample)
5
Jul 2024 – Dec 2024
Re-optimize again
6
Jan 2025 – Mar 2025
Test again (out-of-sample)
The strategy is ONLY evaluated on its out-of-sample performance — data it has never "seen" during optimization. This simulates the real-world experience of deploying a strategy on future, unknown data.
Why it matters: A strategy that produces consistent results across multiple out-of-sample windows demonstrates genuine pattern recognition. A strategy that works in-sample but fails out-of-sample is overfitted.
Key metric: Walk-Forward Efficiency (WFE) = Out-of-sample performance / In-sample performance. Target: WFE > 50%. If out-of-sample performance is less than half of in-sample performance, the strategy is likely overfitted.
2. Monte Carlo Simulation
What it is: Stress-testing the strategy under thousands of randomized conditions to measure how fragile or robust the results are.
How it works:
Monte Carlo simulation takes your backtest results and runs 1,000–10,000 variations by randomly:
Reordering trades: What if the winning trades happened in a different sequence?
Adding random slippage: What if execution is worse than backtested?
Varying fill rates: What if some limit orders don't fill?
Shifting start dates: What if you started trading on a different day?
Each variation produces different equity curves, drawdown profiles, and final account balances.
Why it matters: A robust strategy performs well across most Monte Carlo variations. A fragile strategy is highly dependent on the specific sequence of trades — meaning live results will likely diverge significantly from backtested results.
Key metrics from Monte Carlo:
Metric
What It Tells You
Target
95th percentile max drawdown
Worst-case drawdown you should prepare for
< 25% of account
5th percentile final P&L
Worst realistic outcome
Still profitable
Probability of ruin
Chance of losing X% of account
< 5%
Confidence interval
Range of expected outcomes
Narrow = robust
3. Parameter Sensitivity Analysis
What it is: Testing how much your strategy's performance changes when parameters shift slightly from their "optimal" values.
How it works:
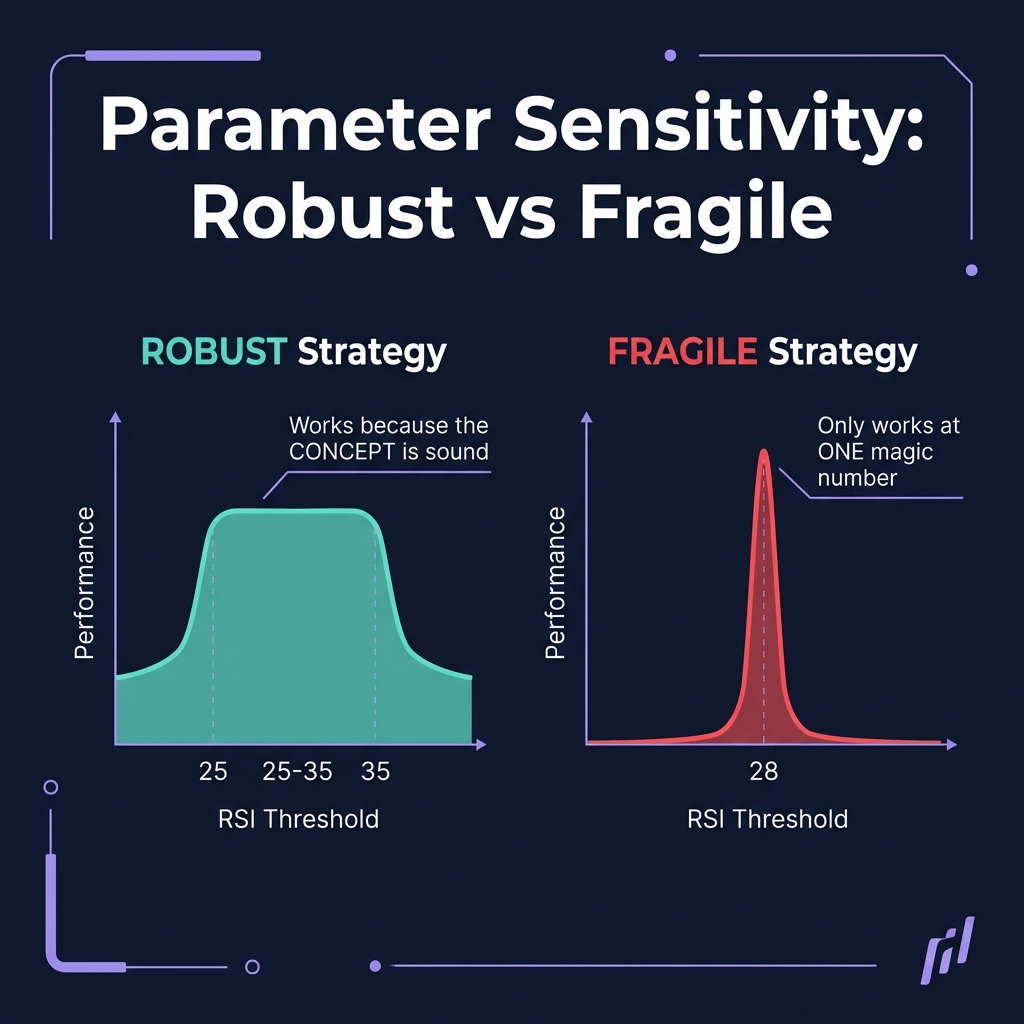
Instead of finding the single best RSI threshold (say, 28), parameter sensitivity tests a RANGE around that value:
RSI = 25: Performance?
RSI = 26: Performance?
RSI = 27: Performance?
RSI = 28: Performance? ← "optimal"
RSI = 29: Performance?
RSI = 30: Performance?
RSI = 31: Performance?
This creates a "sensitivity surface" showing how performance varies as parameters change.
Why it matters:
Robust strategy: Performance remains stable across a wide range of parameter values. RSI 25–32 all produce similar results. The strategy works because the CONCEPT is sound, not because one magic number happens to align with history.
Overfitted strategy: Performance is highly sensitive to exact parameter values. RSI 28 produces great results, but RSI 27 or RSI 29 produce losses. This means the "edge" depends on a precise calibration that future markets won't preserve.
Rule: If changing any parameter by ±15% causes a >50% change in performance, the strategy is fragile and likely overfitted.
Practical: CoinXSight Backtest Engine Walkthrough
Here's how to apply these AI validation techniques using the Backtest Engine:
Step 1: Define Strategy Rules
Start with clear, simple rules. The best strategies you can backtest have 2–4 parameters maximum:
Example — EMA Crossover with RSI Filter:
Entry (Long): EMA(21) crosses above EMA(50) AND RSI(14) is between 40–65
Exit: EMA(21) crosses below EMA(50) OR RSI(14) > 80
This strategy has 4 parameters: EMA fast period, EMA slow period, RSI boundaries, and ATR multiplier. That's manageable.
Step 2: Run Initial Backtest (In-Sample)
Select your token, timeframe, and date range. Run the backtest on the full available history first to get a baseline. Record:
Total return
Win rate
Profit factor
Maximum drawdown
Sharpe ratio
Number of trades
Critical: This is your IN-SAMPLE result. It looks great because the strategy was designed for this data. Don't trust it yet.
Step 3: Run Walk-Forward Validation (Out-of-Sample)
Configure the walk-forward test with:
Optimization window: 6 months
Validation window: 3 months
Step: Roll forward by 3 months each iteration
The engine automatically re-optimizes on each in-sample window and tests on the subsequent out-of-sample window. Compare the out-of-sample aggregate performance to the in-sample results.
Decision matrix:
Walk-Forward Efficiency
Verdict
> 70%
Excellent — strategy is robust
50–70%
Good — minor overfitting, acceptable for live trading with reduced size
30–50%
Concerning — significant overfitting. Re-simplify the strategy
< 30%
Failed — strategy is curve-fitted. Do not trade
Step 4: Run Monte Carlo Simulation
With the out-of-sample validated strategy, run 5,000 Monte Carlo iterations. Focus on:
95th percentile drawdown: This is your realistic worst-case. If it exceeds your drawdown tolerance, reduce position size or tighten stops.
Probability of ruin (losing 40%+): Must be below 5%. If it's above 10%, the strategy is too risky regardless of expected return.
Return distribution: Is the median return positive? Is the 25th percentile still profitable?
Step 5: Analyze Parameter Sensitivity
Test each parameter ±20% from optimal. Look for a "plateau" rather than a "peak" in the performance surface:
Plateau (robust): Performance stays within 20% of optimal across the entire ±20% range
Peak (fragile): Performance drops off sharply when parameters shift even slightly
If any parameter shows peak behavior, consider fixing it at a rounder number (RSI 30 instead of 28) or removing that parameter entirely and using a default value.
Key Metrics That Matter vs. Vanity Metrics
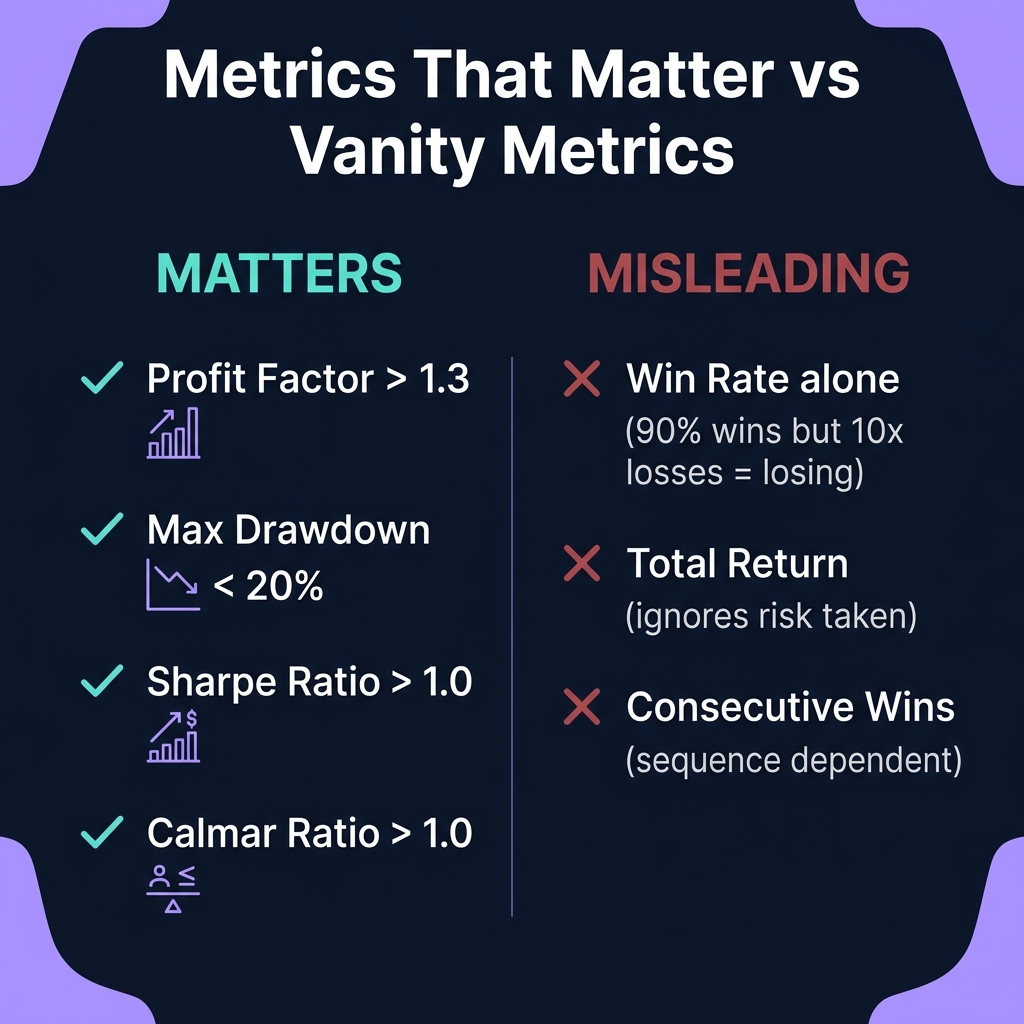
Not all backtest metrics are created equal. Some tell you important things about strategy robustness. Others are misleading. Know the difference.
Metrics That Matter
Profit Factor (Target: > 1.3)
What it is: Gross profit divided by gross loss.
Why it matters: A profit factor of 1.5 means for every $1 lost, the strategy gains $1.50. This is the single most informative metric because it captures BOTH win rate and average win/loss size.
Warning: Profit factor > 3.0 on a backtest almost always indicates overfitting unless the strategy trades very infrequently.
Maximum Drawdown (Target: < 20%)
What it is: The largest peak-to-trough decline in the equity curve.
Why it matters: Drawdown is what kills traders psychologically and financially. Even a highly profitable strategy is unusable if it has a 50% drawdown — because most traders will abandon it during the drawdown, locking in the loss before the recovery.
Monte Carlo adjustment: Your actual max drawdown will likely be 1.5–2x the backtested drawdown. Plan for the 95th percentile Monte Carlo drawdown, not the backtested one.
Sharpe Ratio (Target: > 1.0)
What it is: Risk-adjusted return = (Return – Risk-free rate) / Standard deviation of returns.
Why it matters: Sharpe normalizes returns by volatility. A strategy returning 50% annually with 10% volatility (Sharpe 5.0) is far superior to one returning 100% with 80% volatility (Sharpe 1.25), even though the raw return is lower.
Calmar Ratio (Target: > 1.0)
What it is: Annual return divided by maximum drawdown.
Why it matters: Directly answers the question "how much did I earn per unit of worst-case pain?" A Calmar of 2.0 means the strategy earned twice its worst drawdown annually.
Vanity Metrics (Misleading if Isolated)
Win Rate (Alone)
A 90% win rate sounds impressive but is meaningless without R:R context. A strategy that wins 90% of trades but loses 10x the average win per loss is a money-losing strategy.
Total Return
The headline number everyone looks at first — and the most misleading. Total return doesn't account for risk taken, drawdowns endured, or leverage used. A 200% return with a 60% drawdown is worse than a 50% return with a 10% drawdown.
Number of Consecutive Wins
Streak metrics tell you about the specific sequence in the backtest, not about the strategy's edge. They're entirely sequence-dependent and change dramatically in Monte Carlo simulation.
The Robust Strategy Development Process
Based on everything above, here's the complete process for developing a strategy that survives live markets:
Phase 1: Hypothesis (Don't Start with Data)
Start with a market THEORY, not a data mining exercise:
"Trend-following works in crypto because trends persist due to reflexivity and FOMO"
"Mean reversion works in range-bound conditions because market makers defend key levels"
"Breakouts with volume confirmation work because institutional orders create supply/demand imbalances"
The theory should make logical sense BEFORE you test it. If you can't explain WHY it should work, any positive backtest is likely coincidence.
Phase 2: Simple Implementation
Translate the theory into the simplest possible rules. Two to four parameters maximum. No complex filters, no day-of-week adjustments, no parameter combinations that you found through optimization.
Phase 3: Baseline Backtest
Run on the full available history. If the baseline performance is negative or marginal (profit factor < 1.1), the theory might be wrong. Don't try to optimize a fundamentally broken idea into profitability — that's the definition of overfitting.
Phase 4: Walk-Forward Validation
If the baseline is promising, run walk-forward analysis. This is the "truth test." Accept the results, even if they're worse than the baseline. The walk-forward performance is the realistic estimate of future performance.
Phase 5: Monte Carlo Stress Test
Validate the walk-forward results under randomized conditions. Ensure the strategy survives adverse sequencing and execution slippage.
Phase 6: Parameter Sensitivity Check
Confirm that performance is robust across parameter ranges. If it is, choose the parameter values at the CENTER of the stable region, not at the "optimal" edge.
Phase 7: Paper Trade Validation
Before risking real capital, run the validated strategy in paper trading mode for at least 30 trades (learn more in our Paper Trading Guide). Compare live results to backtested expectations. If live performance is within the Monte Carlo confidence interval, the strategy is validated.
Phase 8: Live Deployment (Reduced Size)
Start with 25–50% of intended position size. Track performance for 50+ trades. If metrics remain consistent with backtest expectations, scale up gradually.
When to Stop Optimizing: The Law of Diminishing Returns
One of the hardest decisions in strategy development is knowing when to stop. The temptation to keep tweaking — "just one more filter" — is the gateway to overfitting.
Signs You Should Stop
Walk-forward efficiency is above 60%: The strategy is already robust. Further optimization will likely DECREASE out-of-sample performance.
Parameter sensitivity shows plateaus: The parameters are in stable regions. Moving them won't improve things meaningfully.
You've been optimizing for more than 3 sessions: If you're still searching after three focused optimization sessions, the strategy's edge might simply be what it is. Accept it or start over with a new hypothesis.
Signs You Need to Start Over
Walk-forward efficiency is below 30%: The concept is overfitted. No amount of parameter tuning will fix a fundamentally flawed idea.
Monte Carlo shows >15% ruin probability: The strategy is too risky. Either the edge is too small or the drawdowns are too severe.
The strategy requires more than 5 parameters to work: Complexity is the enemy of robustness. Start over with a simpler approach.
Frequently Asked Questions
Q: How much historical data do I need for reliable backtesting?
A minimum of 200 trades across at least 2 different market regimes (bull + bear or trending + ranging). For crypto, 2+ years of data covering at least one full cycle is ideal. Less than 100 trades makes statistical conclusions unreliable.
Q: Can I backtest on one token and trade on another?
With caution. A strategy backtested on BTC won't necessarily work on altcoins because volatility structures differ. Best practice: backtest on the specific tokens you plan to trade. If you want a "universal" strategy, backtest on 5+ tokens independently and only deploy on tokens where it passes walk-forward validation on each.
Q: How often should I re-optimize a live strategy?
Quarterly at most. Monthly re-optimization risks adapting to recent noise rather than genuine regime changes. Many professionals re-optimize only when performance degrades below Monte Carlo confidence intervals — which might mean years between adjustments for robust strategies.
Q: What's the difference between AI backtesting and regular backtesting?
Regular backtesting runs your rules on historical data and reports results. AI backtesting adds: (1) walk-forward validation to detect overfitting, (2) Monte Carlo simulation to stress-test robustness, (3) parameter sensitivity analysis to identify fragile calibrations, and (4) automated risk scoring that flags potential overfitting before you deploy.
Q: My backtest shows 200% annual return. Is that realistic?
Almost certainly not. Returns above 100% annually typically indicate one or more of: overfitting, survivorship bias (only testing on tokens that went up), unrealistic execution assumptions (no slippage, instant fills), or excessive leverage. After walk-forward validation and Monte Carlo adjustment, realistic crypto strategy returns are typically 30–80% annually for well-designed strategies.
Start Building Robust Strategies
The difference between a backtested strategy and a battle-tested strategy is validation. Every technique in this guide exists to answer one question: "Is this edge real, or am I fooling myself?" Once validated, integrate your strategy into a Complete Trading System for consistent execution.
Master risk management for crypto trading. Learn position sizing formulas, stop-loss strategies, and how CoinXSight's Portfolio module tracks your risk…