You bought a token with great tech, strong community, and a chart that looked bullish. Two weeks later it dropped 60%. Not because of a hack, not because of bad news — 40% of total supply was about to unlock and hit the market. The sellers were baked into the tokenomics from day one, and you didn't check.
Crypto tokenomics is the single most overlooked factor in buy/sell decisions. Most traders check the chart, read the narrative, maybe glance at market cap. Almost none calculate the FDV/MC ratio, check the unlock calendar, or measure the inflation rate. This guide fixes that.
This isn't a developer-focused explanation of token standards and smart contracts. This is a trader's framework for evaluating whether a token's supply structure will work for you or against you — and how to use AI tools and CoinXSight's ASI Score to automate the process.

What Is Crypto Tokenomics (For Traders, Not Developers)?
Tokenomics is the economic structure of a cryptocurrency's supply — how many tokens exist, who holds them, when they're released, and what incentives drive holders to buy, sell, or hold.
For developers, tokenomics means smart contract logic, emission curves, and governance mechanisms. For traders, tokenomics answers one question: will supply dynamics push this token's price up or down from here?
The concept originates from combining "token" with "economics" and was popularized during the 2017-2018 ICO era when projects first started designing explicit supply schedules. Since then, tokenomics design has become the primary mechanism through which early investors (VCs, teams, advisors) extract value — or align their interests with retail buyers.
Three supply mechanics directly affect price:
- Circulating supply vs. total supply — how much of the token is tradeable right now versus locked
- Emission schedule — how fast new tokens enter circulation (inflation)
- Demand sinks — what reasons exist to hold or use the token instead of selling it (staking, fees, governance, burns)
When circulating supply increases faster than demand, price drops. When demand increases faster than supply, price rises. Every other tokenomics concept maps to this basic equation.
⚠️ Limitation: Tokenomics analysis tells you about supply-side pressure but cannot predict demand-side catalysts. A token with poor tokenomics can still pump on narrative hype — and a token with perfect tokenomics can bleed if nobody wants it. Always combine tokenomics with technical analysis and on-chain data.
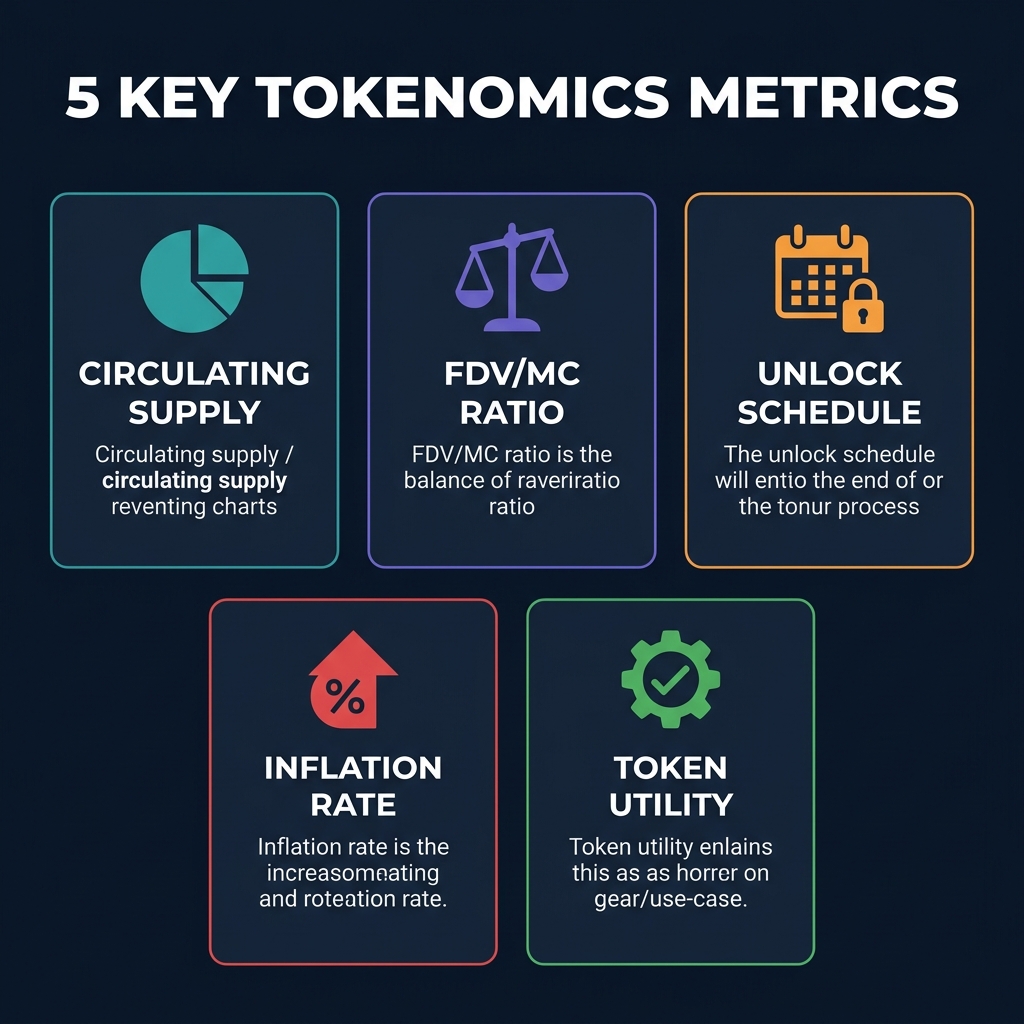
The 5 Crypto Tokenomics Metrics Every Trader Must Check
Before buying any token, evaluate these five metrics. Skip even one and you're trading blind on the supply side.
1. Circulating Supply vs. Total Supply
What it tells you: How much of the token is actually tradeable right now.
Check CoinGecko for any token and compare two numbers: circulating supply and max supply. If circulating supply is 200 million but max supply is 1 billion, only 20% of tokens exist in the market. The other 80% will eventually enter circulation — and someone is holding them.
Key ratio: Circulating / Max Supply
- Above 0.80 — Most supply is already out. Low dilution risk.
- 0.50 to 0.80 — Moderate future supply. Check the unlock schedule.
- Below 0.50 — High dilution risk. Significant sell pressure ahead.
2. FDV/MC Ratio (Fully Diluted Valuation to Market Cap)
What it tells you: How much hidden dilution the current price is hiding.
FDV/MC Ratio = Fully Diluted Valuation / Current Market Cap
Where:
- Market Cap = Current Price × Circulating Supply
- FDV = Current Price × Max Supply
An FDV/MC ratio of 5.0× means the total supply is valued at 5× what's currently circulating. If all tokens entered the market at today's price, the market cap would need to quintuple just to maintain the current price. That rarely happens.
| FDV/MC Ratio | Risk Level | Interpretation |
|---|---|---|
| 1.0× – 1.5× | Low | Most supply circulating. Minimal dilution ahead. |
| 1.5× – 3.0× | Moderate | Some locked supply. Check unlock timeline. |
| 3.0× – 5.0× | High | Significant locked supply. Major dilution risk. |
| Above 5.0× | Very High | Low-float, high-FDV structure. Historically correlates with 50-80% drawdowns post-unlock. |
3. Token Unlock Schedule
What it tells you: Exactly when large batches of tokens will hit the market.
Use Token Unlocks to pull the vesting schedule for any project. Look for:
- Cliff unlocks — large one-time releases (10%+ of supply) on a specific date
- Linear unlocks — gradual daily/monthly releases
- Team and investor allocations — these holders often sell after unlock
Research from major crypto analytics firms shows approximately 90% of token unlock events produce negative price pressure, with selling often starting up to 30 days before the actual unlock date.
4. Inflation Rate
What it tells you: How fast the supply is growing annually.
Inflation Rate = (New Supply per Year / Current Circulating Supply) × 100
If a token mints 50 million new tokens per year and circulating supply is 500 million, the inflation rate is 10%. That means the token's price must appreciate 10% annually just to maintain the same market cap — before any actual gains for holders.
| Inflation Rate | Assessment |
|---|---|
| 0% (deflationary or capped) | Strong — no supply pressure |
| 1-5% | Manageable — most mature chains |
| 5-10% | Elevated — needs strong demand to offset |
| Above 10% | Aggressive — significant headwind for price |
5. Token Utility (Demand Sinks)
What it tells you: Whether there's a reason to hold the token other than speculation.
Look for active demand sinks:
- Staking with real yield — fees distributed to stakers (not just emissions)
- Fee burns — a portion of transaction fees permanently removed from supply (like ETH's EIP-1559)
- Required for usage — the token must be spent to use the protocol (like LINK for oracle requests)
- Governance with economic weight — voting power tied to meaningful treasury decisions
Tokens with no utility beyond speculation have no demand floor. When sell pressure hits from unlocks or inflation, there's nothing to absorb it.
💡 On CoinXSight, the Deep Alpha module's ASI Score automatically evaluates token utility as part of its Tokenomics Layer. Tokens with strong demand sinks score higher on the utility component, giving you a quick filter before manual analysis.
FDV/MC Ratio: The Single Most Important Metric
The FDV/MC ratio deserves its own section because it's the single best predictor of post-launch price decay in new tokens. As documented by researchers and market analysts: the "low float, high FDV" model — where projects launch with a tiny circulating supply and massive total supply — has been the dominant cause of retail losses in 2024-2026.
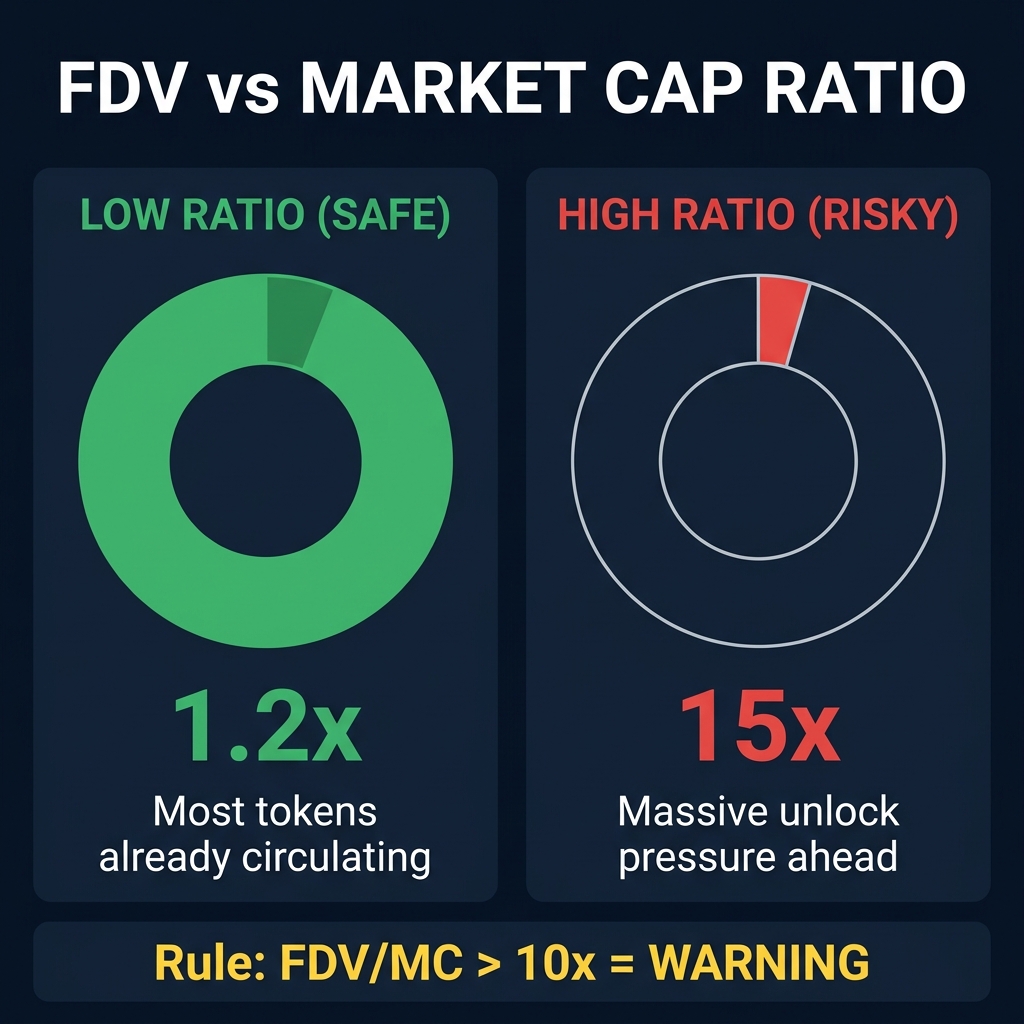
How to Calculate FDV/MC Ratio
FDV = Current Price × Max Supply
Market Cap = Current Price × Circulating Supply
FDV/MC Ratio = FDV / Market Cap
Why High FDV/MC Kills Returns
Consider two tokens with identical $500M market caps:
Scenario — Comparing Token A vs. Token B (Same Market Cap, Different Tokenomics)
Token A: $500M market cap, 800M circulating out of 1B total. FDV = $625M. FDV/MC ratio = 1.25×. Only 20% of supply remains locked. Dilution risk: low.
Token B: $500M market cap, 100M circulating out of 1B total. FDV = $5B. FDV/MC ratio = 10×. A full 90% of supply is still locked. Dilution risk: extreme.
Both tokens look the same on a market cap screener. But Token B has $4.5 billion in future sell pressure baked into its vesting schedule. When those tokens unlock, they hit the open market. Historical data from 2024-2026 shows tokens with FDV/MC ratios above 5× experienced average drawdowns of 50-80% within 12 months of major unlock events.
The trap works like this: retail sees a $500M market cap and thinks "this could 10×." But the FDV is already $5B — a 10× from here would put it at $50B FDV, which might only be realistic for a top-20 cryptocurrency. The upside was already captured by early investors who bought at a fraction of today's price.
Real-World FDV/MC Check
Before buying any token, run this 30-second check:
- Go to CoinGecko → search the token
- Note the Market Cap and Fully Diluted Valuation
- Divide FDV by Market Cap
- If the result is above 3.0×, check the unlock schedule immediately
- If above 5.0×, treat the position as high-risk regardless of narrative
Token Unlock Calendar: Reading the Supply Schedule
Token unlocks are the most predictable sell-pressure events in crypto. Unlike market sentiment or whale movements, unlock dates are public and scheduled months or years in advance. Yet most traders ignore them.
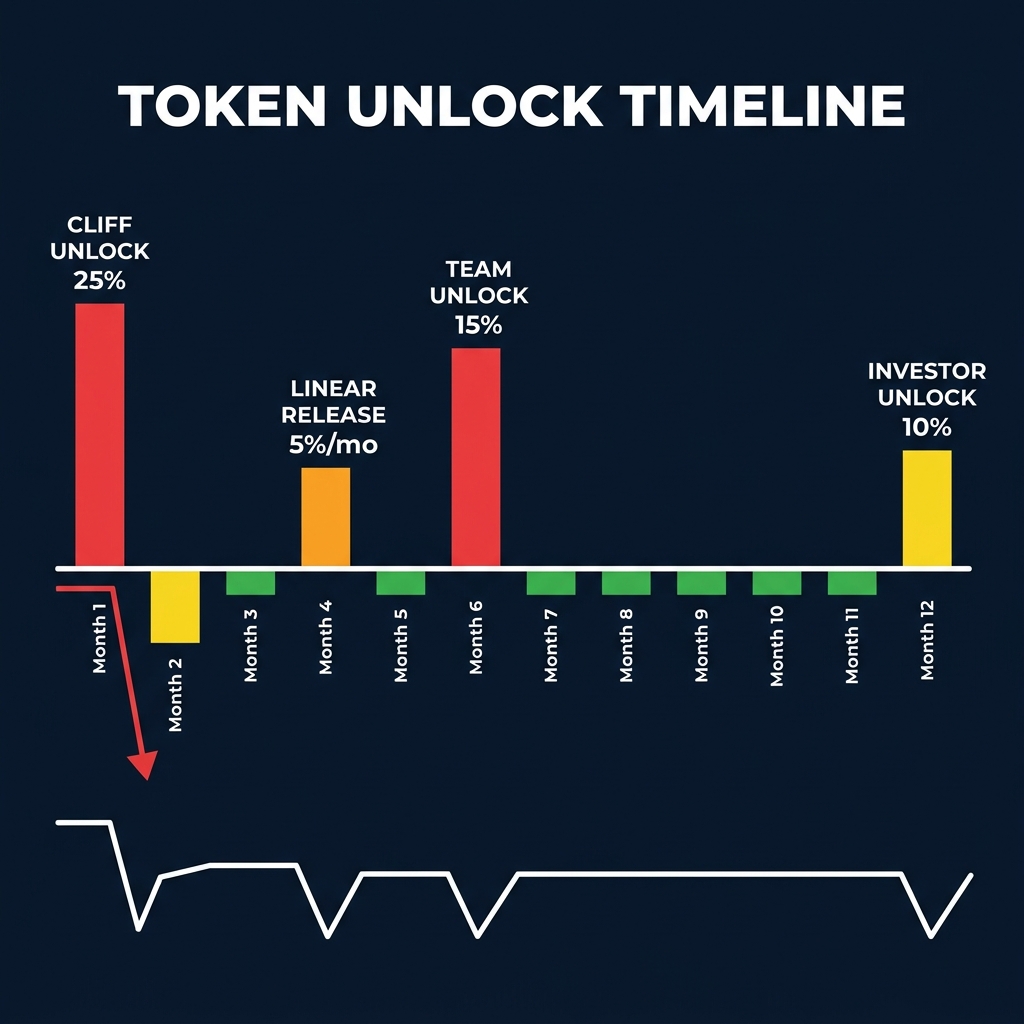
Types of Unlocks
Cliff unlocks release a large batch of tokens on a single date. These are the most dangerous because they create sudden supply shocks. If the unlock amount exceeds 2.4× the token's average daily trading volume, the probability of a significant price drop increases substantially.
Linear unlocks release tokens continuously (daily, weekly, or monthly). These create persistent but predictable dilution. The market absorbs linear unlocks more easily because traders can factor them into ongoing price discovery.
How to Read an Unlock Schedule
Pull up any token on Token Unlocks and look for:
- Next cliff date — when is the next large batch releasing?
- Unlock size as % of circulating supply — anything above 5% is material
- Recipient category — team, investors, ecosystem, or treasury
- Historical unlock impact — did previous unlocks for this token cause drops?
Example — Arbitrum (ARB) June 2026 Unlock
On June 16, 2026, approximately 92.65 million ARB tokens were scheduled for release to the DAO treasury, investors, and team allocations — valued at roughly $7.5-10M. This continues a monthly linear-style release pattern. For ARB, these recurring unlocks represent approximately 0.6% of circulating supply per month.
While each individual unlock is small relative to ARB's daily volume, the cumulative effect matters: over 12 months, these linear releases add up to ~7% dilution. Traders using CoinXSight's Deep Alpha module could track the Tokenomics Layer of the ASI Score, which downgrades tokens approaching cliff events and factors cumulative dilution into the overall rating.
Pre-Unlock Trading Pattern
Research shows a consistent pattern around major cliff unlocks:
- 30 days before: Informed traders begin reducing positions. Price starts weakening.
- 7-14 days before: Selling accelerates. Short interest increases.
- Unlock day: Often not the worst day — much of the selling already happened.
- 7-30 days after: Unlocked holders gradually sell. Price finds a new floor.
- Post-absorption: If the project has strong fundamentals, price recovers over 2-3 months.
Team unlocks tend to cause the most severe drops (up to -25% in extreme cases) because team members often sell in uncoordinated fashion. Investor (VC) unlocks are often less impactful because institutional holders use OTC desks and hedging strategies to minimize market impact.
The Dilution Impact Formula
Calculate the theoretical price impact of an upcoming unlock:
Dilution Impact = Current Price × (Circulating Supply / Total Supply After Unlock)
If a token trades at $2.00 with 500M circulating and 100M tokens are about to unlock:
New theoretical price = $2.00 × (500M / 600M) = $1.67
This represents a 16.7% dilution — assuming all unlocked tokens are sold immediately. In practice, not all tokens sell on day one, but this calculation shows the maximum downside from pure supply dilution.
💡 On CoinXSight, the Deep Alpha module flags upcoming unlock events in its token analysis panel. The ASI Score's Tokenomics Layer automatically adjusts downward when a token is within 30 days of a cliff unlock exceeding 5% of circulating supply.
AI-Powered Tokenomics Analysis in 2026
Manual tokenomics evaluation is time-consuming. In 2026, you can use AI tools to parse vesting schedules, calculate dilution, and flag risks in minutes instead of hours.
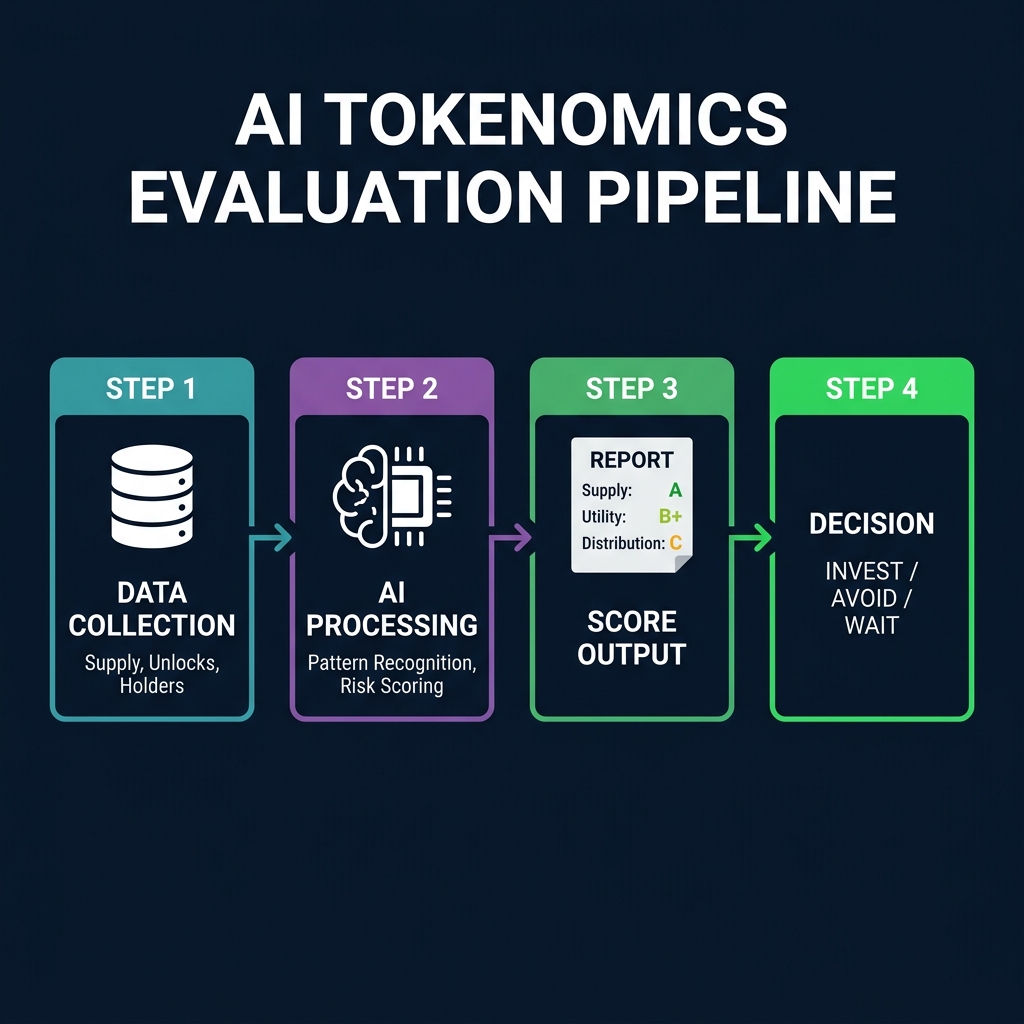
ChatGPT/Gemini Prompt Templates for Tokenomics
Copy these prompts and paste the token's vesting schedule data from Token Unlocks, CoinGecko, or the project's documentation:
Prompt 1 — Unlock Schedule Analysis:
Analyze this token's unlock schedule. For each upcoming unlock event,
calculate: (1) unlock amount as % of current circulating supply,
(2) estimated sell pressure relative to 30-day average daily volume,
(3) risk rating (low/medium/high/critical). Flag any cliff unlock
exceeding 5% of circulating supply within the next 90 days.

Token: [NAME]
Circulating Supply: [NUMBER]
30-Day Avg Daily Volume: [NUMBER]
Unlock Schedule:
[PASTE SCHEDULE DATA]
Prompt 2 — FDV/MC Comparative Analysis:
Compare the tokenomics of these tokens. For each, calculate: FDV/MC ratio,
annual inflation rate, % of supply held by team/investors, and next major
cliff unlock. Rank them from lowest to highest dilution risk. Present results
in a table.

Token 1: [NAME] — MC: [X], FDV: [X], Circ Supply: [X], Max Supply: [X]
Token 2: [NAME] — MC: [X], FDV: [X], Circ Supply: [X], Max Supply: [X]
Token 3: [NAME] — MC: [X], FDV: [X], Circ Supply: [X], Max Supply: [X]
Prompt 3 — Red Flag Scanner:
Review this token's tokenomics and flag any red flags from this checklist:
(1) FDV/MC ratio above 5×, (2) team allocation above 25%, (3) cliff unlock
>10% of circ supply within 90 days, (4) no token burn mechanism,
(5) inflation rate above 10%, (6) no vesting for team tokens,
(7) single wallet holding >10% of circulating supply.

Token Data:
[PASTE ALL AVAILABLE TOKENOMICS DATA]
CoinXSight's ASI Score: Automated Tokenomics Evaluation
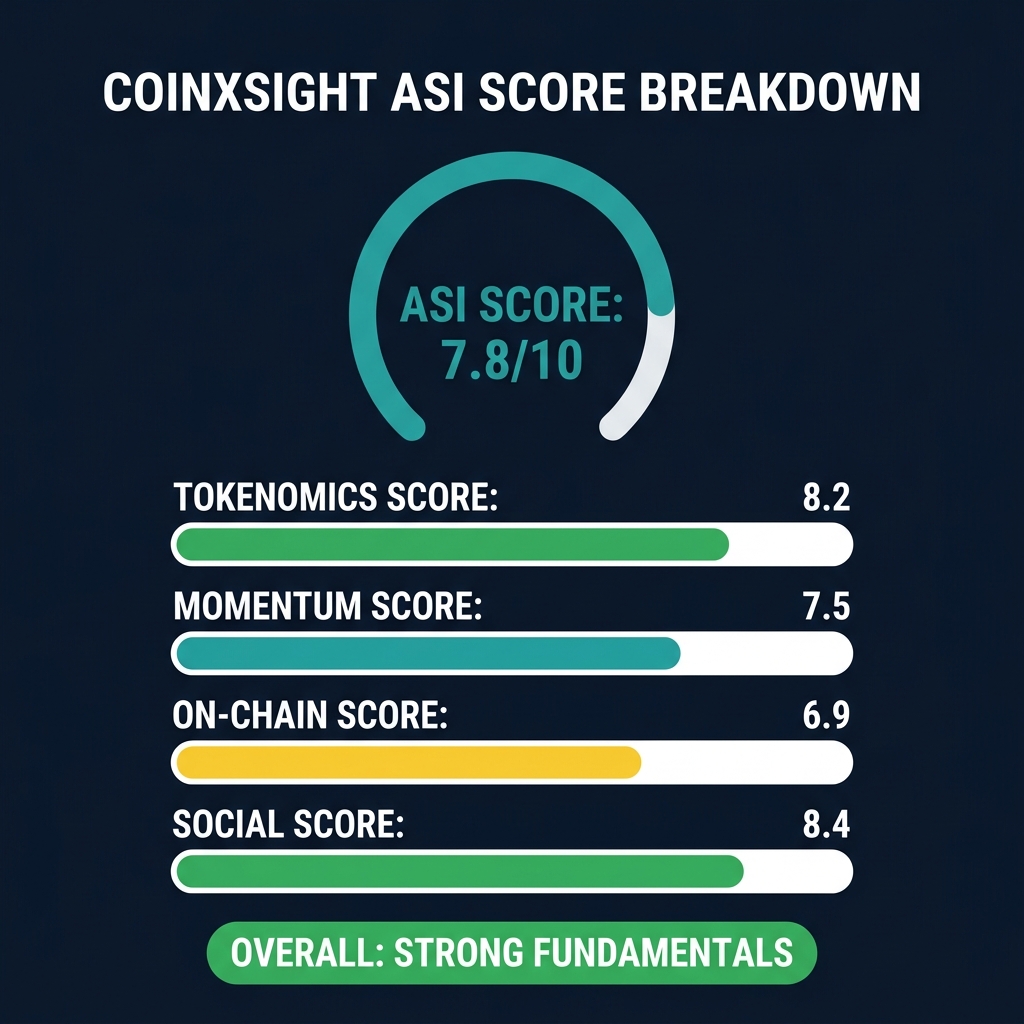
While ChatGPT prompts give you point-in-time analysis, CoinXSight's Alpha Signal Index (ASI Score) continuously evaluates tokenomics as one of its four scoring layers:
- Tokenomics Layer — Supply dynamics, FDV/MC ratio, unlock proximity, inflation rate
- Momentum Layer — RSI, MACD, StochRSI, MFI technical indicators
- On-Chain Layer — Whale activity, exchange flows, holder distribution
- Social Layer — Community growth, developer activity, sentiment
The ASI Score ranges from 0 to 10, with the Tokenomics Layer contributing roughly 25% of the total weight. A token with perfect momentum but terrible tokenomics (FDV/MC above 5×, cliff unlock imminent) will see its ASI Score capped — preventing you from entering a position that looks technically strong but has a supply bomb ticking underneath.
💡 On CoinXSight, you can filter the Deep Alpha screener by minimum ASI Score to automatically exclude tokens with poor tokenomics. Set the minimum to 6.0 for swing trades and 7.0 for longer holds to filter out high-dilution risks. This turns a 2-hour manual analysis into a 10-second filter operation on the crypto analytics platform.
The Tokenomics Red Flag Checklist
Seven warning signs that a token's supply structure works against holders. If a token triggers 3 or more of these, treat it as a short-term trade at best — not a hold.
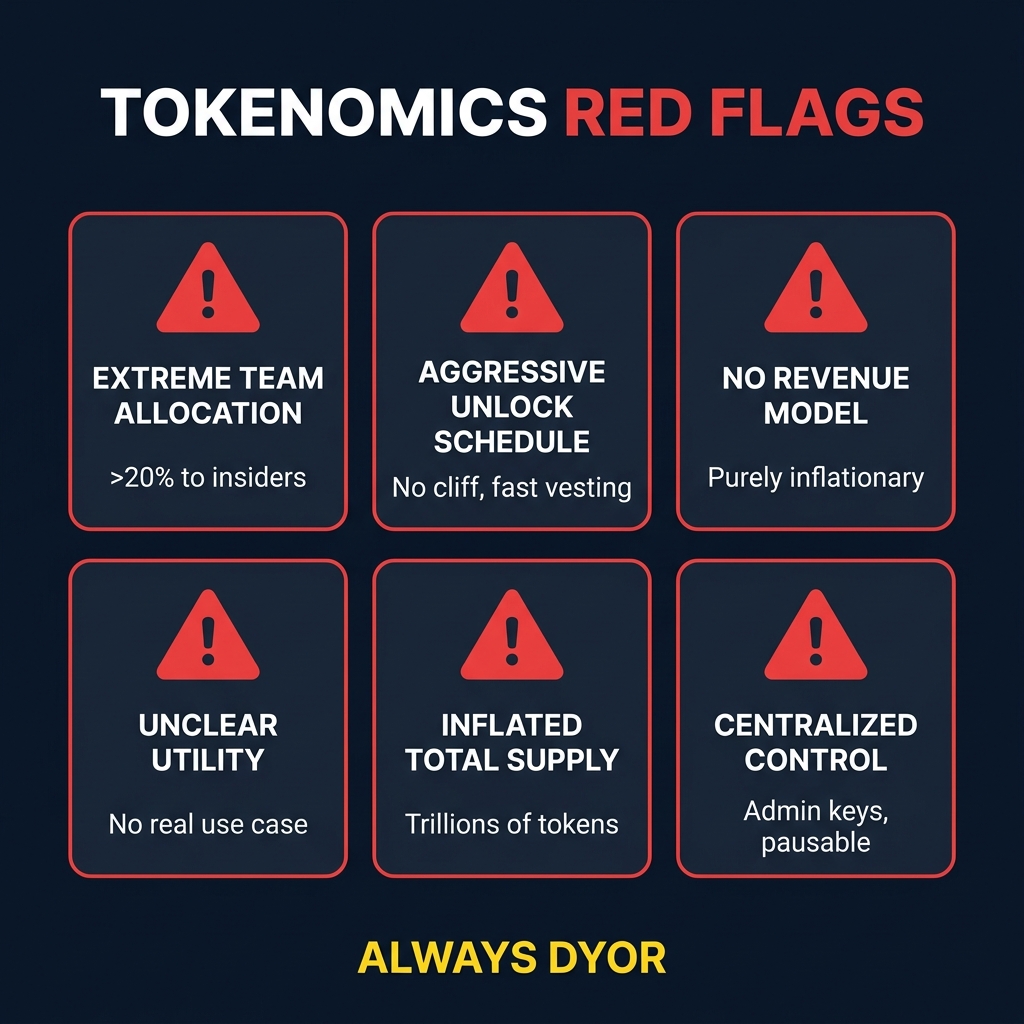
🚩 1. FDV/MC Ratio Above 5×
More than 80% of supply is locked. The current price reflects a tiny fraction of total tokens. Future unlocks will create massive sell pressure.
What to do: Check the unlock schedule. If major cliff events are within 90 days, avoid or size the position very small.
🚩 2. Team Allocation Above 25%
When the team controls more than a quarter of total supply, they have significant power to move the price. Even with vesting, 25%+ team allocation creates an asymmetric risk — team has more tokens to sell than the entire public float in some cases.
What to do: Verify the vesting schedule. Look for lock-ups of at least 12 months post-launch with 24-36 month linear vesting.
🚩 3. No Vesting or Short Vesting for Insiders
If team and investor tokens have no lock-up period, or vesting completes within 6 months of launch, insiders can dump immediately. Quality projects enforce 12-month cliffs followed by 24-48 month linear vesting.
What to do: If you can't find a vesting schedule, assume the worst.
🚩 4. Inflation Rate Above 10%
Double-digit annual inflation means the token's price must appreciate 10%+ per year just to break even. Most tokens can't sustain that level of demand growth, especially in bear markets.
What to do: Calculate the inflation rate manually. Check whether a burn mechanism offsets some emissions.
🚩 5. No Token Burn or Fee Mechanism
Without burns or fee sinks, all inflation is pure dilution. Compare this to ETH's EIP-1559 model, where transaction fee burns can reduce effective inflation to near zero or even negative during high-usage periods.
What to do: Read the token's documentation. Look for "burn," "buyback," or "fee distribution" mechanisms.
🚩 6. Single Wallet Holds 10%+ of Circulating Supply
One address controlling more than 10% of circulating supply creates dump risk. This could be the team (operating through an unlabeled wallet), an early investor, or a whale accumulator.
What to do: Use a blockchain explorer to check top holder distribution. CoinXSight's Whale Tracker module flags concentrated holdings automatically.
🚩 7. No Clear Token Utility Beyond Governance
If the only use case is "vote on proposals," there's no economic reason to buy and hold. Governance-only tokens tend to lose value over time because voting doesn't require holding — you can borrow governance tokens, vote, and return them.
What to do: Identify at least one demand sink that requires purchasing and holding the token (staking, fee payments, collateral).
How CoinXSight Deep Alpha Evaluates Tokenomics
CoinXSight's Deep Alpha module integrates tokenomics evaluation directly into its analysis pipeline, saving you from manual data gathering across multiple sites.
How to Use Deep Alpha for Tokenomics Evaluation
- Sign in at app.coinxsight.com
- Open the Deep Alpha module from the main navigation
- Search for any token (BTC, ETH, ARB, APT, etc.)
- Check the ASI Score panel — the Tokenomics Layer shows a sub-score from 0-10
- Click into the Tokenomics breakdown to see: FDV/MC ratio, upcoming unlocks, inflation rate, and utility assessment
- Use the screener to filter tokens by minimum Tokenomics Score — set to 6.0+ for a quick shortlist of tokens with healthy supply dynamics
Example — Screening for Low-Dilution Tokens on CoinXSight (June 2026)
Setting the Deep Alpha screener to filter for ASI Score ≥ 7.0 and Tokenomics Layer ≥ 6.5 returns tokens where most supply is already circulating, no major cliff unlocks are imminent, and inflation is below 5%. In testing this filter in early June 2026, it excluded tokens like newly launched L2 tokens with FDV/MC ratios above 8× while keeping established assets like ETH (FDV/MC ~1.0×) and BTC (FDV/MC = 1.0×). The filter saved hours of manual checking across the crypto portfolio tracker.
ASI Score + Tokenomics: What the Numbers Mean
| ASI Tokenomics Score | Interpretation | Action |
|---|---|---|
| 8.0 – 10.0 | Strong tokenomics — low inflation, most supply circulating, clear utility | Green light for holds |
| 6.0 – 7.9 | Moderate tokenomics — some dilution risk, but manageable | Acceptable for swing trades |
| 4.0 – 5.9 | Weak tokenomics — high FDV/MC, upcoming unlocks, elevated inflation | Trade with tight stops, small size |
| Below 4.0 | Poor tokenomics — multiple red flags active | Avoid or short-term scalp only |
The crypto analytics platform combines this score with momentum, on-chain, and social data. A token can have strong tokenomics but weak momentum (not time to buy yet) or strong momentum but weak tokenomics (buy for a quick trade, not a hold).
FAQ
What is the most important tokenomics metric for crypto traders?
The FDV/MC ratio. It reveals how much hidden dilution exists. A ratio above 3× signals significant future sell pressure from locked tokens, while a ratio near 1× means most supply is already circulating with minimal dilution risk.
How do token unlocks affect crypto prices?
Approximately 90% of token unlock events produce negative price pressure. Cliff unlocks (large one-time releases) cause the sharpest drops, especially when they exceed 2.4× the token's average daily trading volume. Selling often begins 30 days before the unlock date.
Can AI tools analyze crypto tokenomics automatically?
Yes. In 2026, you can paste vesting schedule data into ChatGPT or Gemini with specific prompts to calculate dilution risk, inflation rates, and FDV/MC ratios. CoinXSight's ASI Score automates this continuously across all tracked tokens in the Deep Alpha module.
How does CoinXSight evaluate tokenomics in its ASI Score?
CoinXSight's ASI Score includes a dedicated Tokenomics Layer that evaluates FDV/MC ratio, upcoming unlock proximity, annual inflation rate, and token utility. This layer contributes approximately 25% of the total ASI Score (0-10 scale), and it automatically downgrades tokens approaching major cliff unlock events.
What is a safe inflation rate for a cryptocurrency?
Most established chains maintain 1-5% annual inflation. Above 5% creates meaningful price headwinds, and above 10% requires exceptionally strong demand growth to sustain price. Deflationary tokens (0% or negative inflation via burns) have the most favorable supply dynamics for holders, according to Investopedia's tokenomics analysis.
Next steps:
- Token Unlock Trading Strategy — how to trade around unlock events
- AI Token Screening Guide — advanced AI prompts for token evaluation
- ASI Score Explained — full breakdown of CoinXSight's scoring system
- Crypto Risk Management — position sizing and portfolio protection
Disclaimer: This article is for educational and informational purposes only and does not constitute financial, investment, or trading advice. Cryptocurrency markets are highly volatile and involve substantial risk of loss. Always conduct your own research (DYOR) and consult a licensed financial advisor before making any investment decisions. Past performance does not guarantee future results. CoinXSight provides analytical tools and data — not investment recommendations. Mention of specific tokens does not constitute a buy or sell recommendation.