AI Explainability in Trading: Why You Should Never Trust a Black Box
Learn why AI explainability matters for crypto trading and how transparent signals help you trade smarter. Perfect for any crypto trading platform setup.
KZ
Dr. Kevin ZhangPrincipal AI & Quantitative Researcher·May 29, 2026 · 13 min read · Updated Oct 6
The Black Box Problem: Would You Take Medicine Without Reading the Label?
Imagine walking into a doctor's office with chest pain. The doctor glances at you, writes a prescription, and says: "Take this pill twice a day." No diagnosis. No explanation. Just a slip of paper and a wave toward the door.
You would not fill that prescription. No rational person would. Yet every single day, thousands of crypto traders do the equivalent — they follow AI-generated trading signals without the slightest understanding of WHY the AI recommended that trade.
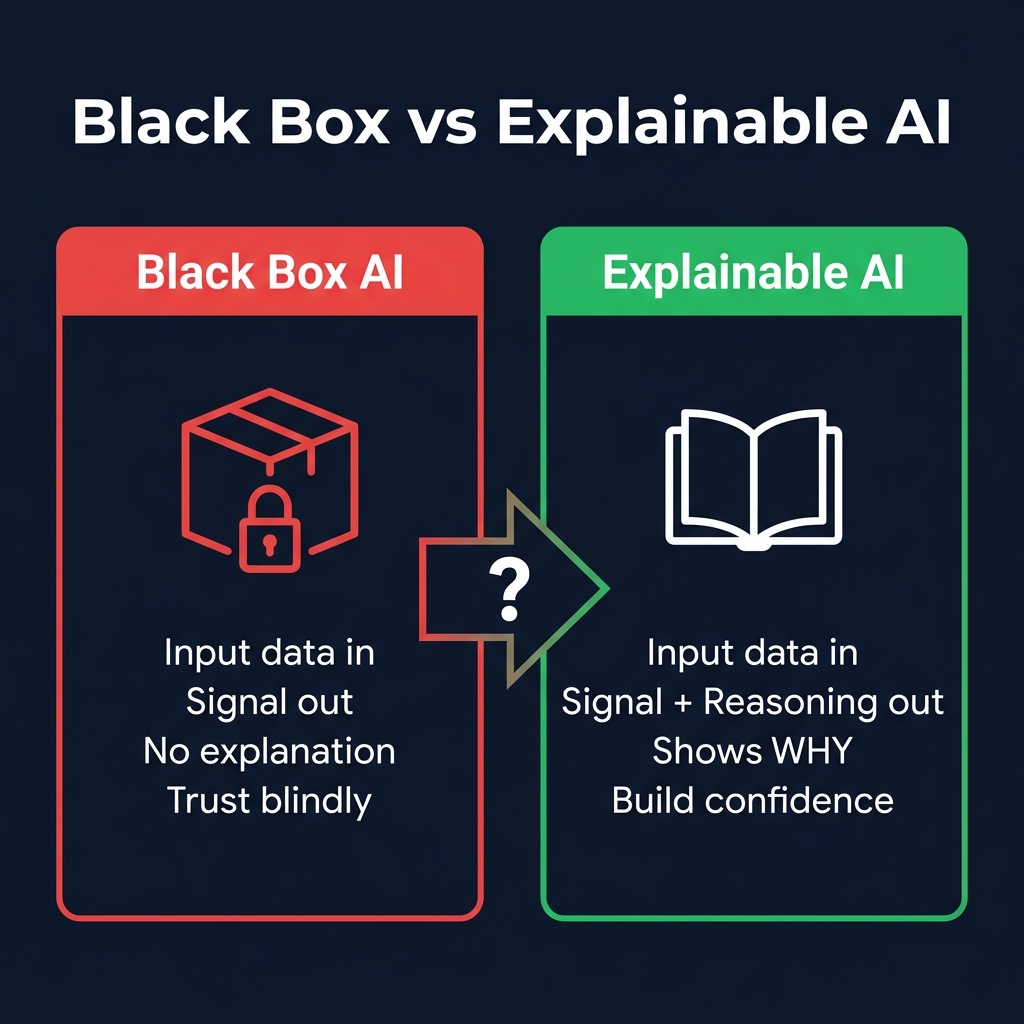
This is the black box problem. A black box (a system whose internal reasoning is hidden from the user) takes your data in, produces a signal out, and offers zero visibility into what happened in between. It tells you "Buy BTC" or "Sell ETH" but never explains its reasoning. In a market where a single poorly understood trade can wipe out weeks of gains, blindly trusting a black box is reckless.
The good doctor explains: "Your blood pressure is elevated. Your cholesterol shows high LDL. Combined with your family history, I'm recommending a statin — clinical evidence shows a 35% reduction in cardiac events for your risk profile." Same prescription. Vastly different trust level.
AI explainability in trading (also known as XAI, or Explainable AI) is the difference between the dismissive doctor and the thorough one. It is the practice of making AI trading systems transparent enough that you — the trader — can understand, verify, and ultimately trust the recommendations you receive.
This is not an abstract academic concern. When BTC dropped 6% in three hours during the May 12, 2026 flash correction — from $112,400 to $105,600 — traders using explainable AI knew exactly which factors had shifted and made informed decisions. Traders using black box tools saw signals flip from "BUY" to "SELL" with no context, panicked, and locked in losses at the bottom.
Understanding WHY matters as much as knowing WHAT to do.
Key Terms: Your AI Explainability Glossary
Before diving deeper, here is a quick reference for the terms you will encounter throughout this article. Understanding them puts you ahead of most retail traders.
Term
Simple Definition
Black Box
An AI system that produces outputs without revealing how it arrived at its conclusions. You see the result but not the reasoning
Explainability (XAI)
The ability of an AI system to show its work — making its decision-making process understandable to humans
Transparency
How openly an AI tool shares its methodology, data sources, and logic with users
Feature Importance
A ranking of which data inputs (price, volume, whale activity, etc.) had the most influence on a specific signal
Confidence Score
A numerical measure (typically 0-100) of how certain the AI is about its recommendation, based on how strongly the evidence aligns
Signal Attribution
A breakdown showing exactly how much each factor contributed to a trading signal, expressed as percentages
Model Bias
A systematic tendency in the AI's predictions — for example, always leaning bullish or consistently overweighting one data source
Overfitting
When an AI has memorized past data so precisely that it performs brilliantly on historical tests but fails on new, unseen market conditions
False Positive
A signal that says "trade opportunity detected" when no real opportunity exists — the AI cried wolf
You do not need to memorize these now. We will revisit each concept in context as we work through the article, and by the end, they will feel intuitive.
Why Explainability Matters for Every Crypto Trader
Understanding Why Explainability Matters for Every Crypto Trader is a key part of crypto technical analysis. Most professional trading indicators on any crypto trading platform will help you apply these concepts in real time.
AI explainability is not just a nice feature for data scientists and quants. It directly impacts four areas that determine whether you make or lose money.
Trust: Can You Follow a Signal You Do Not Understand?
Here is a psychological reality most AI trading platforms ignore: if you do not understand WHY a signal was generated, you will abandon it at the worst possible time.
Consider this scenario. An AI tells you to buy SOL at $174. SOL drops to $168. Without explanation, you panic-sell — then watch SOL rally to $189 over the next five days.
Now replay that with an explainable AI that told you: "Buy SOL — 40% exchange outflow acceleration, 25% volume breakout, 20% whale accumulation at $170-175, 15% RSI divergence on 4H. Confidence: 74/100." When SOL dips, you check: outflows still accelerating, whales holding, volume elevated. Thesis intact. You hold. You capture the move.
Same signal. Same price action. Completely different outcome — because explainability gave you conviction to hold through a temporary drawdown.
Risk Management: Knowing WHY Helps You Size Positions
Not all bullish signals are created equal. A "Buy BTC" signal driven by a single factor — say, a short-term RSI oversold reading — warrants a very different position size than a "Buy BTC" signal driven by five converging factors across technical, on-chain, and sentiment data.
Without explainability, every signal looks the same. With it, you can calibrate your risk:
Signal Strength
Factors Behind It
Appropriate Position Size
Single-factor signal
Only one indicator triggered (e.g., RSI bounce)
Small position (0.5-1% risk)
Multi-factor signal
2-3 indicators agree (e.g., RSI + volume spike)
Standard position (1-2% risk)
Full confluence signal
4+ factors across multiple data categories align
Full position (2-3% risk)
Traders who use explainable AI naturally practice better risk management because they can match their conviction level to their position size. Black box users cannot do this — every signal feels equally uncertain, which leads to either chronic under-sizing (leaving money on the table) or reckless over-sizing (blowing up on low-quality signals).
Learning: Understanding Signals Makes You a Better Trader
Every explained signal is a free lesson. When the AI tells you "BTC is bullish because exchange reserves hit a 2-year low while active addresses are surging," you are learning on-chain analysis in real time. Over months, this transforms you from a signal follower into an informed trader who recognizes patterns before the AI flags them.
Black box tools teach you nothing. A year of following "BUY / SELL" signals leaves you exactly where you started.
Debugging: When Things Go Wrong, You Need to Know Why
Every trading system has losing streaks. The critical question is whether those losses reflect normal variance or a fundamental model problem.
With an explainable AI, you can investigate. Five losing signals in a row? Perhaps all five were heavily weighted toward a single on-chain metric temporarily distorted by a large exchange migration — a temporary issue. Or perhaps the AI has been overweighting social sentiment during a low-volatility regime where sentiment is unreliable — a deeper problem worth flagging.
Without explainability, you cannot distinguish between the two. That uncertainty leads to either abandoning a good tool too early or staying with a broken one too long.
Explainable vs. Black Box: Real Scenario Comparison
"Thesis intact: outflows accelerating +22%, whales holding. Drop attributed to BTC correlation. Confidence adjusted 72 to 65 — hold with original stop"
AI signal loses money
"Signal was: BUY. Result: loss."
"Post-trade: Signal was 45% driven by bot-inflated social sentiment. Volume and on-chain were neutral. Lesson: reduce sizing when single factor exceeds 40%"
Market regime changes
Old signals stop working, no explanation
"Regime shift detected. Down-weighting momentum (accuracy dropped to 44% in range conditions), increasing on-chain accumulation weight"
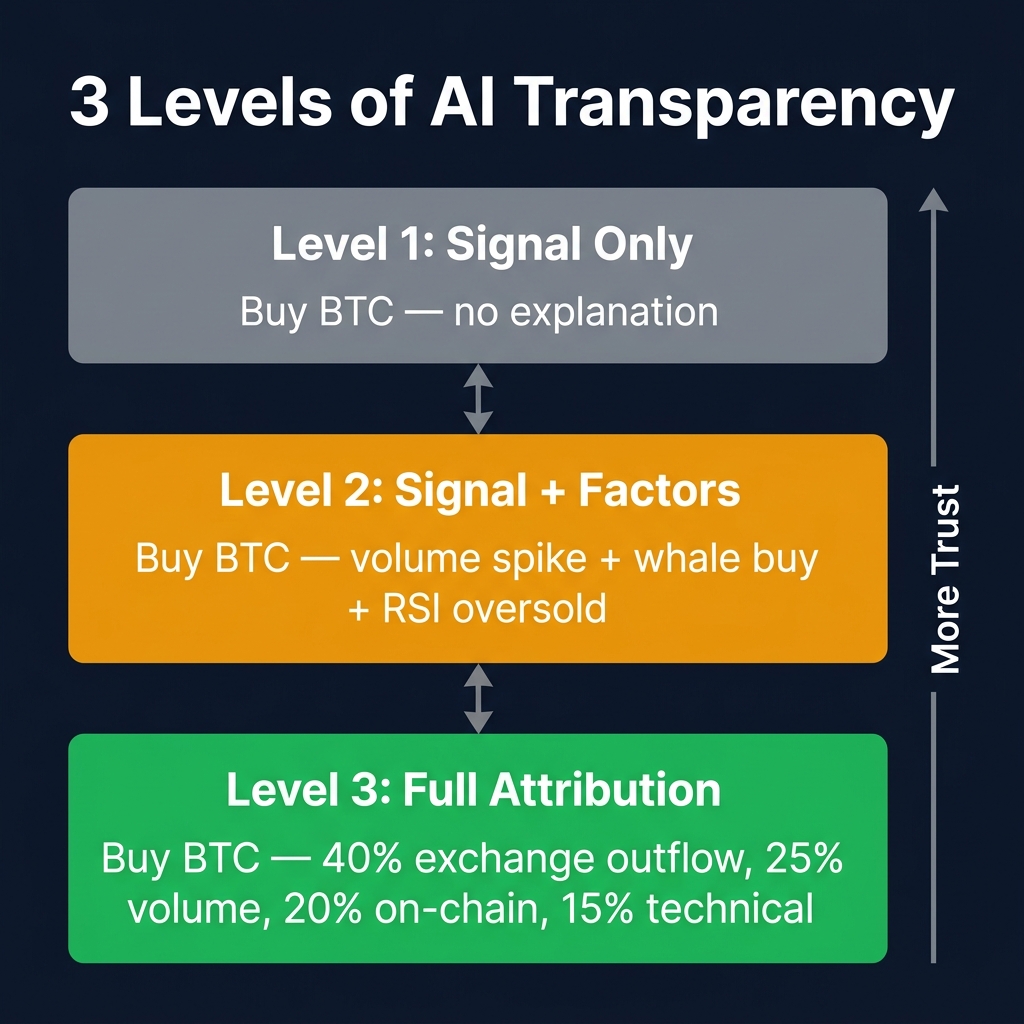
The 3 Levels of AI Transparency
Not all "AI-powered" trading tools offer the same depth of explanation. Understanding where your tool falls on the transparency spectrum tells you how much to trust it — and how much to risk on its signals.
Level 1: Signal Only — "Buy BTC"
This is the lowest level of transparency and, unfortunately, where most AI trading tools in 2026 still operate. You receive a direction (BUY or SELL), maybe a target price, and nothing else.
What it feels like: A stranger on the internet telling you what to trade. No credentials, no reasoning, no track record.
The problem: You have no way to evaluate signal quality, no way to size your position intelligently, and no way to learn from the outcome. You are completely dependent on the tool and completely blind to its logic.
Example: "BUY BTC. Target: $115,000."
Level 2: Signal + Factors — "Buy BTC Because…"
A meaningful improvement. The AI tells you what to do AND identifies the key factors behind the recommendation, though you may not know exactly how much each contributed.
What it feels like: A knowledgeable friend explaining their trade thesis — useful, but you are taking their word on how they weighted the evidence.
Example: "BUY BTC — volume spike above 20-day average, whale wallets accumulating on Binance and Coinbase, RSI oversold bounce on 4H, positive news sentiment shift."
Level 3: Full Attribution — "Buy BTC: Here Is Exactly How Much Each Factor Matters"
This is the gold standard for AI explainability in trading. The tool tells you WHAT, WHY, and EXACTLY HOW MUCH each factor contributed, as weighted percentages.
What it feels like: A senior analyst presenting a sourced research report. You can verify every claim and make a fully informed decision.
The benefit: You can spot when a signal relies on a single dominant factor (riskier) versus being broadly distributed across independent sources (more robust).
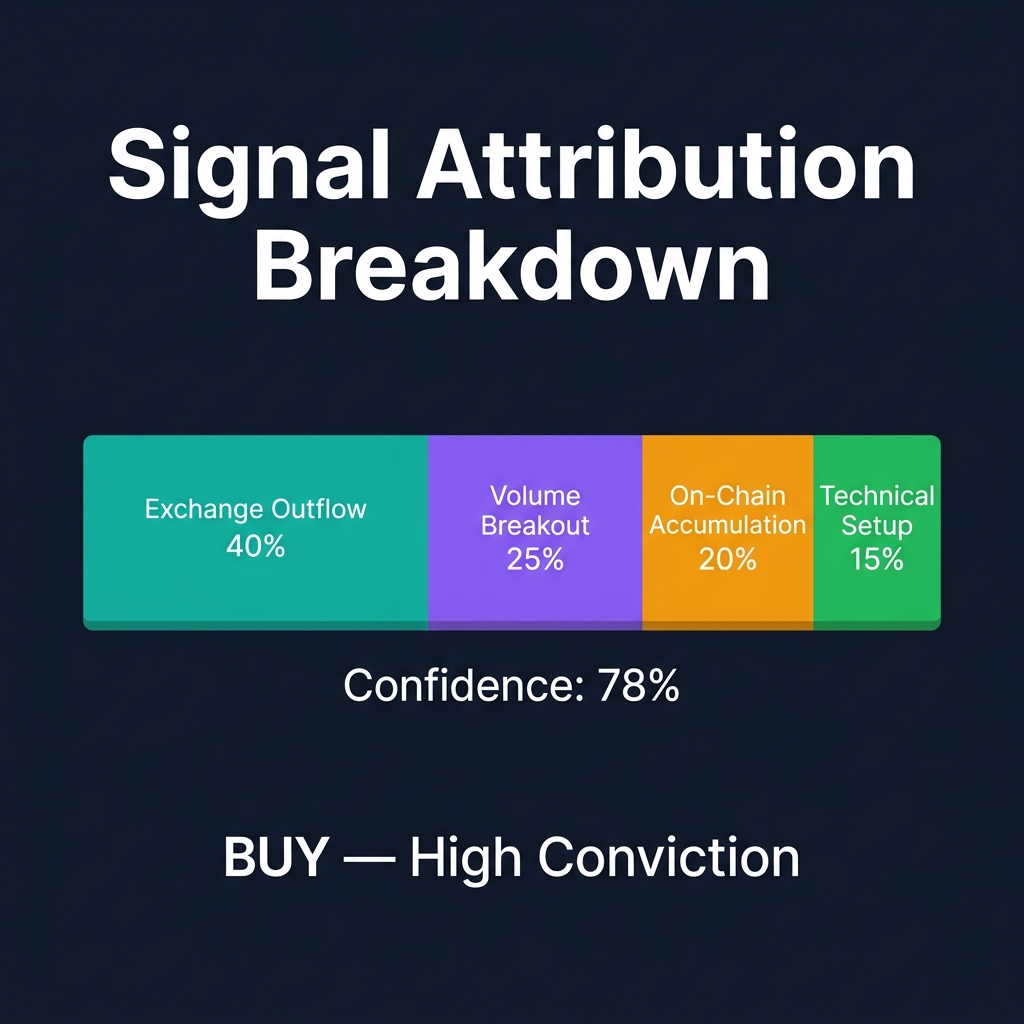
Example: "BUY BTC (Confidence: 78/100) — 35% exchange outflow acceleration (14,200 BTC net outflows over 7 days), 25% volume breakout (2.4x average on hourly), 22% on-chain accumulation (addresses holding 100+ BTC up by 340 this week), 18% technical setup (bullish engulfing at $107,800 with EMA confluence)."
Which Level Should You Demand?
Transparency Level
Best For
Not Suitable For
Level 1 (Signal Only)
Casual hobbyists who trade tiny amounts for fun
Anyone risking serious capital or trying to learn
Level 2 (Signal + Factors)
Intermediate traders who want to understand the thesis
Traders who need to precisely calibrate position sizing
Level 3 (Full Attribution)
Serious traders, portfolio managers, anyone risking meaningful capital
No one — this level benefits everyone. If the tool offers it, use it
If you are reading this article, you should demand at minimum Level 2 from every AI tool you use. Ideally, Level 3. Anything less means trading partially blind, and in crypto, that gets expensive fast.
How Explainable AI Works — Without the Technical Jargon
You do not need a computer science degree to understand how explainable AI produces its signals. The core concepts are intuitive once you connect them to everyday analogies.
Feature Importance: The Recipe Analogy
Think of an AI trading signal like a recipe. A chocolate cake has many ingredients, but not all contribute equally. Cocoa and sugar dominate the taste. Flour provides structure. Vanilla is a subtle accent.
Feature importance (a ranking of which inputs mattered most to a specific AI decision) works the same way. When the AI produces a bullish BTC signal, feature importance tells you which "ingredients" drove it:
Factor (Feature)
Importance Rank
Analogy
Exchange outflow acceleration
1st (dominant)
Cocoa — the defining ingredient
Volume breakout
2nd
Sugar — strong supporting role
Whale accumulation
3rd
Butter — adds richness and depth
Technical pattern
4th
Flour — structural, subtle
Sentiment shift
5th
Vanilla — minor contribution
If exchange outflows suddenly reverse, the entire signal is in jeopardy — just as removing cocoa turns your chocolate cake into a vanilla sponge. But if sentiment shifts slightly while everything else holds, the signal remains intact.
Signal Attribution: The Sports Team Analogy
Feature importance tells you who the star players are. Signal attribution (the exact percentage each factor contributed) tells you how many points each player scored — like a basketball box score showing exactly who carried the team.
Here is what a fully attributed BTC signal might look like in late May 2026:
Contributing Factor
Attribution Weight
Current Reading
Exchange net outflows
35%
-11,800 BTC over 7 days — strong accumulation signal
Spot volume breakout
25%
2.1x 20-day average volume on the daily candle
Whale wallet accumulation
22%
280 new addresses holding 10+ BTC created this week
Technical confluence
18%
Price holding above 50-day EMA with bullish MACD cross on daily
Total
100%
Confidence: 76/100
With this breakdown, you can set an alert for when the dominant factor (outflows, 35%) reverses — that is your early warning. You also know this is primarily an on-chain play, not a chart-pattern play, and can manage it accordingly.
Confidence Scoring: The Weather Forecast Analogy
When the forecast says "80% chance of rain," you bring an umbrella — but you understand there is a 20% chance you carry it for nothing. AI confidence scores (a numerical measure of how certain the model is about its recommendation) work identically. A score of 78/100 means: in historical scenarios that looked similar to the current one, prices moved favorably about 78% of the time. Powerful edge — but 22% of the time, the trade goes against you. The confidence score tells you how much umbrella to bring, not whether it will definitely rain.
Confidence Score
Historical Win Rate
Position Sizing Guidance
80-100
~70-78% profitable
Full position (2-3% risk)
65-79
~60-70% profitable
Standard position (1.5-2% risk)
50-64
~52-60% profitable
Reduced position (0.5-1% risk)
Below 50
Below coin-flip odds
No trade — wait for better setup
Counterfactual Reasoning: The "What If" Question
The most advanced form of explainability answers: "What would need to change for this signal to flip?"
This is counterfactual reasoning (exploring hypothetical scenarios where one or more inputs are different). A fully explainable AI tells you: "This signal flips to NEUTRAL if exchange outflows reverse to net inflows of +5,000 BTC. It flips to SELL if whale wallets distribute while volume drops below the 20-day average." This gives you a precise checklist of conditions to monitor rather than vaguely "watching the market."
Red Flags: 8 Warning Signs of Untrustworthy AI Signals
Not every tool calling itself "AI-powered" deserves your trust. Here are eight warning signs to watch for.
Warning Sign
What It Looks Like
Why It Is Dangerous
No explanation provided
Signal says "BUY" with no factors, no reasoning, no context
You cannot evaluate quality, learn from outcomes, or manage risk appropriately
Claimed accuracy above 80%
Marketing page promises "85% win rate" or "90% accurate signals"
Even the best hedge funds in the world achieve 55-65% accuracy. Claims above 80% indicate overfitting or cherry-picked results
No losing trades shown
Track record only displays winners. Losing trades are absent or hidden
Every legitimate strategy has losers. Hiding them is deceptive and prevents you from assessing true risk
Constant high confidence
Every single signal is "HIGH CONFIDENCE" or above 80/100
A calibrated model should regularly produce NEUTRAL and LOW confidence readings. If it is always confident, confidence means nothing
No regime acknowledgment
Tool never mentions market conditions or adjusts for volatility changes
Markets cycle between trending, ranging, and volatile regimes. A model that ignores this is brittle and likely to fail during transitions
Vague methodology
"Proprietary algorithm" or "advanced AI" with no specifics about what data it analyzes
Legitimate tools are transparent about their data sources and general methodology. Secrecy is often a cover for simplicity
No historical drawdowns
Performance charts show smooth upward curves with no significant dips
Real trading performance is lumpy. Smooth equity curves are almost always simulated or backfitted
Immediate upsell pressure
Free signals are terrible, and the tool heavily pushes paid tiers before proving value
Quality tools demonstrate value first. If the free experience is intentionally degraded to force upgrades, the paid version often disappoints too
If you encounter three or more of these red flags, walk away. Transparent alternatives exist.
How to Evaluate Any AI Trading Tool for Transparency
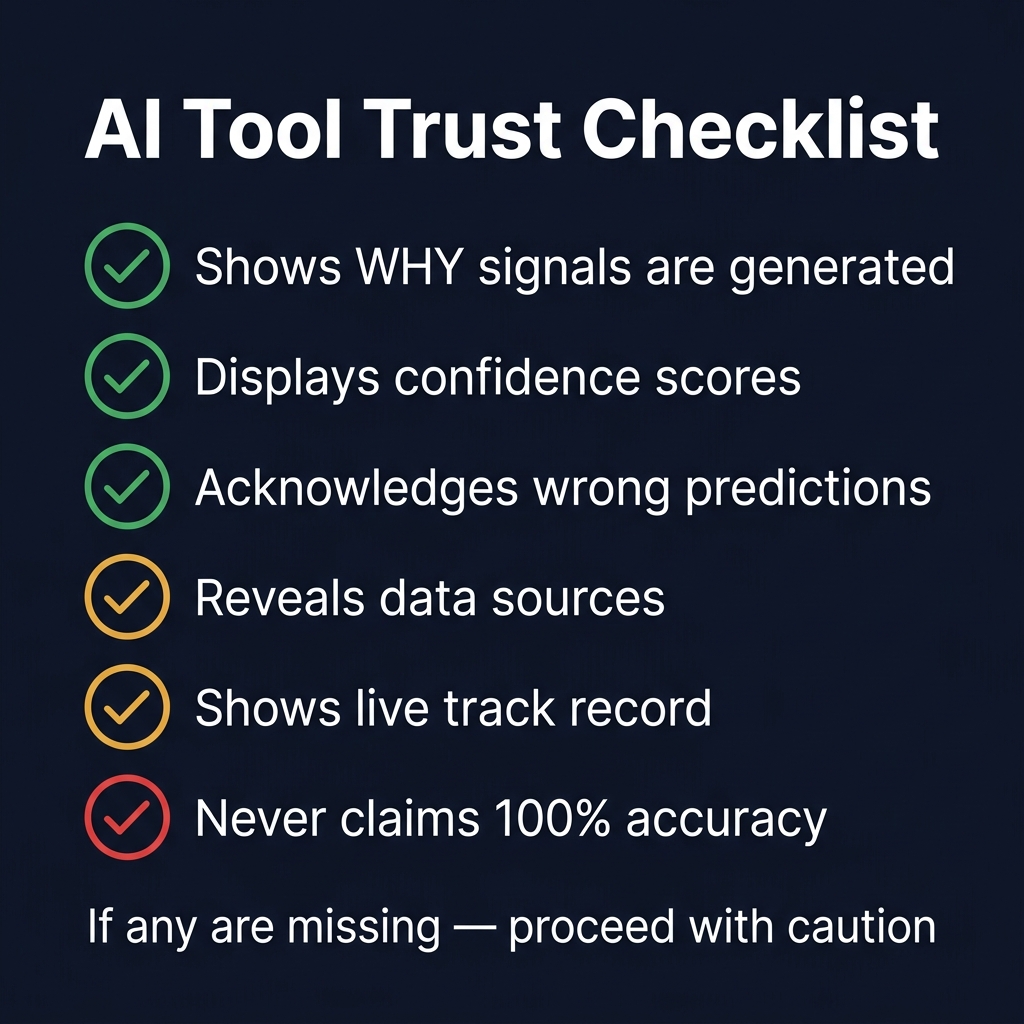
Before committing real capital to any AI trading system, run it through this evaluation checklist.
The 10-Question Transparency Checklist
1. Does it explain WHY it generated each signal? Not just "BUY BTC" but the specific factors that drove the recommendation.
2. Can you see which data sources it uses? The more diverse and clearly stated — technical, on-chain, volume, sentiment — the better.
3. Does it show confidence levels that actually vary? A tool that produces NEUTRAL readings when data is mixed is better calibrated than one always screaming "HIGH CONFIDENCE."
4. Does it publish both winning AND losing trades? A 58% win rate with honest drawdowns is far more trustworthy than 87% accuracy with no losses shown.
5. Does it acknowledge different market regimes? One-size-fits-all models break during regime transitions. The tool should adapt to trending, ranging, and volatile environments.
6. Can you verify its claims independently? If it says "whale accumulation is driving this signal," can you check that on a blockchain explorer? Verifiable data beats invisible proprietary metrics.
7. Does it disclose its limitations? Every model has blind spots. An honest tool says so. Tools that claim no limitations are lying.
8. How does it handle being wrong? Does it offer post-trade analysis after losses, or do losing signals vanish from the record?
9. Does it offer a free tier that demonstrates real value? You should be able to evaluate signal quality before paying.
10. Is there a clear methodology description? "We use AI" is not a methodology. "We combine 12 data sources through a multi-layer scoring model with walk-forward validation" is.
Score any tool against this checklist. Tools scoring 8-10 deserve your attention and potentially your capital. Tools scoring 4-7 need further investigation. Tools scoring below 4 should be avoided regardless of how impressive their marketing looks.
How CoinXSight Provides Explainable AI Signals
CoinXSight was built on the principle that traders deserve to understand every signal. Here is how each module delivers Level 3 transparency.
ASI Score: Four Layers, Fully Visible
The ASI Score is not a single mysterious number. It is a composite of four clearly defined layers, each visible and verifiable:
Exchange flows, whale movements, active addresses, smart money tracking
79/100 — Net exchange outflows of 11,800 BTC in 7 days, whale wallets adding positions
Sentiment Layer
News tone, social momentum, cross-asset flows, market fear/greed
62/100 — Moderately positive news flow, social volume elevated but not euphoric
Combined ASI
Weighted composite of all four layers
74/100 — Bullish
You can see exactly which layers are strong and which are lagging. If Technical reads 81 but Sentiment is only 62, the bullish case is driven by price structure and on-chain data, not crowd enthusiasm — often a healthier foundation for a trade.
Confluence Scoring: Full Factor Attribution
The Confluence Scoring system takes explainability even further by showing you the precise weight each data source carries in a specific signal.
Here is a sample Confluence breakdown for an actual ETH setup in May 2026:
ETH Signal: BUY (Confluence Score: 71/100)
Factor
Weight
Current Status
Exchange reserve decline
28%
ETH exchange reserves dropped 4.2% over 14 days — sustained accumulation
Volume breakout confirmation
24%
Daily volume at 2.1x 20-day average, buy-side dominant
Technical momentum
21%
Price reclaimed $2,700 resistance, now acting as support. RSI at 58, room to run
Whale wallet activity
16%
12 wallets holding 10,000+ ETH added to positions in past 72 hours
Cross-asset correlation
11%
ETH/BTC ratio rising, indicating relative strength vs. Bitcoin
This tells you the signal is diversified across five independent factors (robust), no single factor exceeds 30% (no fragile dependency), and the weakest factor could reverse without materially impacting the thesis.
AI Analysis: Plain-Language Reasoning
CoinXSight's AI Analysis module goes beyond numbers and scores. It provides plain-language explanations of its market assessment — which factors matter most right now, what risks to watch, and what would need to change for the thesis to break. This is counterfactual reasoning delivered in plain English, accessible to any trader regardless of technical background.
Why This Approach Builds Trust
The combination of scored layers (ASI), weighted attribution (Confluence), and narrative reasoning (AI Analysis) means you always know:
WHAT the signal is (direction and conviction)
WHY the signal exists (which factors are driving it)
HOW MUCH each factor matters (weighted percentages)
WHAT COULD GO WRONG (which factors to monitor for reversal)
This is Level 3 transparency across every token, every timeframe, and every signal. No black boxes. No "trust me" hand-waving.
AI explainability is not a luxury feature — it is a fundamental requirement for any trader risking real capital on AI-generated signals. Transparent tools that show you the WHY behind every signal empower you to size positions intelligently, hold through normal drawdowns, learn from every outcome, and identify when something breaks. In crypto, understanding is your edge. Never trust a system that asks for your capital but refuses to show its reasoning. Demand transparency. Demand attribution. Demand explainability.
Principal AI & Quantitative Researcher·Deep Alpha Engine Labs
Ph.D. in Computational Statistics. Leads machine learning architecture, regime-switching detection, and automated execution systems at CoinXSight Labs.
QUANTITATIVE SUITE // DEEP ALPHA ENGINEACTIVE
BTC/USDT // LIVE SCANNER
CONFLUENCE 80
LIVE SPOT PRICE$82,245.93MODERATE_SELL
TP2
$72,558.06
+-12.20%
TP1
$78,605.39
+-4.88%
ENTRY
$82,636.95
ZONE
SL
$84,652.73
2.44%
Auto-detect Order Blocks, Fair Value Gaps and risk-adjusted DCA ladders in < 5s.