Futures Trading and AI: Why This Combination Changes Everything
Crypto futures markets now account for over 75% of all trading volume across major exchanges. In May 2026, with BTC trading near $111,000 and perpetual futures volume regularly exceeding $80 billion per day, the derivatives market dwarfs spot trading by a wide margin. Yet most retail traders approach futures with little more than a price chart and a gut feeling about leverage.
That is a recipe for getting liquidated.
Think of AI in futures trading like a weather radar system. A farmer can look at the sky and guess whether rain is coming, but a meteorologist with Doppler radar sees the storm cells forming 200 miles away, tracks their speed, and predicts exactly when and where they will hit. AI does the same for derivatives markets. It scans funding rates across every exchange simultaneously, maps liquidation clusters at specific price levels, tracks open interest shifts in real time, and synthesizes all of that into actionable signals before the storm arrives.
This article breaks down the four pillars of AI-powered futures trading: funding rate arbitrage, liquidation map analysis, open interest intelligence, and leverage optimization. You do not need to be a developer or a quant to use these strategies. You need to understand what the data means and how AI interprets it faster and more accurately than any human can.
Funding Rates Explained Simply
Before diving into AI strategies, you need a clear understanding of what funding rates actually are and why they exist.
Perpetual futures contracts have no expiration date. Unlike traditional futures that settle on a specific date, perpetual contracts (or "perps") can be held indefinitely. This creates a problem: without an expiration forcing convergence, the perpetual price could drift far away from the actual spot price of the asset.
Funding rates solve this problem. They are periodic payments exchanged between long and short traders, typically every eight hours, that act as a tether keeping the perpetual price anchored to spot.
When the funding rate is positive, the perpetual price is trading above spot. Longs pay shorts. This is the market's way of saying: "Too many people are betting on price going up, so longs must pay a fee to shorts to discourage one-sided positioning."
When the funding rate is negative, the perpetual price is trading below spot. Shorts pay longs. The market is overly bearish, and shorts pay a fee to bring the balance back.
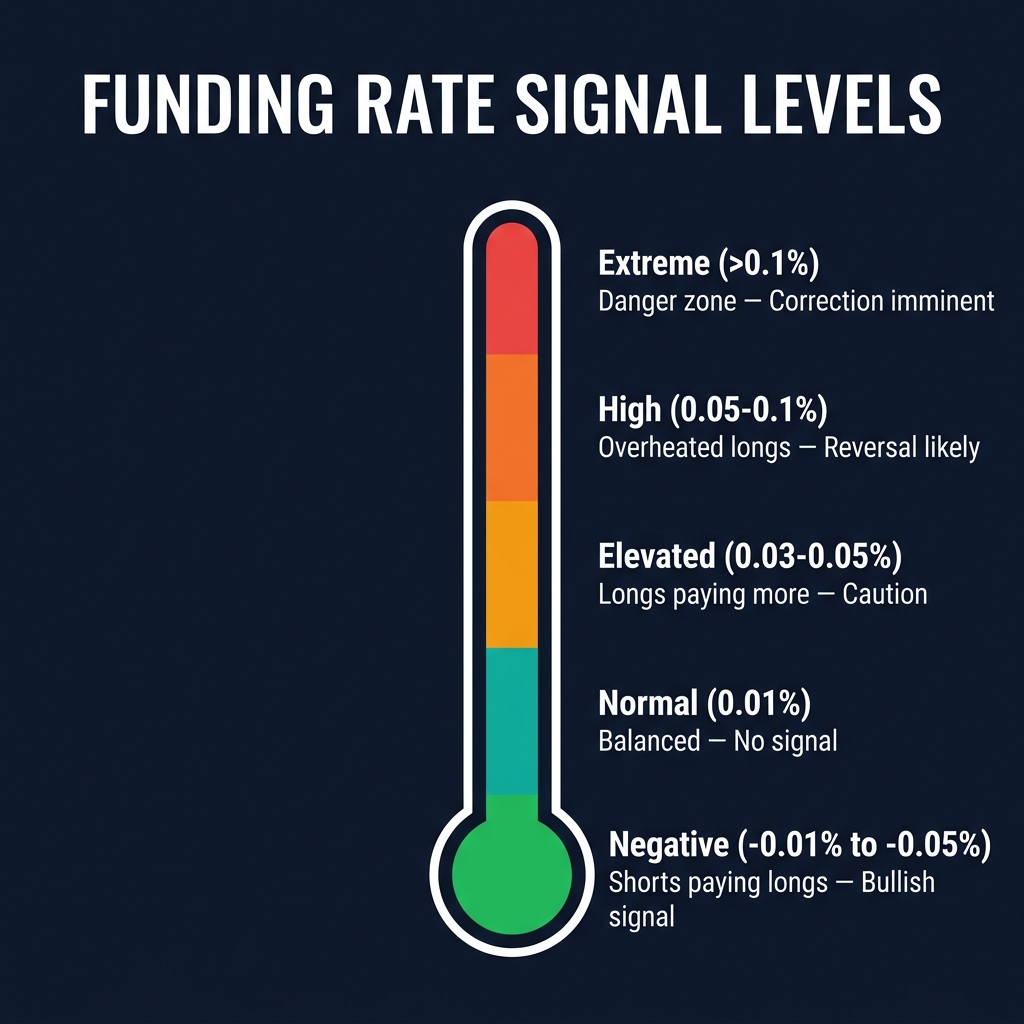
The standard baseline funding rate on most exchanges is 0.01% per eight-hour period, which annualizes to roughly 10.95%. But during strong trends or euphoric/panic conditions, funding rates can spike dramatically.
Here is how to interpret different funding rate levels:
Funding Rate (8h)
Annualized Rate
Market Condition
What It Signals
-0.05% to -0.01%
-18% to -3.6%
Bearish lean
Shorts are crowded; potential short squeeze setup
-0.01% to 0.00%
-3.6% to 0%
Mild bearish
Slight short dominance, relatively balanced
0.00% to 0.01%
0% to 10.95%
Neutral / Normal
Balanced market, no strong directional bias
0.01% to 0.03%
10.95% to 32.8%
Bullish lean
Healthy long interest, trend likely intact
0.03% to 0.05%
32.8% to 54.7%
Elevated bullish
Getting crowded on the long side, caution warranted
0.05% to 0.10%
54.7% to 109%
Extreme bullish
Overheated; longs paying heavy premium, reversal risk rising
> 0.10%
> 109%
Euphoria / Blow-off
Very high reversal probability, unsustainable cost to hold longs
In mid-May 2026, when BTC surged past $108,000 on its way to new all-time highs above $111,000, funding rates on major exchanges briefly touched 0.08% to 0.12% per eight hours. Traders holding leveraged long positions were paying annualized rates exceeding 100% just to maintain their exposure. That kind of cost is unsustainable, and the market corrected within days as overleveraged longs were shaken out.
AI Funding Rate Strategies
Understanding AI Funding Rate Strategies is a key part of crypto technical analysis. Most professional trading indicators on any crypto trading platform will help you apply these concepts in real time.
Understanding funding rates is one thing. Building profitable strategies around them is another. AI excels here because it can monitor funding rates across dozens of exchanges and hundreds of trading pairs simultaneously, identify divergences, and execute strategies at speeds no human can match.
Cash-and-Carry Arbitrage: The Low-Risk Income Machine
Cash-and-carry arbitrage is one of the most reliable strategies in crypto derivatives, and AI makes it significantly more efficient.
The concept is straightforward. When funding rates are high and positive, you simultaneously buy the asset on the spot market and open a short position of the same size on the perpetual futures market. Your net exposure to price movement is zero because the spot long and the futures short cancel each other out. But you collect the funding rate payments every eight hours because you are on the short side.
Here is a real-world example from May 2026:
SOL Cash-and-Carry Setup (May 14-21, 2026)
SOL spot price: $178
SOL perpetual funding rate: 0.065% per 8 hours (annualized ~71%)
Position size: 500 SOL ($89,000 notional)
Duration held: 7 days (21 funding periods)
Funding income per period: $89,000 x 0.065% = $57.85
Total funding collected over 7 days: $57.85 x 21 = $1,214.85
Annualized return: approximately 71%
The AI advantage in cash-and-carry is threefold. First, AI identifies the optimal entry point by scanning funding rates across Binance, Bybit, OKX, dYdX, and other venues to find the highest and most stable rates. Second, AI monitors for rate decay, alerting you when funding begins normalizing so you can unwind the position before the income stream dries up. Third, AI accounts for the basis spread (the difference between futures and spot prices) to calculate your true yield after all costs.
Without AI, a trader might check funding rates on one or two exchanges manually. With AI scanning the entire market, you capture the best opportunities as they emerge.
Contrarian Funding Rate Signals: Trading the Extremes
Extreme funding rates are among the most reliable mean-reversion signals in crypto. When funding spikes to unsustainable levels, it almost always reverts, often violently.
AI uses historical funding rate data to establish statistical boundaries. When rates cross into the 95th or 99th percentile of historical readings, the probability of a reversal increases dramatically. The system does not just look at the absolute level of funding. It analyzes:
Rate of change: How quickly funding spiked (a sudden jump is more significant than a gradual climb)
Duration at extreme levels: Rates that stay extreme for multiple funding periods indicate deeper conviction, which means the eventual unwind will be more violent
Cross-exchange divergence: If funding is extreme on one exchange but moderate on others, it may be a localized effect rather than a market-wide signal
Correlation with spot volume: Extreme funding paired with declining spot volume is a stronger reversal signal than extreme funding with rising volume
During the BTC rally in May 2026, AI systems flagged funding rates above 0.10% on May 15 as a contrarian sell signal. BTC was trading at approximately $104,500 at the time. Within 72 hours, funding rate normalization triggered a cascade of long liquidations, and price briefly dipped below $102,000 before resuming the uptrend. Traders who used the AI contrarian signal to reduce long exposure or open hedging shorts preserved significant capital during that drawdown.
Funding Rate Momentum: Riding the Trend
Not every funding rate signal is contrarian. When funding rates are positive and rising gradually within the normal-to-elevated range (0.01% to 0.04%), it often confirms a healthy trend.
AI tracks what is called "funding rate momentum": the slope and consistency of funding rate changes over time. A steadily increasing funding rate from 0.01% to 0.03% over several days suggests growing but controlled long interest. This is the kind of trend you want to ride, not fade.
The key distinction AI makes is between healthy trend confirmation and overheated euphoria. As long as funding stays below extreme thresholds and rises at a measured pace, the signal supports trend continuation. The moment funding accelerates parabolically or crosses into extreme territory, the AI switches from trend-following to reversal-watching mode.
Liquidation Maps: Reading the Battlefield
If funding rates are the temperature of the market, liquidation maps are the terrain. Understanding where liquidation clusters sit gives you a strategic advantage that most retail traders completely ignore.
What Liquidation Cascades Are
A liquidation cascade is the domino effect of forced position closures. When the price of an asset hits the liquidation level of a leveraged position, the exchange forcibly closes that position by executing a market order in the opposite direction. That market order pushes the price further in the same direction, which triggers more liquidations at the next price level, which pushes the price further still.
Think of it like a row of dominoes standing on a hillside. Knocking over the first one does not just topple the next one. Gravity accelerates the process, and by the end, dominoes are falling far faster than at the start. In markets, this gravity is leverage. The higher the leverage used by the positions being liquidated, the faster and more violently the cascade unfolds.
In May 2026, multiple liquidation cascades occurred as BTC pushed through the $105,000 to $112,000 range. On a single day, over $600 million in long positions were liquidated across exchanges during a 4% pullback that happened in under two hours. Many of those liquidations were concentrated at predictable price levels, levels that AI had identified in advance.
How AI Predicts Liquidation Clusters
AI builds liquidation maps by aggregating data from multiple sources:
Exchange-reported open interest by price level: This shows where positions are concentrated
Estimated liquidation prices based on typical leverage ratios: If most retail traders use 10x to 25x leverage, AI can calculate where their liquidation triggers sit relative to their likely entry prices
Historical liquidation data: Patterns repeat because human behavior repeats. Traders tend to cluster entries at round numbers, moving averages, and previous support/resistance levels
Order book depth analysis: Thin liquidity at certain price levels means liquidation cascades through those zones will be faster and more violent
The result is a heat map of vulnerability. Dense clusters of estimated liquidation points glow red on the map, showing you exactly where the market is most fragile.
Using Liquidation Intelligence to Your Advantage
There are three practical ways to use AI-generated liquidation maps:
Avoid the crowd. If you see a dense cluster of long liquidations sitting at $105,000 and BTC is currently at $107,500, you know that a dip to that level will likely trigger a cascade. Setting your own stop-loss at $105,100 means you will get stopped out right as the cascade begins, guaranteeing a bad fill. Instead, either set your stop well below the cluster (accepting more risk per trade but avoiding the cascade) or reduce position size so you can withstand the volatility.
Trade the liquidation bounce. Liquidation cascades often overshoot fair value because the forced selling is mechanical, not rational. AI can identify when a cascade is exhausting itself by monitoring the rate of new liquidations and order book absorption. The point where liquidation volume drops sharply and limit buy orders begin absorbing the selling pressure is often an excellent entry for a bounce trade. These "liquidation sweeps" followed by sharp reversals are some of the highest-probability setups in crypto futures.
Position ahead of known triggers. When AI identifies a large cluster of short liquidations above the current price, it signals that a push higher will be amplified by forced short covering. If other confluence factors align (rising OI, healthy funding, strong spot buying), this creates a high-conviction directional trade.
Open Interest Analysis with AI
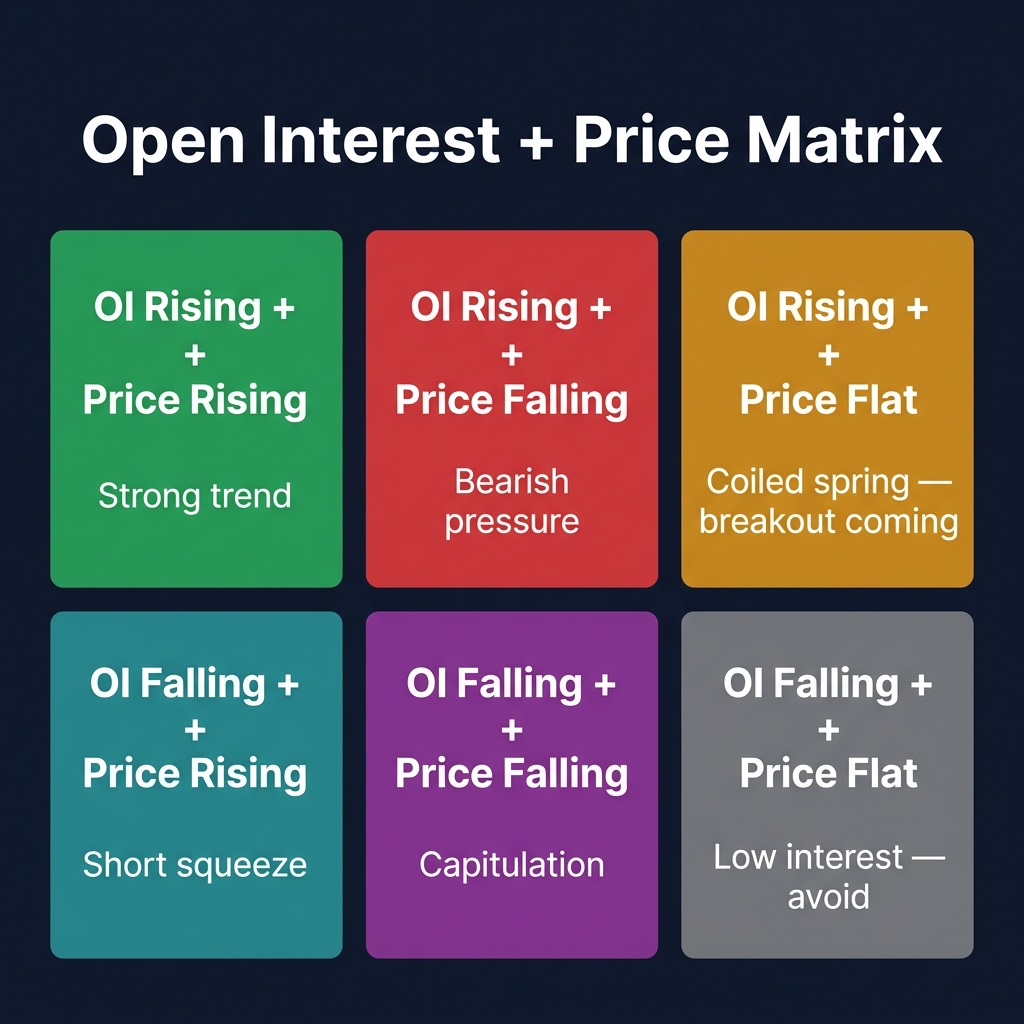
Open interest (OI) is the total number of outstanding futures contracts that have not been settled. It measures the total amount of money committed to the futures market for a given asset. When a new long and a new short enter the market, OI increases by one contract. When an existing long and an existing short close their positions against each other, OI decreases by one contract.
On its own, OI tells you about market participation. Combined with price movement, it tells you a story.
OI Direction
Price Direction
Volume
Interpretation
AI Signal
Rising
Rising
High
New money entering long side. Strong bullish trend confirmation.
Trend continuation likely. AI increases confidence in long setups.
Rising
Falling
High
New money entering short side. Strong bearish pressure building.
Downtrend likely to continue. AI flags caution for longs.
Rising
Flat/Sideways
Any
Positions accumulating before a breakout. Coiled spring effect.
Squeeze incoming. AI monitors for directional trigger.
Falling
Rising
Low-Moderate
Short covering rally. Shorts closing positions, not new longs entering.
Weak rally. AI warns that move may not sustain.
Falling
Falling
Low-Moderate
Long capitulation. Existing longs exiting at a loss.
Selling pressure may be exhausting. Watch for bottom signals.
Falling
Flat/Sideways
Low
Market losing interest. Positions unwinding without conviction.
Low-volatility environment. AI reduces position sizing signals.
The most powerful OI signal is the "coiled spring" scenario: OI rising significantly while price remains range-bound. This means traders are building large positions in both directions, but the price has not yet resolved which side wins. When it does break, the losing side gets liquidated, amplifying the move.
AI monitors this coiled spring setup by tracking the ratio of OI growth to price volatility. When OI expands rapidly but realized volatility compresses, the system flags a high-probability breakout setup. It does not predict the direction of the breakout. Instead, it identifies that a large move is imminent and prepares signals for whichever direction triggers first.
Real-world example from May 2026: Between May 8 and May 12, ETH open interest grew by 18% while ETH price stayed pinned between $2,680 and $2,740. AI flagged this as a coiled spring setup on May 10. On May 13, ETH broke above $2,740 with conviction, triggering a cascade of short liquidations that pushed the price to $2,850 within 24 hours. Traders who were positioned for the breakout based on the OI signal captured a 4% move in a single day.
Multi-Asset OI Divergence
Advanced AI systems do not just track OI for a single asset. They monitor OI flows across the entire derivatives market to identify rotational patterns.
When BTC open interest is declining while altcoin OI is surging, it signals a risk-on rotation where traders are moving into higher-beta assets. When OI contracts across the board, it signals broad deleveraging, often a precursor to either a market bottom (if prices have already fallen) or a volatility compression (if prices are stable).
AI tracks these cross-asset OI flows in real time and generates a "derivatives heat map" showing where speculative interest is concentrating. This helps futures traders identify which assets are likely to have the most explosive moves in the near term.
AI Leverage Optimization: How Much Is Too Much
Leverage is the tool that makes futures trading both lucrative and dangerous. Most retail traders use far too much of it.
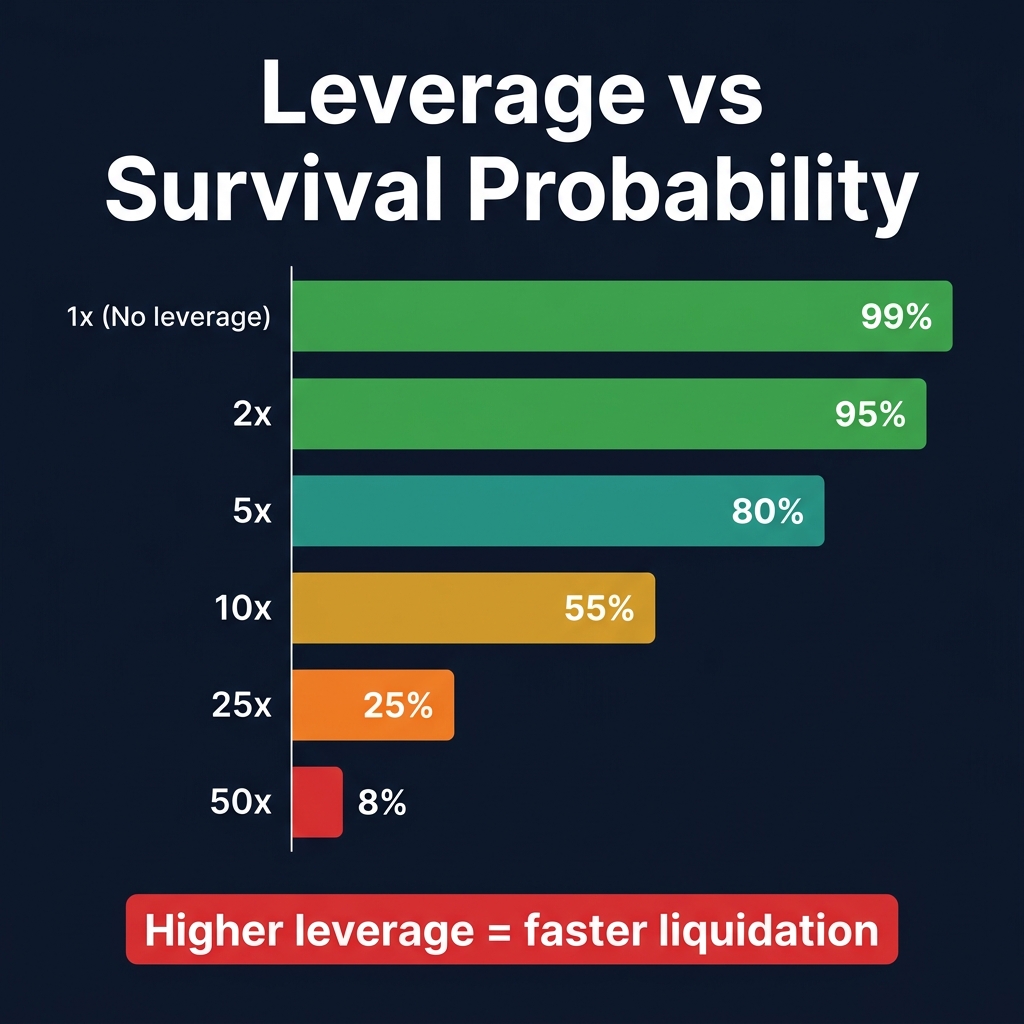
The math is unforgiving. At 10x leverage, a 10% move against you wipes out your entire position. At 25x, it only takes a 4% adverse move. At 50x, a mere 2% fluctuation triggers liquidation. In a market where 5% daily swings are routine, high leverage is not bold trading. It is a countdown to zero.
Leverage Used
Liquidation Distance
Survival Over 100 Trades
Annualized Cost of Funding (at 0.03% rate)
AI Recommendation
2x
50% adverse move
~98%
~32.8% of margin
Conservative, suitable for swing trades
3x
33% adverse move
~95%
~32.8% of margin
Balanced risk for multi-day holds
5x
20% adverse move
~82%
~32.8% of margin
Maximum for most retail traders
10x
10% adverse move
~55%
~32.8% of margin
High risk, intraday only
20x
5% adverse move
~25%
~32.8% of margin
Extremely risky, not recommended
50x
2% adverse move
~5%
~32.8% of margin
Near-certain ruin over time
100x
1% adverse move
<1%
~32.8% of margin
Gambling, not trading
The survival probabilities above assume typical crypto volatility conditions and standard risk management. Your actual results depend on your entry timing, stop-loss discipline, and market conditions. But the pattern is clear: survival probability drops exponentially as leverage increases.
The Kelly Criterion in Plain Language
Professional traders and AI systems use something called the Kelly Criterion to determine optimal position sizing. In plain language, the Kelly Criterion answers a simple question: "Given my win rate and my average win size relative to my average loss size, how much of my capital should I risk on each trade to maximize long-term growth?"
The answer is almost always less than traders expect.
If you have a strategy that wins 55% of the time with a 1:1 reward-to-risk ratio, the Kelly Criterion says you should risk roughly 10% of your capital per trade. That translates to using about 2x to 3x leverage with appropriate stop-losses, not the 20x or 50x that many retail traders default to.
AI applies the Kelly Criterion dynamically. As market conditions change, so does the optimal leverage:
Low volatility, strong trend, high-conviction signal: AI might suggest 3x to 5x leverage
Normal volatility, moderate-conviction signal: AI suggests 2x to 3x leverage
High volatility, mixed signals: AI reduces to 1x or suggests no futures position at all
Extreme volatility event (liquidation cascade, black swan): AI signals cash or heavily hedged positions only
The key insight is that optimal leverage is not a fixed number. It changes with market conditions, and AI recalculates it continuously based on real-time volatility, funding rates, OI data, and signal confidence.
The Risk Per Trade Framework
Beyond leverage, AI enforces a disciplined risk-per-trade framework. The rule is simple: never risk more than 1% to 2% of your total trading capital on a single trade. Leverage is then calibrated to fit within that risk budget.
For example, if you have $50,000 in trading capital and your maximum risk per trade is 1% ($500), and your stop-loss is 3% from entry, then your maximum position size is $16,667. On a $50,000 account, that is roughly 0.33x notional exposure. Not 10x. Not 20x. A third of your account.
This feels conservative. It is supposed to. Professional futures traders survive because they size positions based on risk, not on how much leverage the exchange allows.
AI automates this calculation and adjusts it in real time based on current volatility. If volatility doubles, AI automatically halves the suggested position size to maintain the same risk budget.
Five Futures Trading Mistakes AI Helps You Avoid
1. Overleveraging in High-Volatility Environments
The most common cause of futures trading losses is using too much leverage at exactly the wrong time. When BTC is moving 5% per day, traders who are accustomed to 2% daily ranges keep their leverage the same, not realizing their liquidation risk has more than doubled. AI continuously monitors realized and implied volatility and adjusts leverage recommendations accordingly.
2. Ignoring Funding Rate Costs
A trader who opens a 10x long position when funding rates are at 0.08% per eight hours is paying an annualized cost of roughly 87% of their margin. Even if the trade is directionally correct, the funding costs can eat the profit entirely. AI tracks cumulative funding exposure and alerts you when holding costs are eroding your edge, recommending either a switch to spot exposure or a move to an exchange with lower funding rates.
3. Chasing Into Liquidation Cascades
When the market drops sharply, many traders see "cheap prices" and try to catch the falling knife. But if the drop is a liquidation cascade with more clusters below, buying into it means buying into continued forced selling. AI identifies whether a price drop is organic selling or a mechanical liquidation event and advises staying on the sidelines until the cascade exhausts itself.
4. Fighting the Open Interest Trend
When OI is rising and price is falling, the market is telling you that new short positions are being opened with conviction. Fighting this by going long is trading against the weight of new money entering the market. AI reads the OI-price relationship and warns against taking positions that contradict the prevailing flow of capital.
5. Running Unhedged Concentrated Positions
Futures make hedging easy, yet most retail traders never hedge. A trader who is 100% long BTC futures with no hedge has maximum exposure to every downtick. AI suggests hedging strategies based on portfolio risk, such as pairing a long BTC futures position with a short altcoin futures position when altcoins are showing relative weakness. This reduces net market exposure while maintaining directional upside.
CoinXSight integrates derivatives data directly into its analytics platform, giving futures traders a consolidated view of the data that drives derivatives markets.
Funding Rate Monitoring: CoinXSight tracks funding rates across major exchanges and flags when rates enter extreme territory. The platform highlights divergences between exchanges, helping you identify the best venues for cash-and-carry trades or contrarian setups.
Open Interest Analysis: The platform monitors OI changes across all tracked assets and correlates them with price action to identify coiled spring setups, short covering rallies, and long capitulation events. When OI patterns align with other signals, the alert priority increases.
ASI Score for Futures Timing: The proprietary AI Sentiment Index (ASI) score synthesizes social sentiment, on-chain data, and derivatives metrics into a single confidence signal. For futures traders, a high ASI score combined with healthy funding rates and rising OI provides a multi-factor confirmation that is far more reliable than any single indicator.
Risk Management Integration: CoinXSight's risk tools help you calculate optimal position sizes based on your account balance, risk tolerance, and current market volatility. Learn more about the platform's risk capabilities in our crypto risk management guide.
The Five-Step Futures Workflow with CoinXSight:
Step
Action
CoinXSight Tool
1. Scan
Identify assets with unusual funding rates or OI shifts
Chart Pro dashboard with derivatives overlay
2. Analyze
Check OI-price relationship and liquidation map context
AI market analysis and ASI score
3. Size
Calculate optimal leverage and position size for your risk budget
Risk management module
4. Execute
Enter the trade with pre-defined stop and target levels
Track funding costs, OI changes, and liquidation proximity in real time
Alert system and portfolio tracker
The CoinXSight anomaly detection system also plays a role in futures trading by flagging unusual spikes in OI, funding rates, or liquidation volumes that may indicate whale activity or coordinated market moves.
Futures markets represent the largest and most active segment of crypto trading, and AI transforms them from a high-risk leverage casino into a structured, data-driven arena. By using AI to monitor funding rates for arbitrage and contrarian signals, map liquidation clusters to avoid cascades and trade bounces, analyze open interest for trend confirmation and squeeze setups, and optimize leverage to survive and compound over the long term, traders gain a systematic edge over the emotional, overleveraged majority. The tools exist. The data is available. The question is whether you will use them or continue trading derivatives on instinct alone. Start building your AI-powered futures workflow today at CoinXSight.
KZ
Dr. Kevin Zhang
AI // QUANT LABS
Principal AI & Quantitative Researcher·Deep Alpha Engine Labs
Ph.D. in Computational Statistics. Leads machine learning architecture, regime-switching detection, and automated execution systems at CoinXSight Labs.
QUANTITATIVE SUITE // DEEP ALPHA ENGINEACTIVE
BTC/USDT // LIVE SCANNER
CONFLUENCE 81
LIVE SPOT PRICE$82,384.73MODERATE_SELL
TP2
$72,279.50
+-12.53%
TP1
$78,493.97
+-5.01%
ENTRY
$82,636.95
ZONE
SL
$84,708.44
2.51%
Auto-detect Order Blocks, Fair Value Gaps and risk-adjusted DCA ladders in < 5s.
Master AI-driven crypto risk management — position sizing formulas, stop loss strategies, and portfolio protection with CoinXSight. Essential crypto technical…
Master risk management for crypto trading. Learn position sizing formulas, stop-loss strategies, and how CoinXSight's Portfolio module tracks your risk…