AI Analysis Module: Step-by-Step Walkthrough of CoinXSight’s Intelligence Engine
A practical walkthrough of CoinXSight's AI Analysis module — learn how to navigate each panel, interpret the interface, and run a complete AI-powered token analysis from search to trade decision.
CB
Chloe BennettMarket Intelligence & Narrative Lead·Mar 10, 2026 · 10 min read · Updated Oct 6
The AI Analysis module is your direct interface to CoinXSight's intelligence engine. While other modules like the Dashboard and Alpha Hunter surface AI insights automatically, the Analysis module lets you actively query any cryptocurrency and receive a comprehensive AI evaluation on demand.
Think of it as having a conversation with the AI: you ask "What do you think about BTC right now?" and the engine responds with a structured analysis covering technical patterns, on-chain activity, sentiment data, and volume dynamics — all synthesized into an actionable recommendation.
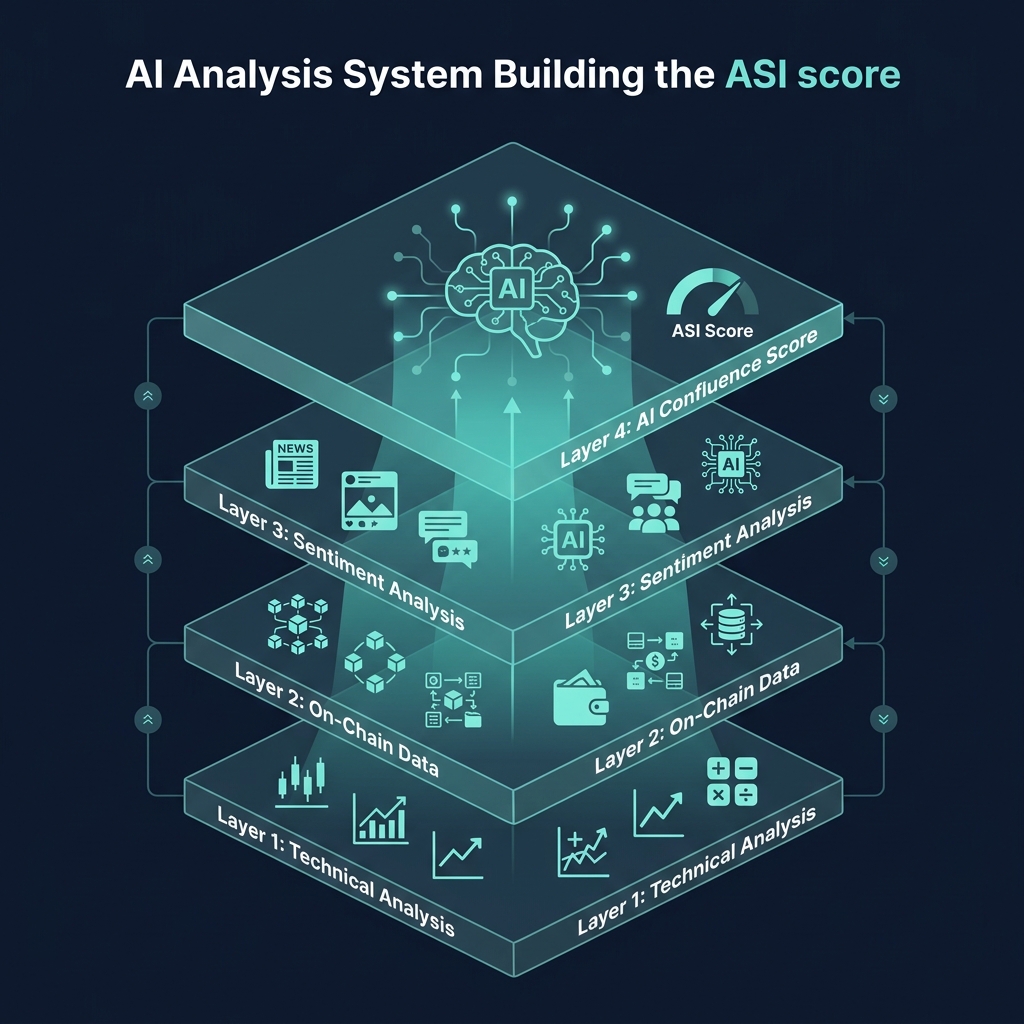
The module produces an ASI (AI Scoring Index) score for every token — a composite confidence rating from 0 to 100. For a deep dive into how the ASI scoring algorithm works, including its 4-layer architecture, weighting logic, and false signal analysis, see the dedicated ASI Score Explained guide.
This article focuses on the practical side: how to navigate the module's interface, what each panel means, and how to run a complete analysis workflow.
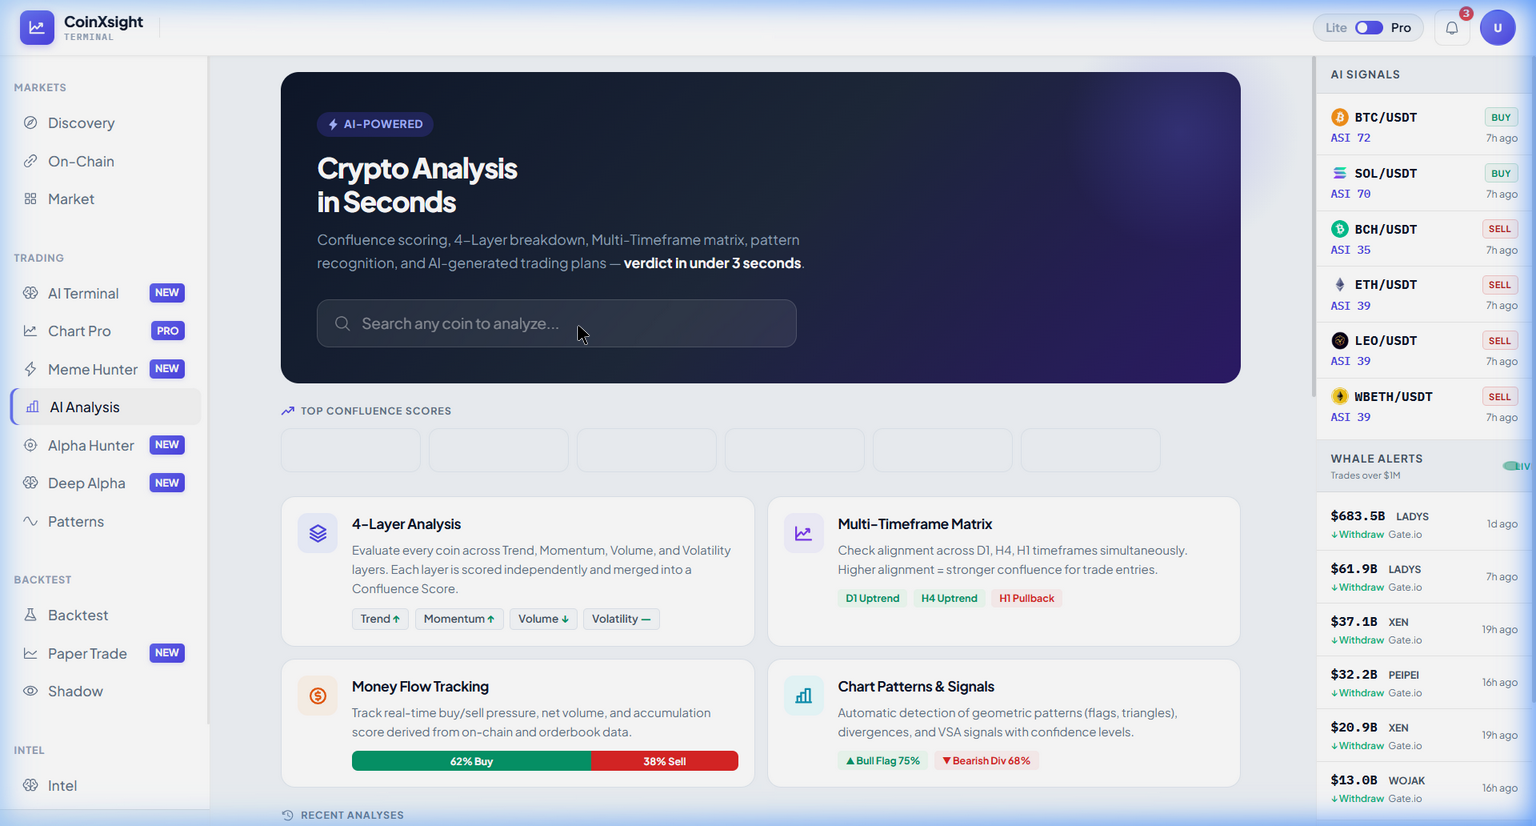
Click "AI Analysis" in the left sidebar navigation
You will see the main analysis dashboard with a search bar at the top
The Search Bar
The search bar accepts:
Token symbols: BTC, ETH, SOL, AVAX
Token names: Bitcoin, Ethereum, Solana
Trading pairs: BTC/USDT, ETH/USDT
Type any token and press Enter to load its full analysis page. The AI begins processing immediately — most results appear within 2-3 seconds.
The Analysis Result Page — Panel by Panel
When you analyze a token, the result page displays several interconnected panels. Here is what each one shows:
Panel 1: The ASI Score Header
The header is the first thing you see — it contains the most critical information:
Element
What It Shows
How to Read It
ASI Score
The composite AI confidence number (0-100)
Higher = more bullish conviction. See score ranges
Direction Label
BUY, SELL, or HOLD
The AI's recommended action based on the score
Confidence Band
How tightly the 4 scoring layers agree
Tight band = high confidence; wide band = mixed signals
Last Updated
Timestamp of the most recent calculation
Scores recalculate every 5 minutes for active tokens
Quick read: If the ASI shows 75+ with a BUY label and tight confidence band — the AI has high conviction. If it shows 50 with a HOLD label and wide band — the layers disagree and there is no clear edge.
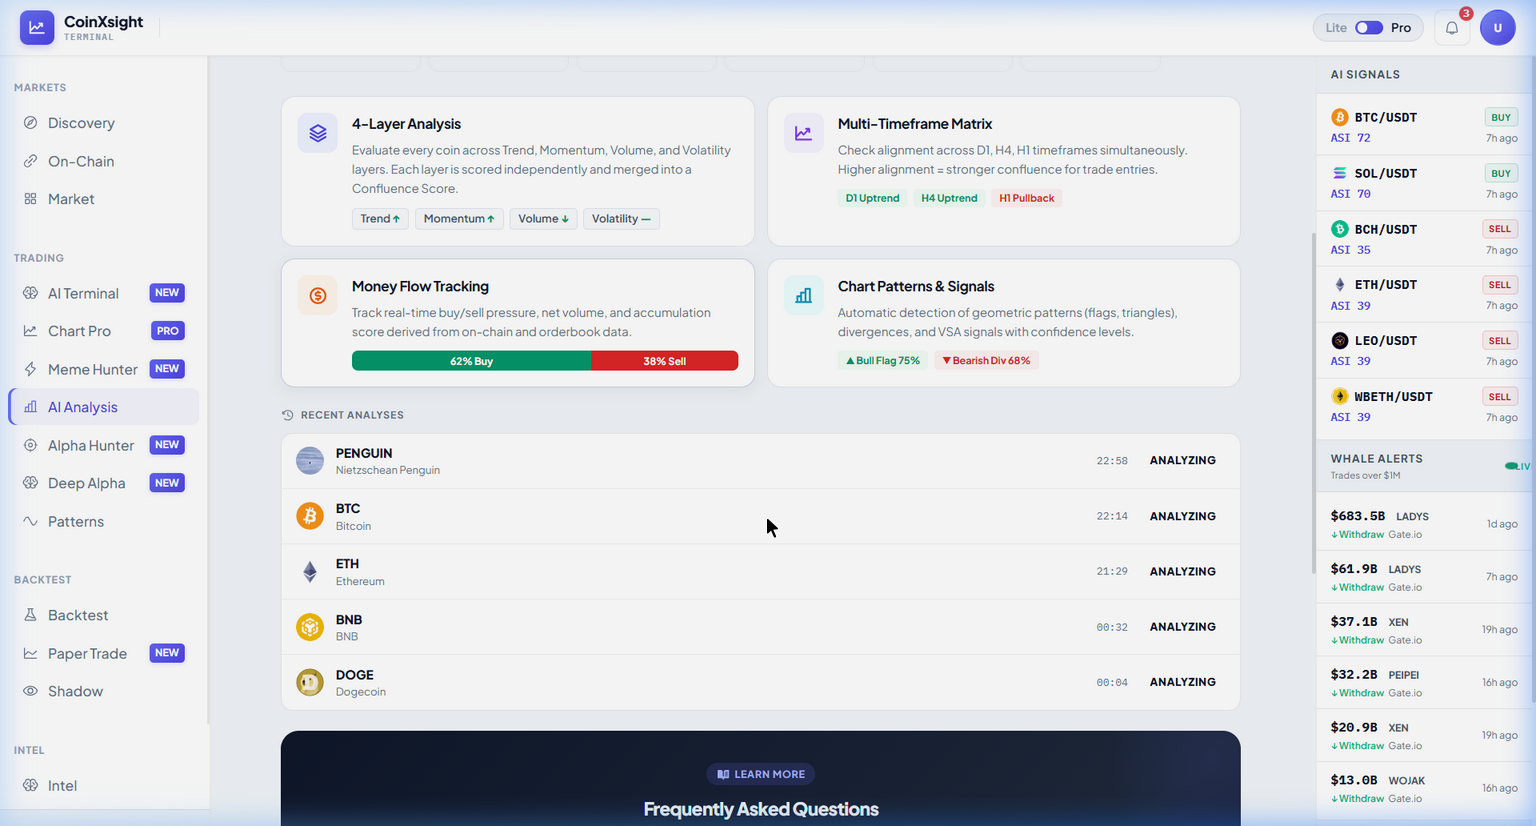
Panel 2: The 4-Layer Analysis Breakdown
Below the header, the module shows how each of the four scoring layers contributed to the overall ASI score:
Technical Layer
Shows the status of key indicators: EMA crossover direction, RSI reading, MACD momentum, Bollinger Band position, and market structure assessment. Each indicator is color-coded:
🟢 Green = bullish contribution
🔴 Red = bearish contribution
⚪ Gray = neutral / no signal
On-Chain Layer
Displays exchange flow direction, whale activity summary, and active address trends. The key number to focus on is Net Flow — negative net flow (outflows > inflows) supports a bullish thesis.
Sentiment Layer
Shows social media sentiment score, news sentiment, and community activity trends. Watch for extreme readings — very high sentiment can be a contrarian warning (euphoria precedes tops).
Volume Layer
Displays current volume relative to the 20-period average, breakout probability estimate, and momentum quality assessment. Volume above 1.5x average in the direction of the trend is the strongest confirmation.
💡 Pro Tip: Don't just look at the overall score — check which layers are contributing and which are opposing. A 72 ASI where all four layers agree is a much stronger signal than a 72 where two layers are strongly bullish and two are strongly bearish. The ASI Score Explained guide covers this layer-level interpretation in detail.
Panel 3: Multi-Timeframe Matrix
The Analysis module provides ASI scores across three timeframes: 1-hour, 4-hour, and 1-day. The multi-timeframe matrix shows all three side by side.
How to Read the Matrix
Timeframe Alignment
What It Means
Recommended Action
All three bullish (70+)
Strong trending conditions
High-conviction entry with standard position size
4H + 1D bullish, 1H pulling back
Healthy pullback in uptrend
Best entry timing — enter on the 1H dip
1H bullish, 4H/1D bearish
Counter-trend bounce
High risk — avoid or use tiny position
All three neutral (45-55)
Market indecision
No trade — wait for clarity
All three bearish (<40)
Strong downtrend
Avoid longs; consider shorts if experienced
The ideal entry setup: 1D and 4H both above 70, 1H temporarily at 50-60 (pullback). This means the larger trend is confirmed bullish, medium-term momentum supports it, and the short-term dip provides a better risk/reward entry. This aligns with the principles covered in the Multi-Timeframe Analysis guide.
Panel 4: AI Trading Plan
The Trading Plan panel is one of the most actionable parts of the analysis. It provides:
Entry Zone: The AI-recommended price range for entering the trade
Stop-Loss Level: Where to place your protective stop if the trade goes wrong
Take-Profit Targets: TP1, TP2, and sometimes TP3 levels for scaling out of profits
Risk/Reward Ratio: Calculated from the entry, SL, and TP levels
Setup Type: Whether the AI sees a breakout, pullback, reversal, or range trade
⚠️ Important: The AI trading plan is a recommendation, not a guarantee. Always apply your own risk management rules — particularly the 1-2% risk per trade rule — before entering any position.
Panel 5: AI Reasoning
Every ASI score comes with a natural-language explanation. This is not a generic summary — it specifically references the patterns, events, or data points driving the current score. For example:
"ETH ASI Score 78 — Bullish. 4H EMA(21) cross above EMA(55), RSI recovering from 35 with bullish divergence on 1D. Whale outflows +$42M in the last 12 hours. Sentiment score rising 15 points in the last 24 hours driven by ETF inflow data."
Why the reasoning matters: Two tokens can have identical ASI scores of 72 for completely different reasons. One might be driven by strong technicals while another is driven primarily by whale accumulation. The reasoning helps you understand the risk profile — a technically-driven 72 may be more reliable in a trending market, while a whale-driven 72 may indicate an upcoming catalyst that charts haven't priced in yet.
Panel 6: Signal History
Each token's analysis page includes a historical record of every AI signal. This log tracks:
Every buy signal (ASI crossing above 70) and its outcome
Every sell signal (ASI crossing below 30) and its outcome
Win rate by token: BTC and ETH typically show 65-72% accuracy; micro-caps average 50-58%
Average return per signal: How much each buy/sell signal has historically returned
Best timeframe per token: Which timeframe (1H, 4H, 1D) has been most profitable for each specific token
How to use signal history: Before trading a token based on its current AI score, check its historical accuracy. If the AI has been 70% accurate on ETH 4H signals but only 52% on DOGE 4H signals, you should size your ETH positions larger and your DOGE positions smaller (or skip DOGE entirely).
Complete Analysis Workflow: From Search to Trade Decision
Here is the step-by-step process for running a complete AI analysis:
Search for each candidate token. Wait for the full analysis to load (2-3 seconds).
Step 3: Read the ASI Header
Check the overall score and direction label. If the score is below 55, stop here — there is no clear AI edge on this token right now.
Step 4: Check Multi-Timeframe Alignment
Open the timeframe matrix. Confirm that at least 2 of 3 timeframes agree on direction. If all three conflict, skip this token.
Step 5: Review the 4-Layer Breakdown
Look at which layers are contributing positively and which are opposing. Ideal: all four layers green. Acceptable: three green, one neutral. Risky: two green, two red.
Step 6: Read the AI Reasoning
Understand why the AI assigned this score. Cross-reference with your own chart analysis — does it make sense?
Step 7: Check Signal History
Review the AI's historical accuracy on this specific token. If past signals have been unreliable, reduce your confidence.
Step 8: Review the Trading Plan
Note the entry, SL, and TP levels. Calculate your position size using the 1-2% risk rule.
Step 9: Cross-Validate
Before entering, verify with:
On-chain data — is whale activity supporting the direction?
If everything aligns — ASI 70+, multi-timeframe agreement, 4 layers contributing, whale confirmation — execute the trade with predetermined SL and TP. If anything is missing, add to watchlist and check again tomorrow.
Common Mistakes When Using AI Analysis
Skipping straight to the ASI number without reading the breakdown. The number tells you how bullish the AI is. The breakdown tells you why and how reliable the score is. A 72 with four layers in agreement is fundamentally different from a 72 with two layers fighting each other.
Ignoring the timeframe matrix. A bullish 1H score within a bearish 4H/1D context is a trap. Always check timeframe alignment before entering.
Not checking signal history. The AI is more accurate on some tokens than others. Trading a token where the AI has historically been 52% accurate is barely better than a coin flip. Focus on tokens where AI accuracy exceeds 60%.
Using AI Analysis in isolation. The module is designed to work with other CoinXSight modules — Discovery for finding candidates, Alpha Hunter for entry/exit levels, and On-Chain for whale confirmation. The full workflow produces better results than any single module alone.
Frequently Asked Questions
How many coins does AI Analysis cover?
The module covers 10,000+ tokens across major exchanges. Every token tracked by CoinXSight receives an ASI score.
Can I see which specific indicators are driving the score?
Yes. The 4-Layer Breakdown panel shows the status of each indicator category (technical, on-chain, sentiment, volume). The AI Reasoning section provides natural-language detail about the specific patterns detected.
How often is the analysis updated?
ASI scores recalculate every 5 minutes for actively traded tokens. During high-volatility events, the update frequency may increase. The analysis page shows the last-updated timestamp.
What is the difference between AI Analysis and Alpha Hunter?
AI Analysis is your investigative tool — you choose a token and get a deep analysis. Alpha Hunter is proactive — the AI scans the entire market and pushes the best signals to you automatically. Use Alpha Hunter to find candidates, then use AI Analysis to deep-dive into each one.
What is a good ASI Score to act on?
Most successful traders use ASI > 70 as their entry threshold. Scores above 80 represent the highest-conviction setups. Always combine the ASI with multi-timeframe alignment and proper risk management. For the complete scoring methodology, see ASI Score Explained.
Summary
The AI Analysis module is your direct access point to CoinXSight's intelligence engine. By understanding each panel — the ASI header, 4-layer breakdown, multi-timeframe matrix, trading plan, AI reasoning, and signal history — you can run a systematic analysis that takes 3-5 minutes per token and produces a clear trade or no-trade decision.
Key takeaways:
Use the 10-step workflow: from candidate identification through cross-validation to execution
Always check multi-timeframe alignment before entering
Read the AI reasoning to understand what is driving each score
Check signal history to calibrate accuracy expectations per token