Market Profile Trading for Crypto: Volume, Value Areas & Auction Theory
Learn how Market Profile and Volume Profile reveal where the real buyers and sellers are. Master Point of Control, Value Areas, and auction theory to find institutional price levels in BTC, ETH, and altcoins.
MC
Marcus ChenSenior Quantitative Strategist·May 20, 2026 · 13 min read · Updated Oct 6
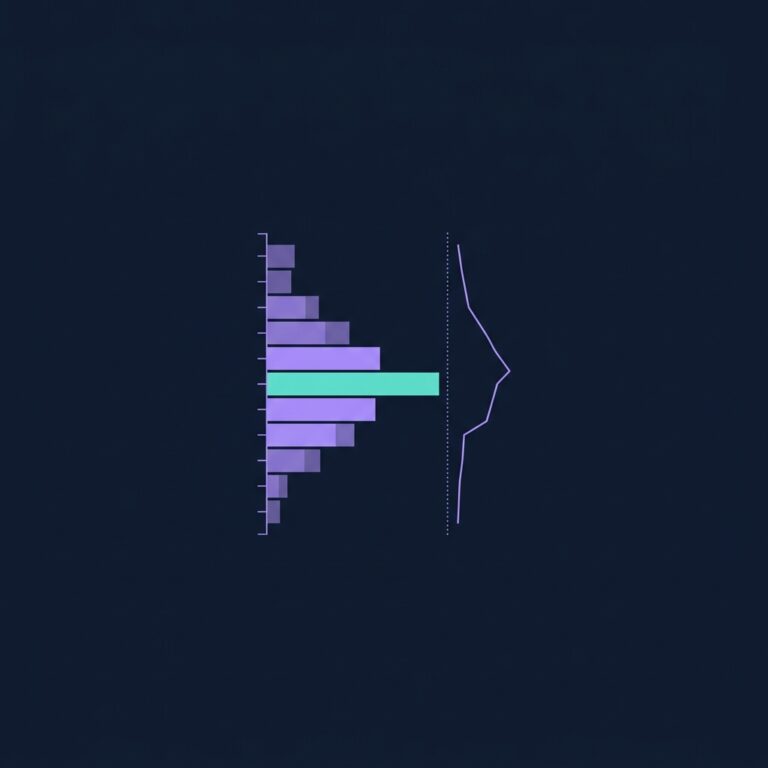
Market Profile was developed by J. Peter Steidlmayer at the Chicago Board of Trade in the 1980s. It organizes price data not by time, but by where the most trading activity occurred — revealing the price levels that the market considers "fair value" versus the levels where price is likely to reverse.
While traditional candlestick charts answer "what happened over time," Market Profile answers a fundamentally different question: "At which prices did participants actually want to trade?"
In crypto's 24/7 markets, this distinction is critical. A candle tells you the high and low of a period. Market Profile tells you whether price spent 30 minutes at the high (rejection) or 6 hours (acceptance) — completely different implications for future price action.
Auction Theory: The Foundation
Market Profile is built on auction theory — the idea that markets exist to facilitate trade between buyers and sellers through a continuous discovery process.
The Auction Process
Price moves up until buyers stop buying (too expensive)
Price moves down until sellers stop selling (too cheap)
The range where both sides actively participate = fair value
Price spends most time in fair value and rejects extremes
Fair Value vs. Unfair Pricing
Zone
Description
Trader Behavior
Fair Value
Price where most volume trades
Two-sided activity, balance, acceptance
Above Fair Value
Too expensive for buyers
Buy volume dries up, sellers appear
Below Fair Value
Too cheap for sellers
Sell volume dries up, buyers appear
The key insight: Price always returns toward fair value. The question is when, not if. Every spike away from fair value is an auction probe — the market testing whether new participants emerge at extended prices.
Core Market Profile Concepts
This is where crypto technical analysis becomes practical — a quality crypto analytics platform will display these signals in real time, helping you act on setups as they form.
Point of Control (POC)
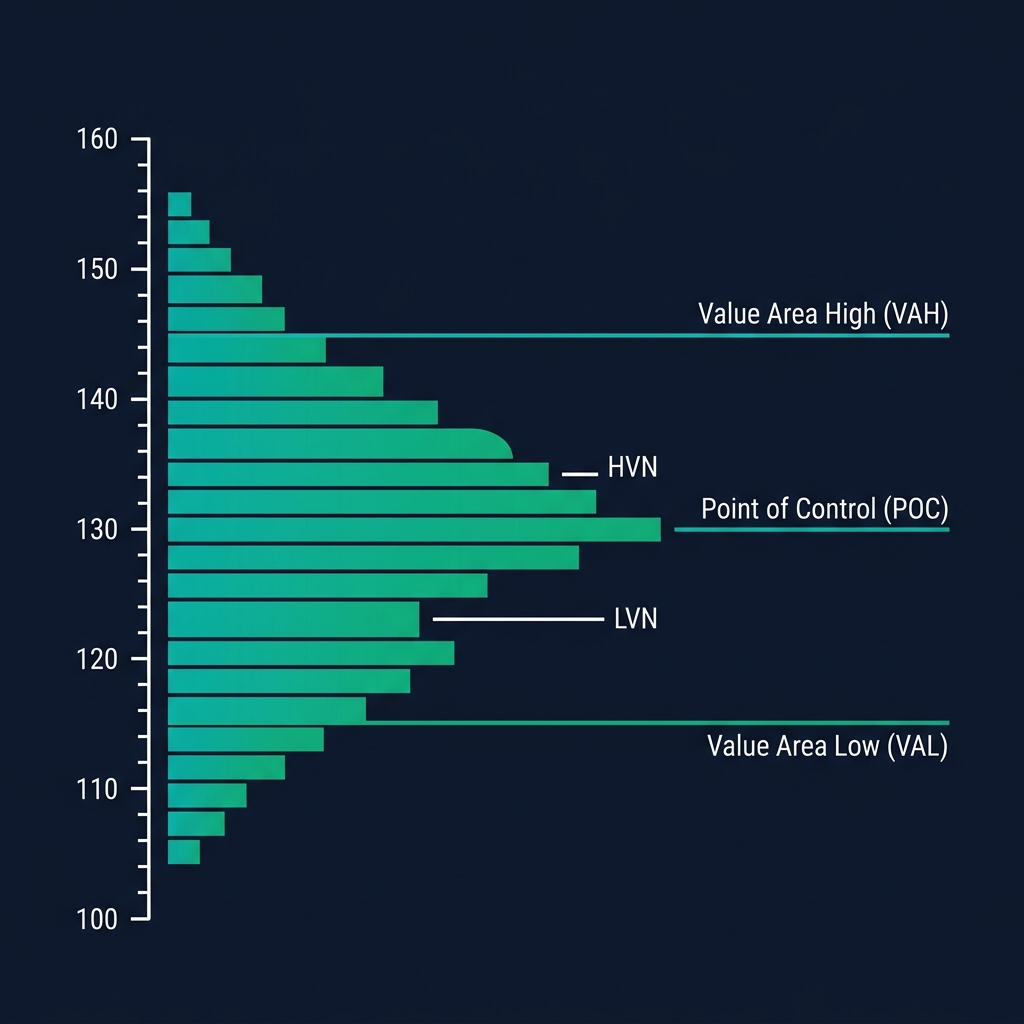
The single price level with the highest volume in the profile period. This is the market's "most agreed-upon" price — where buyers and sellers transacted the most.
Why it matters:
The POC acts as a magnet — price tends to return to it
A POC that migrates higher over multiple sessions = bullish trend
A POC that stays flat = range-bound market
Rejection from a previous session's POC = significant move incoming
Value Area (VA)
The price range containing 70% of the period's trading volume (one standard deviation around the POC).
Value Area High (VAH): Upper boundary of the value area
Value Area Low (VAL): Lower boundary of the value area
Trading implications:
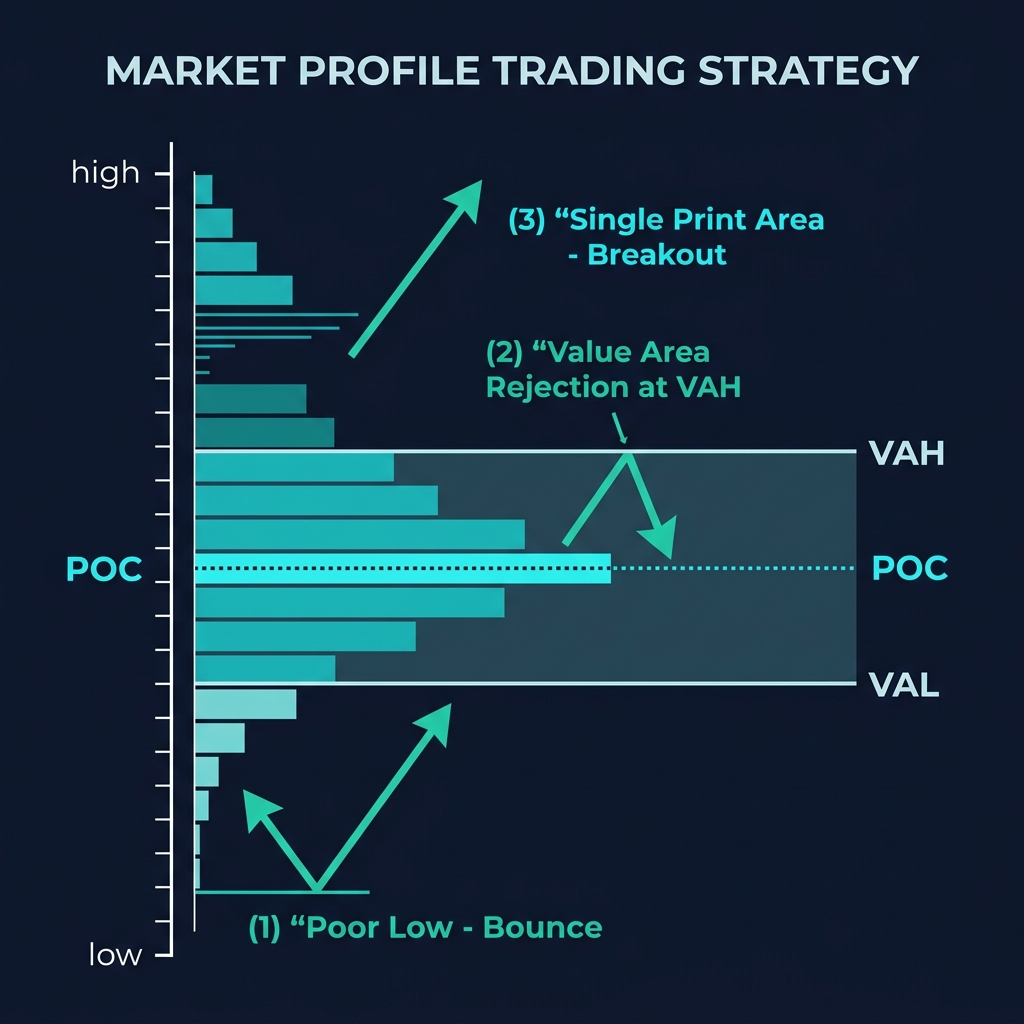
Price opening inside the VA → expect rotation (mean-reversion)
Price opening outside the VA → expect directional continuation
Entry: When price re-enters the VA after failing above VAH (short) or below VAL (long)
Stop: Above the failed auction high (short) or below the failed auction low (long)
Target: POC, then opposite VA boundary
Why this works in crypto:
Crypto markets frequently probe beyond fair value during low-liquidity Asian or weekend sessions. These probes fail when institutional traders don't participate, creating clean failed auction setups during the European/US session.
Strategy 3: Naked POC (VPOC) Test
The previous session's POC that was not tested (price moved away before testing it) acts as a magnet.
Setup:
Identify naked (untested) POCs from previous sessions
Price moves toward the naked POC
Enter in the direction of the naked POC when approaching
Why it works:
Naked POCs represent "unfinished business" — the market agreed on fair value at that level but moved away before fully accepting/rejecting it. Price has a statistical tendency to return and test these levels.
Tracking naked POCs in CoinXSight:
Use Chart Pro to mark previous session POCs. Those that haven't been retested are your naked POCs. These often align with order blocks and fair value gaps, creating powerful confluence.
Strategy 4: Poor High/Low Trade
A "poor" high or low is one that lacks a clean rejection — meaning the market didn't properly auction at the extreme.
Poor High characteristics:
Blunt top with multiple candles at the same high
No clean spike/rejection wick
Suggests buyers were present but didn't overwhelm sellers
Trading implication: Poor highs get revisited. Price will return to properly auction at that level, creating a setup:
If the revisit shows strong selling → rejection trade (short)
If the revisit shows absorption and breakout → continuation trade (long)
Strategy 5: Initial Balance Breakout
The Initial Balance (IB) is the range of the first trading period (typically first 1-2 hours of a session). In crypto, since there are no official sessions, define your IB based on:
Asian session open (00:00 UTC)
European session open (07:00 UTC)
US session open (13:30 UTC)
Setup:
Mark the first 2 hours of your chosen session as the Initial Balance
If price breaks above IB high with volume → Long
If price breaks below IB low with volume → Short
Target: IB range projected in the breakout direction (1x IB range as minimum target)
Stop: Opposite side of IB, or mid-IB (aggressive)
Stats: Initial balance breakout strategies work best in trending environments. Filter with Deep Alpha's Trend score — take IB breakouts only when Trend > 60.
Building a Volume Profile on CoinXSight
CoinXSight provides a crypto analytics platform where you can apply these concepts with real-time data:
Step 1: Choose Your Profile Period
Trading Style
Profile Period
Lookback
Day trading
Session-based (8-12 hours)
Previous 3-5 sessions
Swing trading
Daily profiles
Previous 10-20 days
Position trading
Weekly profiles
Previous 4-8 weeks
Step 2: Identify Key Levels
On Chart Pro, overlay the Volume Profile and mark:
Whale activity at POC levels = institutional validation
Deep Alpha Momentum
High momentum at LVN = fast move likely
Common Mistakes
Mistake 1: Treating POC as Guaranteed Support/Resistance
The POC is a magnet, not a wall. Price is attracted to the POC and often passes through it before reversing. The actual trading signal comes from how price interacts with the POC — acceptance (staying at POC) vs. rejection (bouncing away quickly).
Mistake 2: Using Fixed Time Periods in a 24/7 Market
Traditional Market Profile uses exchange sessions (9:30-4:00). Crypto has no official sessions. Define your own based on liquidity patterns:
Highest liquidity: 13:00-21:00 UTC (US session overlap)
Lowest liquidity: 00:00-07:00 UTC (Asian night)
Using a fixed 24-hour period misses session-specific dynamics.
Mistake 3: Ignoring Profile Context
A POC in an uptrend has different implications than a POC in a downtrend:
Uptrend POC: Acts as support (buy on tests)
Downtrend POC: Acts as resistance (sell on tests)
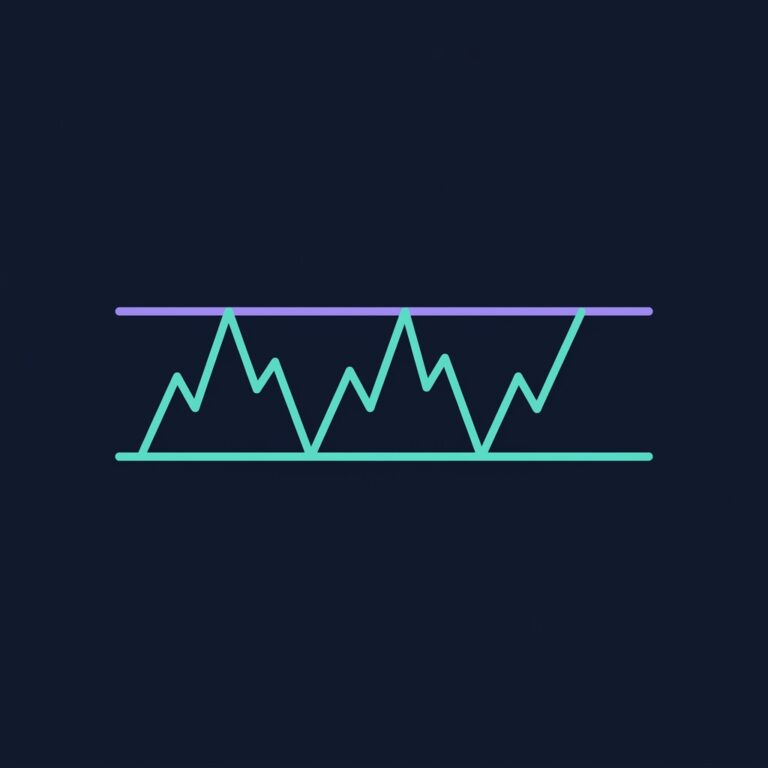
Range POC: Acts as a mean-reversion center
Mistake 4: Over-Complicating with Too Many Profile Periods
Start with one profile period that matches your trading timeframe. A swing trader drowning in hourly profiles is adding noise, not signal.
Advanced Concept: Composite Volume Profile
Instead of looking at individual session profiles, a composite profile aggregates volume data across multiple sessions. This reveals the market's "macro fair value":
Monthly composite: Shows the price level the market found most fair over the entire month
Weekly composite: More responsive, shows developing fair value
Yearly composite: Institutional positioning — the price levels that attracted the most total volume
When the current session's POC aligns with the composite POC, that level becomes extremely significant — it represents both short-term and long-term fair value agreement.
Market Profile Reading for Current BTC (May 2026)
With BTC at ~$77,200 and the market in a fearful regime:
What the profile likely shows:
The monthly composite POC is probably in the $80,000-$82,000 range (where BTC spent the most time in recent weeks)
Current price ($77,200) is below the VAL — indicating price is trading in "unfair" territory on the sell side
This suggests either:
A failed auction below VAL → price should return to the POC ($80K+) = bullish rotation
A genuine breakdown → new value development lower = bearish continuation
How to differentiate: Check volume at $77,200. If volume is low and declining, it's a failed auction (buy). If volume is expanding with strong sell pressure, it's acceptance of lower prices (stay short or flat).
Use CoinXSight's Chart Pro to build Volume Profiles on BTC, ETH, and SOL charts. Combine POC and Value Area analysis with Deep Alpha's multi-factor scoring for institutional-grade price level identification.