Heikin-Ashi Candlesticks: The Noise-Canceling Trading Strategy
Master Heikin-Ashi candlesticks to filter market noise and ride crypto trends longer. Learn the modified OHLC formula, trend identification rules, reversal signals, and practical HA strategies for BTC, ETH, and altcoins.
MC
Marcus ChenSenior Quantitative Strategist·May 20, 2026 · 11 min read · Updated Oct 6
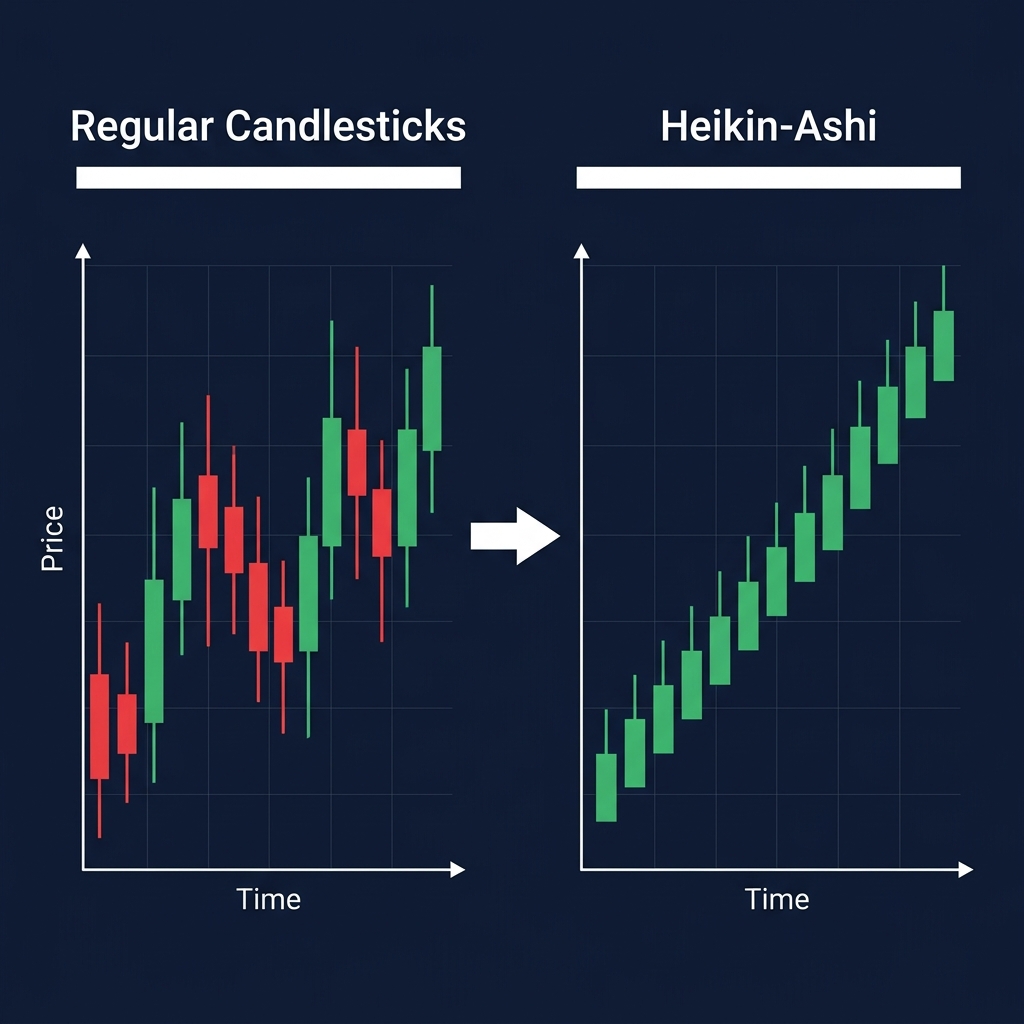
Regular Japanese candlesticks are powerful, but they have a fundamental problem for trend traders: noise. In a clear uptrend, you'll still see red (bearish) candles scattered throughout — pullbacks, indecision, and random volatility that shake you out of good positions.
Heikin-Ashi ("average bar" in Japanese) solves this by smoothing candlestick data. Instead of plotting raw Open-High-Low-Close values, it uses averaged values that create cleaner trends, fewer false signals, and more obvious reversal points.
The trade-off is clear: you gain trend clarity but lose exact price information. Understanding when this trade-off works in your favor is the key to profitable HA trading.
How Heikin-Ashi Candles Are Calculated
Unlike regular candles that use raw price data, each HA candle is calculated from a combination of current and previous data:
The Four Formulas
Component
Formula
Purpose
HA Close
(Open + High + Low + Close) ÷ 4
Average of current bar — smooths the close
HA Open
(Previous HA Open + Previous HA Close) ÷ 2
Midpoint of previous HA candle — creates continuity
HA High
Maximum of (High, HA Open, HA Close)
True high of the period
HA Low
Minimum of (Low, HA Open, HA Close)
True low of the period
What This Creates
The averaging produces candles with specific visual characteristics:
Strong uptrend candles:
Green bodies with no lower wick (or very small)
The close is at or near the high
Each candle opens within the body of the previous candle
Strong downtrend candles:
Red bodies with no upper wick (or very small)
The close is at or near the low
Each candle opens within the body of the previous candle
Reversal/indecision candles:
Small bodies with wicks on both sides (spinning tops/dojis)
Signal a potential change in trend direction
Reading Heikin-Ashi: The Visual Language
Trend Identification
This is where HA shines — trend identification becomes almost trivially easy:
HA Pattern
Meaning
Action
Consecutive green candles, no lower wicks
Strong uptrend
Hold long, trail stop
Consecutive red candles, no upper wicks
Strong downtrend
Hold short or stay flat
Green candles with growing lower wicks
Uptrend weakening
Tighten stops, prepare for reversal
Red candles with growing upper wicks
Downtrend weakening
Watch for bottom, prepare to buy
Small bodies, long wicks both sides
Indecision / potential reversal
Wait for confirmation
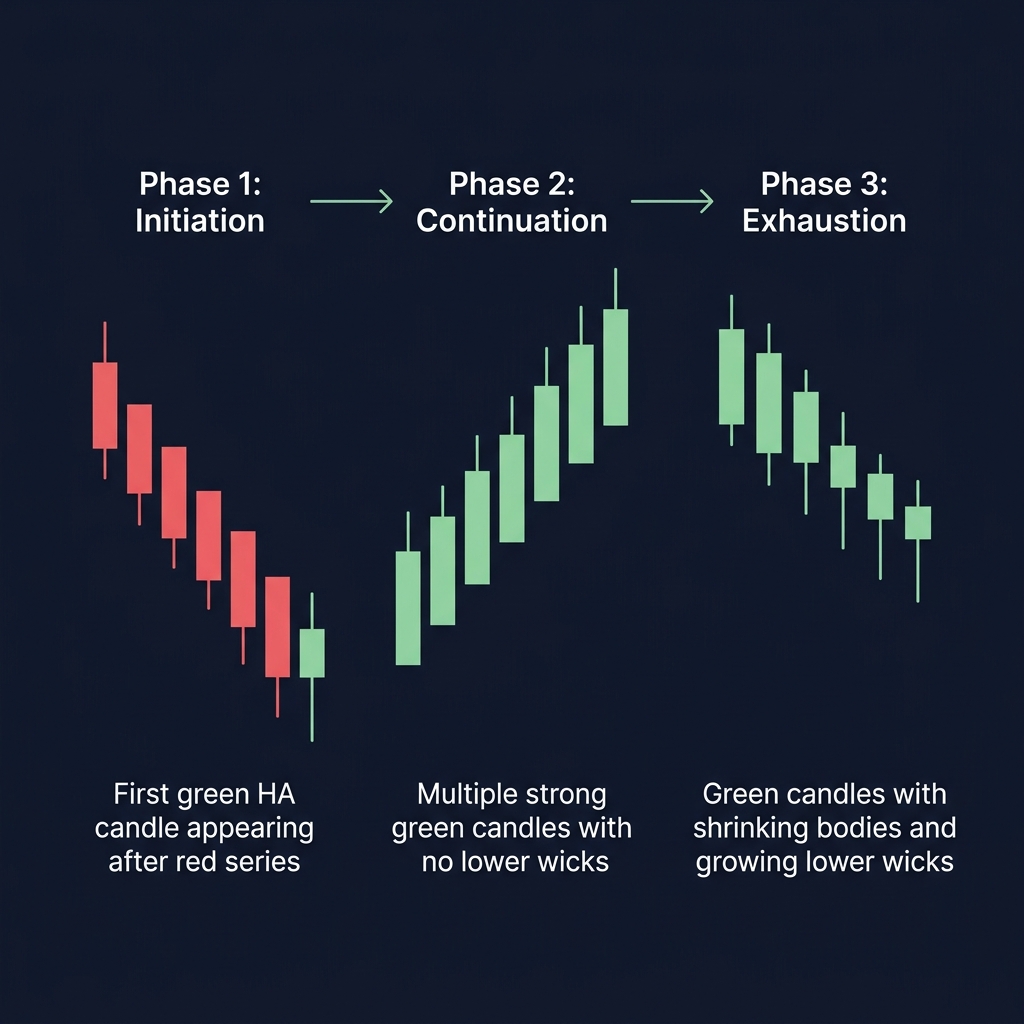
The Three Phases of an HA Trend
Phase 1: Trend Initiation
First strong HA candle in the new direction
The body opens within or near the previous candle's body
Wicks are forming only in the trend direction (upper wick for bulls, lower wick for bears)
Phase 2: Trend Continuation
Multiple consecutive same-color candles
Bodies are large with minimal counter-trend wicks
This is the "easy money" phase — ride it
Phase 3: Trend Exhaustion
Bodies shrink noticeably
Counter-trend wicks appear and grow
The color hasn't changed yet, but momentum is dying
This is your warning to prepare exit/reversal strategies
Heikin-Ashi Trading Strategies
Strategy 1: Trend Riding (Core Strategy)
The fundamental HA strategy — enter on trend initiation, ride during continuation, exit on exhaustion.
Entry Rules:
Wait for the first green HA candle after a series of red candles (or vice versa)
Confirm the candle has no lower wick (for longs) or no upper wick (for shorts)
Enter on the close of the confirmation candle
Exit Rules:
Exit when the first opposite-colored HA candle closes with a wick on your trend side
OR exit when 2 consecutive HA candles show expanding counter-trend wicks
Stop Loss:
Below the low of the initiation candle (for longs)
Above the high of the initiation candle (for shorts)
Position Management:
Profitable? Trail your stop to the low of the previous 2 HA candles
This keeps you in the trend while protecting gains
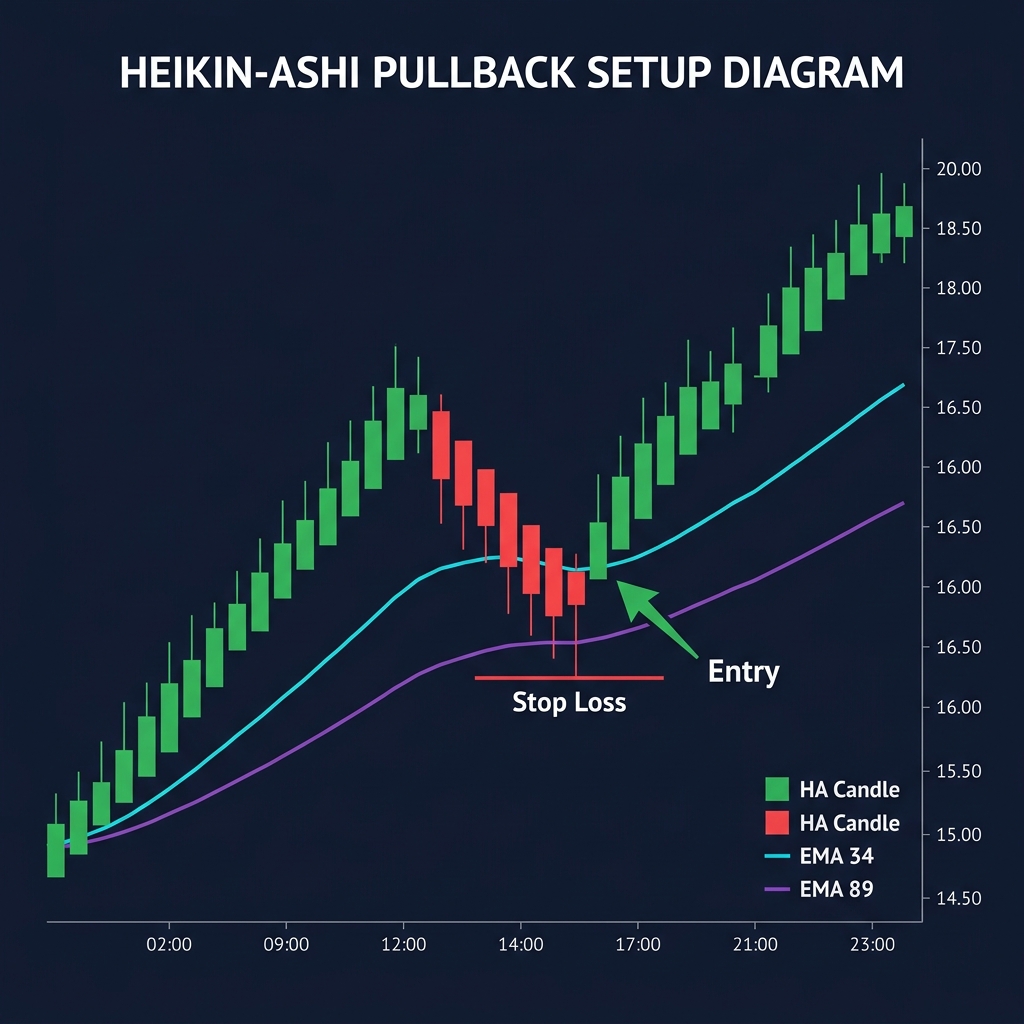
HA candles turn green after a pullback (red HA candles touching EMA 34)
First green HA candle with no lower wick = entry
Short Entry:
Price below both EMAs (trend filter = bearish)
HA candles turn red after a bounce (green HA candles touching EMA 34)
First red HA candle with no upper wick = entry
Why this works:
The EMA filter ensures you're trading WITH the trend, while HA candles time your entry to the end of counter-trend pullbacks. This eliminates the worst HA pitfall: trading reversals in the middle of a strong counter-trend.
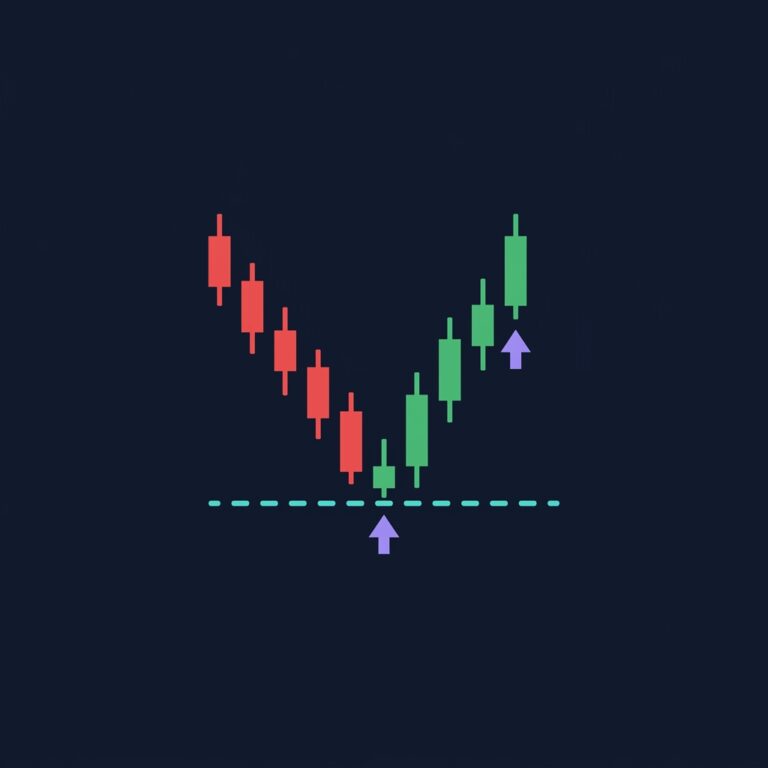
Strategy 3: HA Doji Reversal
HA doji (spinning top) candles at key levels signal reversals with high reliability.
Price approaches the level during a clear HA trend
An HA doji forms AT the key level (small body, long wicks both sides)
The next candle changes color = reversal confirmed
Entry: On the close of the first candle after the doji that confirms the new direction
Stop: Beyond the doji's wick (the extreme of the reversal zone)
Target: Previous swing high/low or next key S/R level
Best conditions: Works exceptionally well when the doji appears at:
Only trade HA signals when price is clearly above or below EMAs
Avoid HA in markets flagged as "SIDEWAYS" by Deep Alpha's regime detection
Limitation 4: No Gap Analysis
HA eliminates gaps because each candle opens at the midpoint of the previous candle. In crypto, significant gaps (especially in futures) can provide valuable information about momentum and institutional positioning. HA erases this data.
Solution: Keep a regular candle chart open alongside your HA chart to monitor gap formations.
Heikin-Ashi vs. Other Smoothing Methods
Method
Smoothing Level
Lag
Best For
Regular candles
None
None
Precise entries, pattern recognition
Heikin-Ashi
Moderate
Low-moderate
Trend following, noise reduction
Renko
High
Moderate
Pure trend signals, removes time
Kagi
High
Moderate
Identifying S/R levels
EMA on candles
Variable
Variable
Flexible trend filtering
HA hits the sweet spot between too much noise (regular candles) and too much lag (Renko/Kagi).
HA in CoinXSight's Chart Pro
Setting Up HA Charts
Chart Pro supports Heikin-Ashi as a chart type alongside regular candlesticks. Switch between them to get both perspectives:
HA view: For trend direction and timing
Regular view: For exact price levels and order placement
Combining HA with Deep Alpha
HA Signal
Deep Alpha Confirmation
Action
Green HA, no lower wick
Trend > 60, Momentum > 50
Strong long entry
Red HA, no upper wick
Trend < 40, Distribution > 60
Strong short / exit long
HA doji at support
Fear > 60, Accumulation rising
Potential bottom — cautious long
HA doji at resistance
Momentum declining, Volume low
Potential top — take profits
Practical HA Workflow
Open Chart Pro with HA candle type on 4H timeframe
Add EMA 34 and EMA 89 for trend filtering
Check Deep Alpha for trend score and momentum confirmation
Scan for entries: Look for pullbacks to EMA 34 where HA candles turn green (long) or red (short)
Switch to regular candles to place your actual order at precise prices
Set stops based on previous HA swing lows/highs
Quick Reference: HA Trading Rules
What to Do
HA Pattern
Action
First green candle, no lower wick, after red series
Enter long
First red candle, no upper wick, after green series
Enter short / exit long
Strong green candles with no lower wicks
Hold and trail stop
Strong red candles with no upper wicks
Stay short or in cash
Doji at key support with bullish confirmation
Long reversal entry
What NOT to Do
Mistake
Why It Fails
Placing orders at HA prices
HA prices are averages, not real prices
Trading HA signals in sideways markets
Generates excessive false signals
Ignoring regular candles entirely
You lose gap and exact price information
Using HA on 5-minute charts
Too much lag for scalping timeframes
Entering on the first color change without confirmation
Many color changes reverse immediately
HA Performance in Crypto Markets
Based on historical analysis of BTC 4H data (2024-2026):
Metric
HA Trend Riding
HA + EMA Filter
HA MTF Alignment
Win Rate
52%
61%
68%
Avg Win/Loss Ratio
2.1:1
2.4:1
2.8:1
Monthly Signals
15-20
8-12
3-5
Avg Hold Time
2-4 days
3-6 days
5-10 days
Best Market Type
Trending
Trending
Strong trending
The HA + EMA Filter is the best balance of signal frequency and quality for most swing traders. The MTF Alignment strategy has the highest win rate but generates very few signals.
Switch to Heikin-Ashi candlesticks on CoinXSight's Chart Pro to instantly filter market noise. Combine with Deep Alpha's trend scoring for the highest-conviction swing trade entries.
Master multi-timeframe analysis for crypto trading. Learn the 3-timeframe rule, top-down analysis flow, timeframe alignment signals, and how to combine…
Master crypto swing trading with AI-powered signal generation, EMA crossover strategies, and risk management. Step-by-step setups using CoinXSight with real…