Order Block Trading: Identifying Institutional Footprints on Crypto Charts
Master order block trading for crypto. Learn how to identify bullish and bearish order blocks, understand institutional footprints, and trade high-probability zones.
JV
Julian VanceLead Technical Systems Architect·May 20, 2026 · 11 min read · Updated Oct 6
Order blocks are specific price zones on a chart where institutional traders — market makers, hedge funds, and large portfolio managers — have placed significant buy or sell orders. These zones act as powerful support and resistance areas because institutional capital creates a "footprint" in the price action.
Unlike traditional support and resistance (which rely on horizontal lines at round numbers or previous highs/lows), order blocks pinpoint the exact candles where institutional activity occurred. This gives traders a precision advantage for entries and exits.
The concept comes from the "Inner Circle Trader" (ICT) methodology but has been refined and adopted by professional crypto traders as a core smart money concept.
How Order Blocks Form
Order blocks form through a specific sequence of price action:
The Formation Process
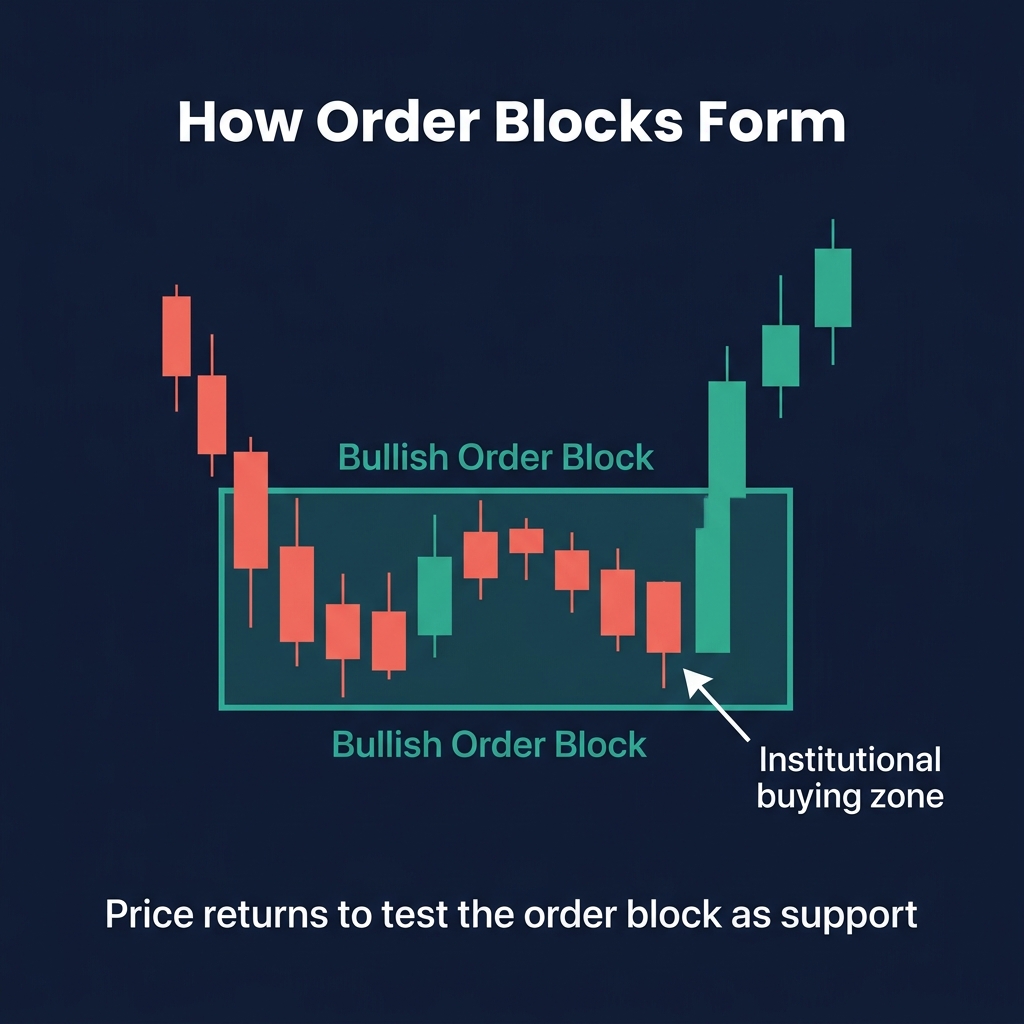
Accumulation phase: Price moves sideways or slightly against the eventual direction. During this consolidation, institutional players are quietly building positions.
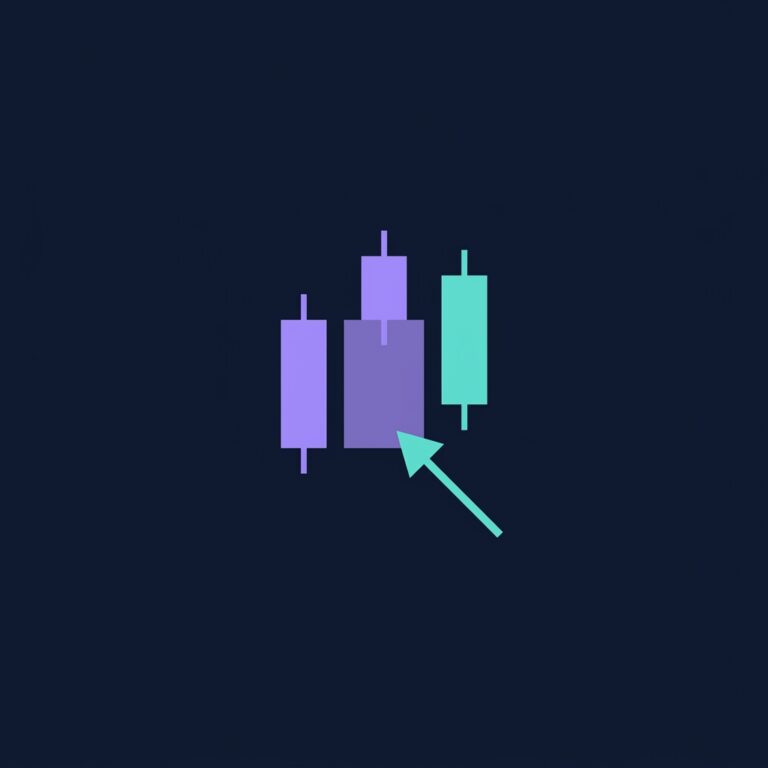
The order block candle: The last opposing candle before a strong impulsive move. For a bullish order block, this is the last bearish (red) candle before price rockets upward.
The impulse move: A strong, aggressive move away from the zone that breaks market structure. This move confirms that significant capital was deployed at the order block level.
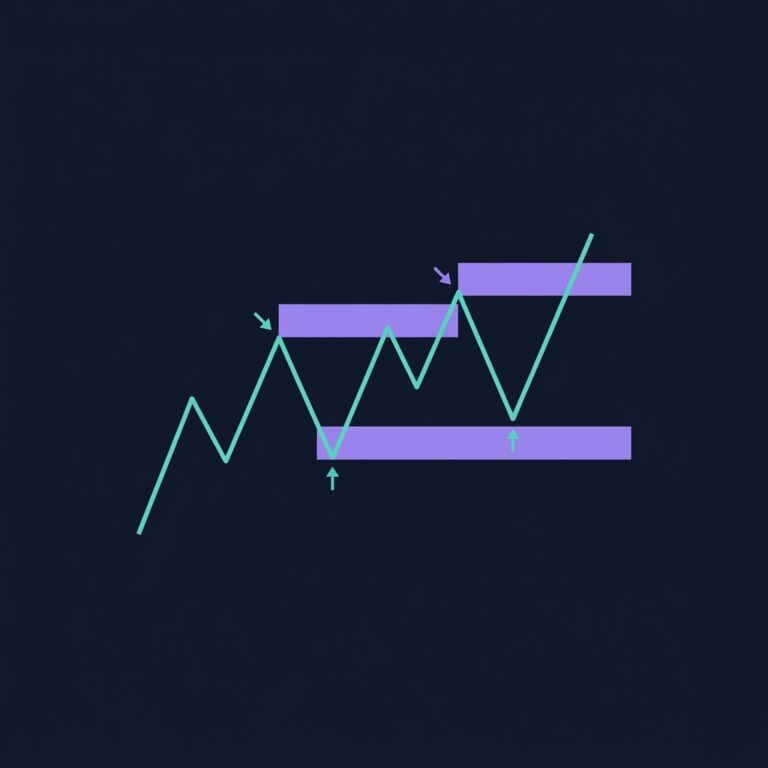
The return test: Price eventually retraces back to the order block zone, where the remaining unfilled institutional orders provide support (bullish) or resistance (bearish).
Why This Works
Institutions can't fill their entire position in one order — they're too large. They break orders into smaller pieces over time. When price returns to their entry zone, they have remaining orders that still need filling. This creates:
Unfilled orders waiting at the order block level
Institutional defense of their average entry price
High-probability reaction when price retests the zone
Bullish vs Bearish Order Blocks
Bullish Order Block
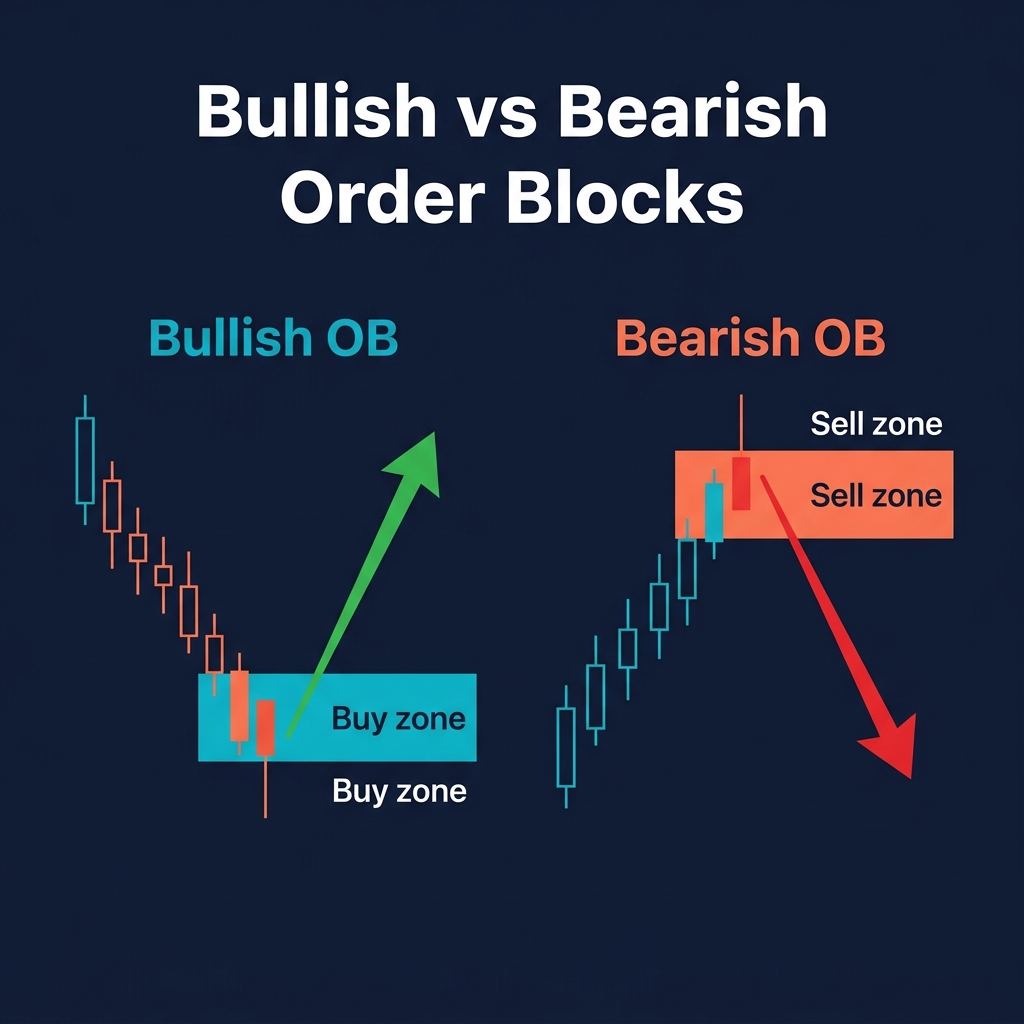
A bullish order block is the last bearish candle (or group of candles) before a strong upward impulsive move that breaks market structure.
How to identify:
Find a significant swing low
Identify the last red candle(s) before the aggressive move up
Mark the range from the open to the low of that candle
This zone becomes your buy zone when price retraces
Trading it:
Wait for price to return to the order block zone
Look for bullish confirmation (rejection wick, bullish engulfing)
Enter long with stop-loss below the order block low
Target the next significant resistance or supply zone
Bearish Order Block
A bearish order block is the last bullish candle (or group of candles) before a strong downward impulsive move that breaks market structure.
How to identify:
Find a significant swing high
Identify the last green candle(s) before the aggressive move down
Mark the range from the open to the high of that candle
This zone becomes your sell zone when price retraces
Trading it:
Wait for price to return to the order block zone
Look for bearish confirmation (rejection wick, bearish engulfing)
Enter short with stop-loss above the order block high
Target the next significant support or demand zone
Order Block Validity Checklist
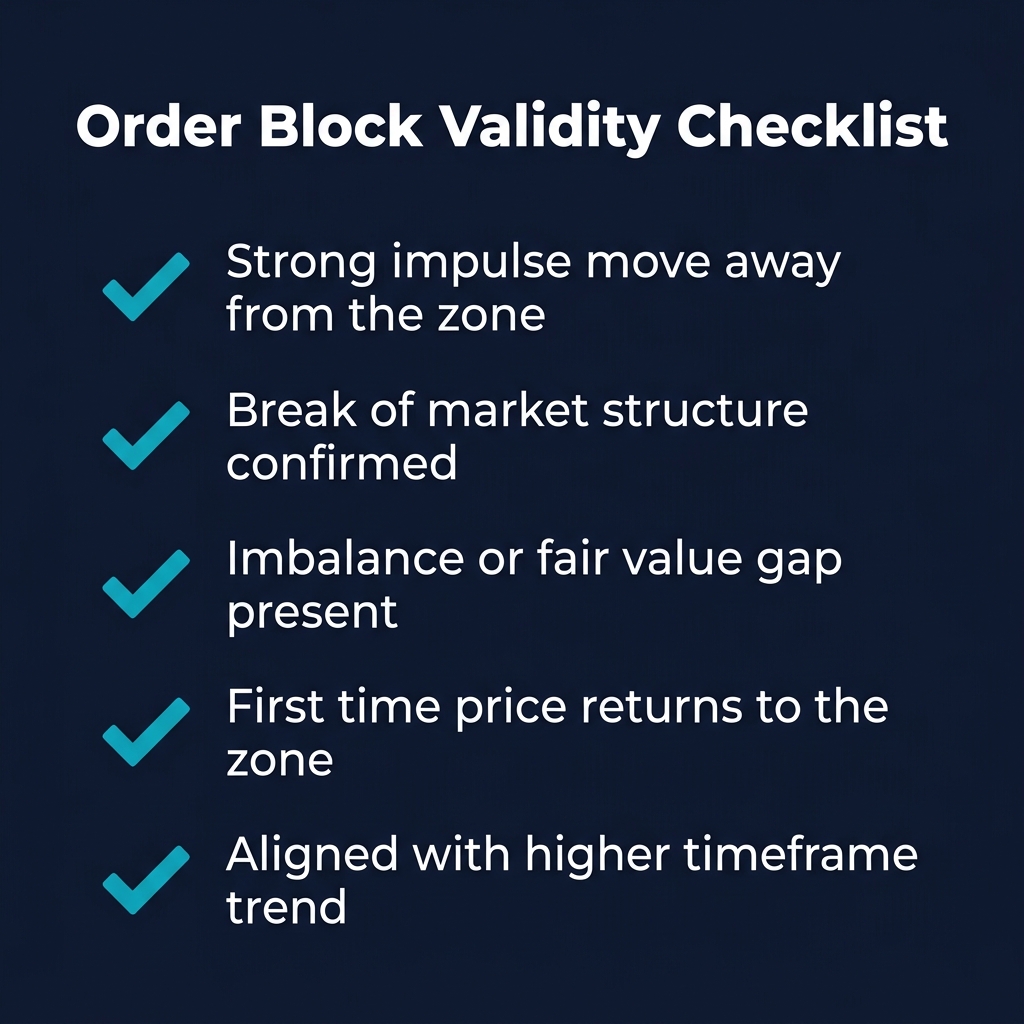
Not every consolidation zone is a valid order block. Use these five criteria to filter high-probability setups:
1. Strong Impulse Move Away From the Zone
The move leaving the order block must be aggressive and impulsive — not a gradual drift. Look for:
Large-bodied candles with small wicks
3+ consecutive candles in the breakout direction
Volume significantly above average during the impulse
Rule of thumb: The impulse should be at least 2x the size of the order block range.
2. Break of Market Structure Confirmed
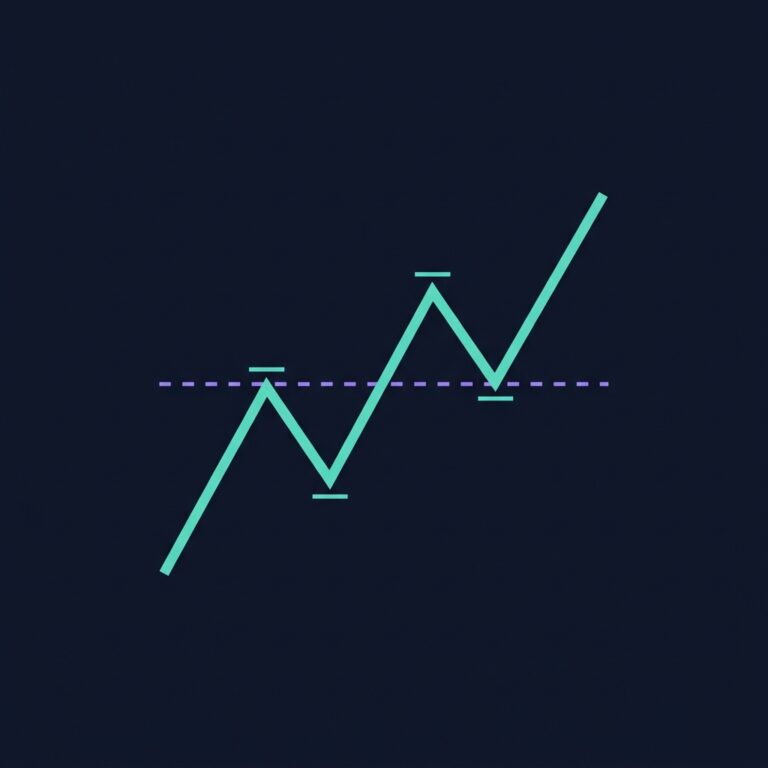
The impulse move must break a significant market structure level — a previous swing high (for bullish) or swing low (for bearish). Without a structure break, the "order block" is just consolidation within a range.
3. Imbalance or Fair Value Gap Present
The best order blocks create an imbalance (fair value gap) during the impulse move. This gap represents aggressive one-sided order flow and confirms institutional participation.
If there's no FVG in the impulse, the order block is weaker because the move was more "organic" rather than driven by concentrated institutional orders.
4. First Time Price Returns to the Zone
Order blocks are strongest on their first retest. Each subsequent touch weakens the zone as unfilled orders get absorbed. As a general rule:
1st touch: Highest probability (trade it)
2nd touch: Still viable but use tighter stops
3rd touch: Consider the zone invalidated
5. Aligned With Higher Timeframe Trend
An order block on the 1-hour chart is significantly more reliable when it aligns with the daily or 4-hour trend. Trading against the higher timeframe direction reduces win rates dramatically.
Order Block Trading Strategy: Step by Step
Step 1: Identify the Higher Timeframe Bias
Before looking for order blocks, determine the macro trend:
Daily chart uptrend → Look for bullish order blocks on 4H/1H
Daily chart downtrend → Look for bearish order blocks on 4H/1H
Daily chart ranging → Be selective and use both directions at range extremes
Step 2: Mark Key Order Blocks
On your trading timeframe (4H or 1H for swing trades, 15m for intraday):
Identify recent impulse moves that broke market structure
Mark the last opposing candle before each impulse
Extend the zone forward as a rectangle
Step 3: Wait for the Retest
This is the hardest part — patience. Don't chase price. Wait for it to retrace to your marked order block. Common retracement levels where order blocks sit:
50% of the impulse move (optimal trade entry — OTE)
62-79% of the impulse move (deep discount/premium entries)
Step 4: Confirm Entry
When price reaches the order block, look for confirmation:
Wick rejection off the zone (long shadow, small body)
Shift in lower timeframe structure (e.g., bullish structure shift on 5m when buying the 1H OB)
Volume spike at the zone indicating order absorption
Step 5: Execute With Clear Risk Parameters
Entry: At the order block zone or on confirmation candle close
Stop-loss: Below the order block low (bullish) or above the high (bearish), add 1-2% buffer for wicks
Take profit: Next opposing order block, or use 1:2 minimum risk/reward ratio
Position size: Risk no more than 1-2% of total account per trade
Order Blocks vs Traditional Support and Resistance
Feature
Order Blocks
Traditional S/R
Precision
Specific candle zones
Broader price areas
Foundation
Institutional order flow theory
Historical price memory
Strength indicator
Impulse quality + FVG presence
Number of touches
First touch
Strongest reaction
Needs multiple confirmations
Invalidation
Closes through the zone
Gradual erosion
Timeframe
Multi-timeframe confluence
Often single timeframe
Order Blocks in Crypto: Special Considerations
24/7 Markets Change the Dynamic
Unlike forex or stocks, crypto trades continuously. This means:
Order blocks formed during low-liquidity Asian sessions are weaker
Blocks formed during high-volume US/EU sessions are strongest
Weekend order blocks tend to be less reliable
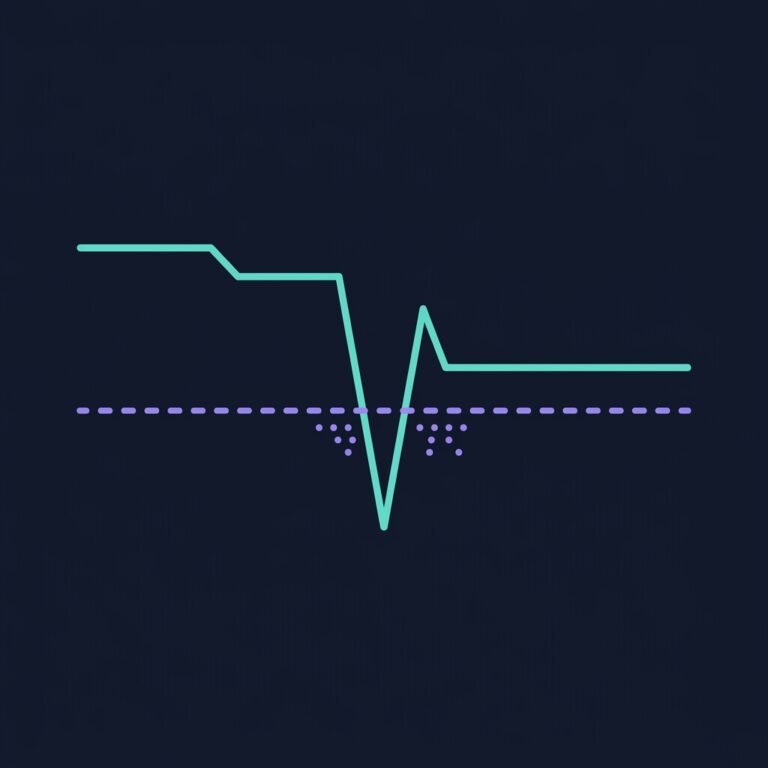
Liquidation Cascades Create False Order Blocks
Crypto's high leverage environment creates cascading liquidations that look like impulse moves but aren't driven by institutional positioning. To filter these:
Check if the impulse coincided with a major liquidation event
Verify that the move was sustained (not immediately reversed)
Look for the impulse on spot markets, not just perpetual futures
High Volatility Requires Wider Zones
Crypto's inherent volatility means order block zones need to be slightly wider than in traditional markets. Use the full candle range (high to low) rather than just the body (open to close) for your order block marking.
Common Mistakes
Mistake 1: Every Red/Green Candle Is an Order Block
Not every opposing candle before a move is a valid order block. Without a clear structure break and strong impulse, you're just drawing random zones on your chart.
Mistake 2: Trading Against the Trend
Bearish order blocks in a strong uptrend or bullish order blocks in a strong downtrend have significantly lower win rates. Always align with the higher timeframe direction.
Mistake 3: Ignoring Invalidation
When price closes through an order block (not just wicks through it), the zone is invalidated. Don't keep expecting reactions from a broken zone — it's now likely to act as the opposite (support becomes resistance and vice versa).
Mistake 4: Too Many Order Blocks on the Chart
If you have 20 order blocks marked on a single chart, none of them are actionable. Focus on the 2-3 most significant blocks that align with all validity criteria.
Combining Order Blocks With Other Tools
Order blocks work best when combined with:
Fair Value Gaps: OBs adjacent to FVGs have the highest probability
Liquidity sweeps: OBs that form after a liquidity sweep are institutional repositioning zones
Fibonacci levels: OBs sitting at the 61.8-79% retracement (OTE) are premium entries
Volume Profile: OBs at low-volume nodes confirm institutional activity
CoinXSight AI signals: On-chain and sentiment data can confirm whether institutional money is actually flowing into the OB zone
Key Takeaways
Order blocks are specific candle zones where institutional traders placed large orders
The last opposing candle before a structure-breaking impulse defines the order block
Valid order blocks require: strong impulse, structure break, FVG presence, first retest, trend alignment
First-touch order blocks are the strongest — each subsequent touch weakens the zone
Always trade order blocks with the higher timeframe trend, never against it
Crypto-specific considerations: session timing, liquidation cascades, wider zones for volatility
Combine order blocks with FVGs, liquidity sweeps, and Fibonacci for the highest-probability setups
Identify institutional footprints on your charts with CoinXSight's Chart Pro module. Access advanced technical analysis tools with AI-powered pattern detection and smart money concepts.
JV
Julian Vance
TA // SYSTEMS
Lead Technical Systems Architect·Signals & Metrics Desk
Technical systems developer with a mathematical focus on momentum indicators, volatility metrics (ATR), volume profiles, and multi-timeframe filter models.
QUANTITATIVE SUITE // DEEP ALPHA ENGINEACTIVE
BTC/USDT // LIVE SCANNER
CONFLUENCE 79
LIVE SPOT PRICE$83,613.06MODERATE_BUY
TP2
$89,046.84
+6.95%
TP1
$85,576.95
+2.78%
ENTRY
$83,263.68
ZONE
SL
$82,107.05
-1.39%
Auto-detect Order Blocks, Fair Value Gaps and risk-adjusted DCA ladders in < 5s.