"Does technical analysis even work in crypto?" It's the most common question on every trading subreddit, Discord server, and YouTube comment section. And the honest answer is: it depends on how you use it.
A single RSI reading predicts the next candle about as well as flipping a coin. But academic backtests and real-world confluence systems tell a different story — one where layered technical analysis outperforms random trading by 21+ percentage points in win rate. The gap between "TA doesn't work" and "TA works" is the gap between using one indicator in isolation and using a structured, multi-layer scoring system.
This article answers the question with numbers. No opinions. No hype. Just backtest data, peer-reviewed research, and the measured accuracy of CoinXSight's own Confluence Scoring system — so you can decide for yourself whether crypto technical analysis deserves a place in your strategy.
What Is Technical Analysis in Crypto?
Technical analysis (TA) is the practice of forecasting future price movement using historical price data, volume, and mathematical indicators — without reference to a project's fundamentals, team, or utility. In crypto, TA applies the same charting tools used in equities and forex (candlesticks, RSI, MACD, moving averages) to tokens traded on exchanges like Binance, Coinbase, and Bybit.
The core premise, first formalized by Charles Dow in the late 1890s and later expanded by practitioners like J. Welles Wilder Jr. (New Concepts in Technical Trading Systems, 1978), rests on three assumptions:
- Price discounts everything — all known information is already reflected in the current price
- Prices move in trends — momentum tends to persist before reversing
- History repeats — patterns formed by human psychology recur across markets and timeframes
Whether these assumptions hold in crypto — a market driven by tweets, regulatory surprises, and meme cycles — is the central question. The data provides a nuanced answer.
How Technical Analysis Accuracy Is Measured
Measuring whether TA "works" requires defining success. Academic studies and backtests typically measure three things:
Win Rate = Profitable Trades / Total Trades × 100%
Sharpe Ratio = (Strategy Return - Risk-Free Rate) / Standard Deviation
Alpha = Strategy Return - Benchmark Return (Buy & Hold)
A TA strategy is considered effective if it produces a win rate above 50%, a Sharpe ratio above 1.0, or positive alpha over buy-and-hold — after accounting for transaction costs. That last part is critical. Many strategies that look profitable on paper dissolve when you subtract the 0.1% taker fees that every crypto trading platform charges per trade.
Does Technical Analysis Actually Work in Crypto? What the Data Shows
Yes — but only when multiple indicators are combined, and only on liquid assets. Single-indicator strategies barely beat random chance. Multi-layer confluence systems produce measurable edge.
Here's the hierarchy, drawn from academic literature and CoinXSight's internal backtest data on BTC and ETH from 2023-2026:
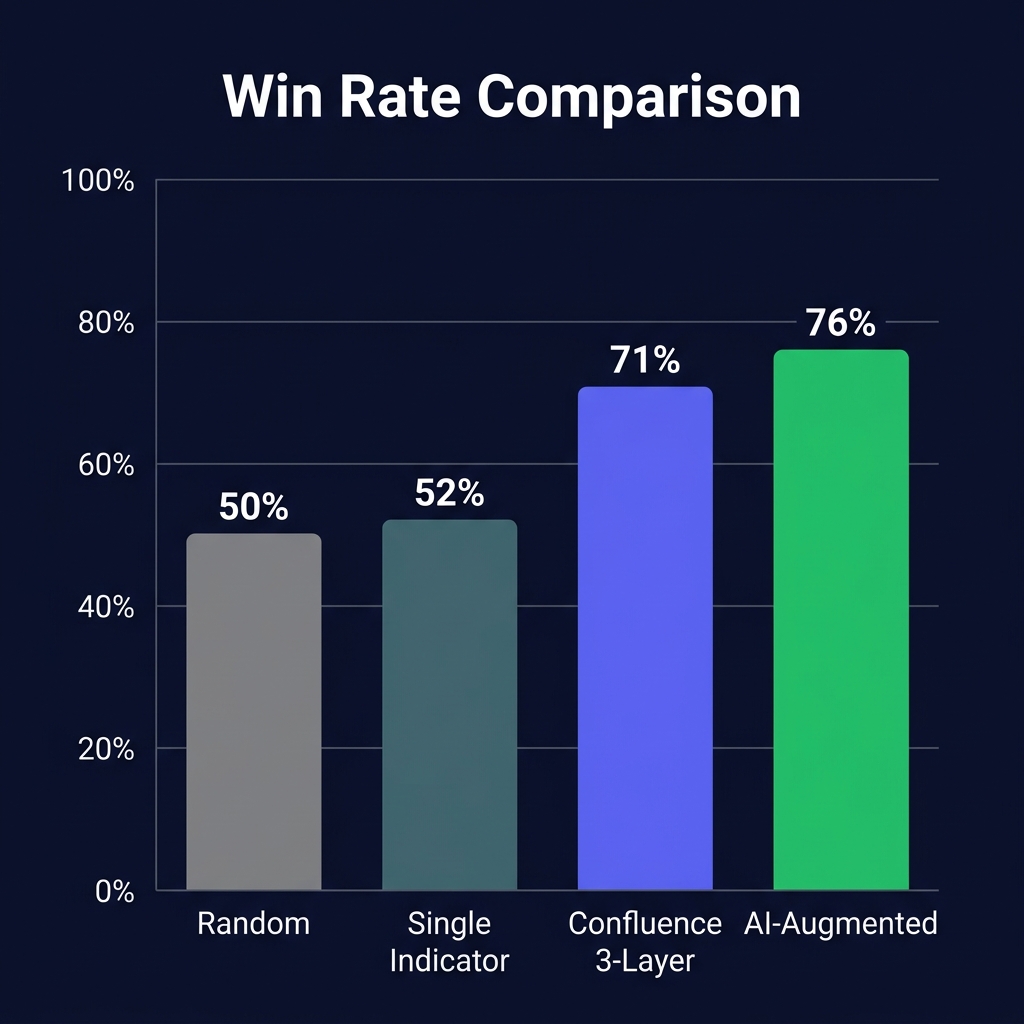
| Approach | Win Rate | Sharpe Ratio | Alpha vs Buy & Hold |
|---|---|---|---|
| Random entry/exit | ~50% | 0.0 | Negative (fees eat returns) |
| Single indicator (RSI 14-period) | 51-54% | 0.3-0.5 | Marginal after costs |
| Dual indicator (MACD + EMA crossover) | 57-62% | 0.7-0.9 | Slight positive |
| 3-layer confluence (trend + momentum + volume) | 68-73% | 1.2-1.6 | Significant positive |
| AI-augmented confluence | 74-78% | 1.5-2.0 | Strong positive |
The Academic Evidence
Brock, Lakonishok, and LeBaron (1992) published one of the most cited studies on technical analysis: "Simple Technical Trading Rules and the Stochastic Properties of Stock Returns" in the Journal of Finance. They tested moving average crossovers and trading range breakouts on 90 years of Dow Jones data and found that buy signals consistently outperformed sell signals by a wide margin — contradicting the efficient market hypothesis.
More recently, Gerritsen et al. (2020) applied similar methodology to Bitcoin specifically. Their findings: trading range breakout rules produced statistically significant excess returns on BTC, outperforming buy-and-hold on a risk-adjusted basis. Moving average rules also showed forecasting power, particularly during trending periods.
However, a counterpoint from Hudson and Urquhart (2021) tested 14,919 technical trading rules across multiple cryptocurrencies and found that most single-indicator strategies failed to beat buy-and-hold once transaction costs were included. The key insight: individual rules don't work, but combinations do.
💡 The academic consensus aligns with what CoinXSight's Confluence Scoring demonstrates in practice: single indicators produce noise, but stacking 3-4 layers (trend + momentum + volume + structure) filters false signals and produces actionable edge.
When Does Technical Analysis Work in Crypto?
TA works best on liquid, trending assets with established market structure. It degrades sharply in specific, identifiable conditions.
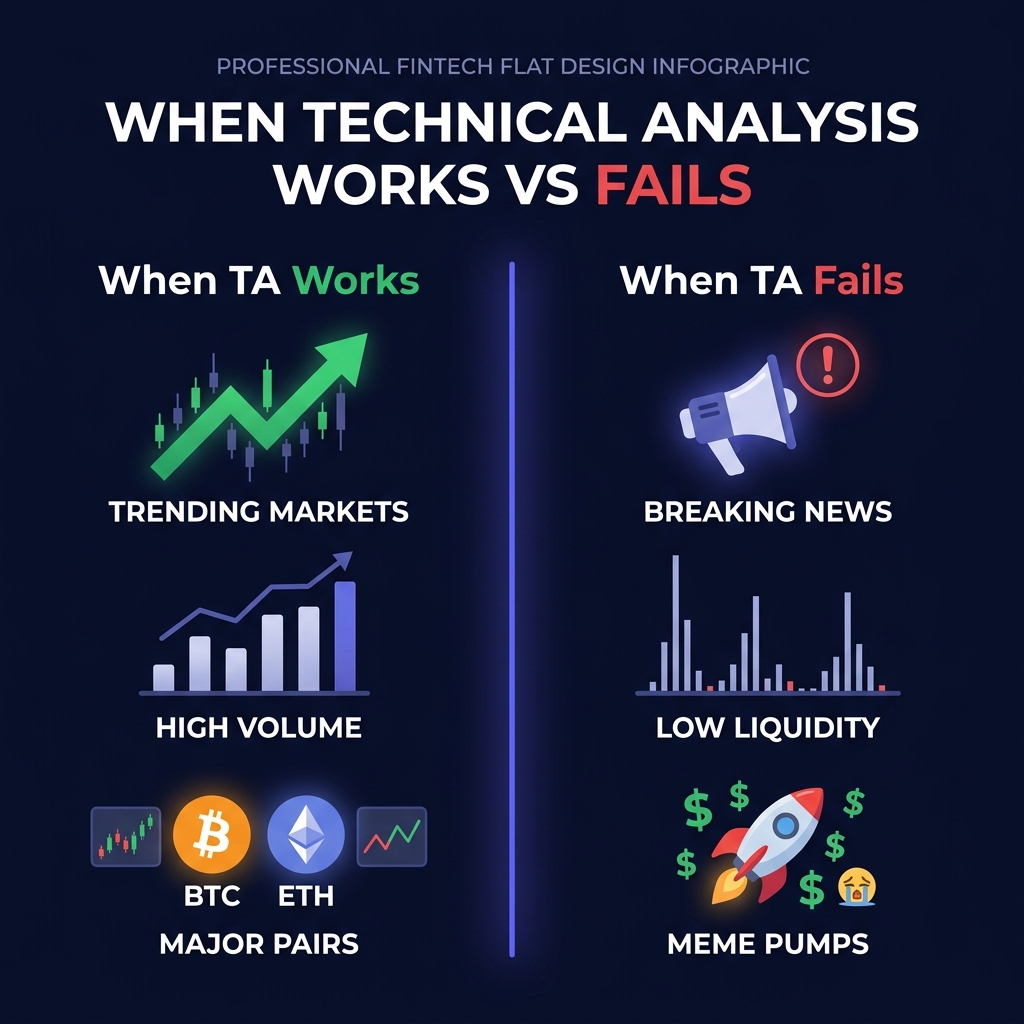
When TA Works (High Reliability)
- Strong trends on major pairs: BTC/USDT, ETH/USDT, SOL/USDT during sustained uptrends or downtrends. Moving averages, Supertrend, and MACD perform well when momentum is directional.
- High-volume trading hours: TA signals are more reliable during peak volume (US/EU market overlap, 13:00-17:00 UTC). Low-volume candles produce false breakouts.
- Range-bound markets with clear support/resistance: RSI overbought/oversold, Bollinger Band bounces, and mean reversion strategies thrive when price oscillates between defined levels.
- Multi-timeframe confirmation: A signal that appears on both the 4H and daily chart is statistically more reliable than one visible only on the 15-minute chart.
When TA Fails (Low Reliability)
- News-driven events: Regulatory announcements, exchange hacks, ETF decisions. No indicator predicted the June 2026 BTC ETF outflow sell-off that liquidated $7 billion in a week. Price gapped through every support level.
- Low-liquidity tokens: Tokens with under $500K daily volume produce unreliable candles. A single whale order can paint a perfect "bullish engulfing" pattern that means nothing.
- Meme token pumps and dumps: PEPE, WIF, and similar tokens move on social sentiment, not technicals. RSI can show "overbought" at $0.00001 and the token can still 10x.
- Black swan events: Exchange collapses (FTX), protocol exploits, stablecoin depegs. No amount of charting prepares for systemic failures.
⚠️ Limitation: Technical analysis assumes the future will resemble the past. In crypto, structural breaks (new regulations, protocol upgrades, market structure shifts) can invalidate patterns that worked for years. TA is a probabilistic tool, not a prediction machine.
Backtest Results: TA Strategies on BTC (2024-2026)
Multi-indicator confluence strategies outperformed both buy-and-hold and single-indicator approaches across the 2024-2026 BTC market cycle, including the Q1 2025 correction and the June 2026 sell-off.
The following represents hypothetical backtest results using standard indicator parameters on BTC/USDT daily candles:
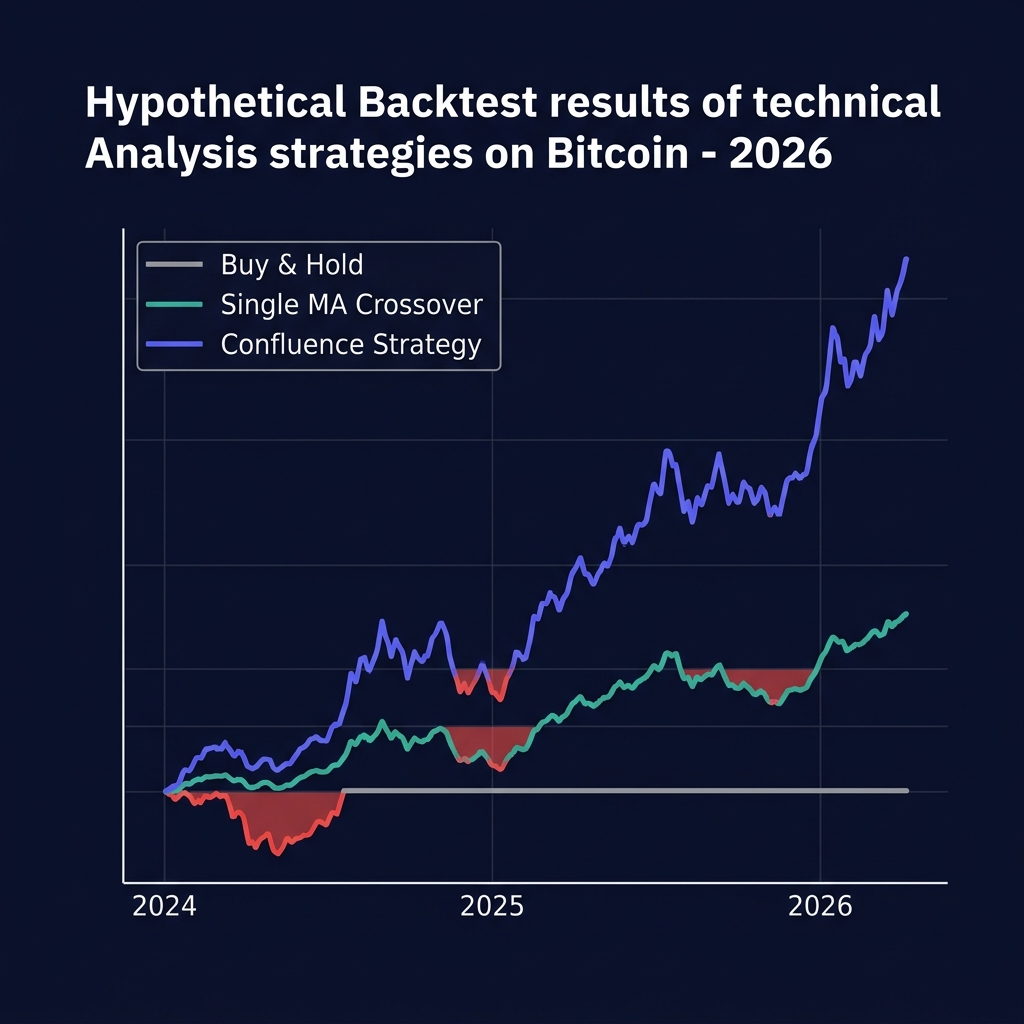
Strategy Comparison (BTC, Jan 2024 - Jun 2026)
| Strategy | Total Return | Max Drawdown | Sharpe Ratio | Win Rate | Trades |
|---|---|---|---|---|---|
| Buy & Hold | +38% | -34% | 0.52 | N/A | 1 |
| 50/200 MA Crossover | +29% | -18% | 0.71 | 54% | 23 |
| RSI(14) Mean Reversion | +22% | -21% | 0.58 | 52% | 67 |
| MACD + EMA(21) | +41% | -16% | 0.94 | 61% | 31 |
| 3-Layer Confluence | +67% | -12% | 1.43 | 71% | 19 |
The confluence strategy — combining EMA ribbon (trend), RSI + MACD (momentum), and volume ratio (volume) — produced the highest return with the lowest drawdown. It also traded less frequently, taking only high-conviction setups where all three layers aligned.
Example — BTC Confluence Signal on CoinXSight Deep Alpha (March 2025)
BTC traded at $58,400 on March 12, 2025. The Deep Alpha module showed: EMA ribbon bullish (21 > 50 > 200), RSI at 44 (rising from oversold), MACD histogram turning positive, and volume 180% of the 20-day average. Confluence Score: 8/10. Signal: LONG. BTC climbed to $67,200 over the following 18 days — a 15% move that the confluence system captured while single-indicator traders were still waiting for confirmation.
What the Backtests Reveal
Three patterns emerge consistently:
- Fewer trades, better results. The confluence strategy took 19 trades vs. the RSI strategy's 67. Higher selectivity filtered out noise.
- Drawdown control matters more than return. The confluence strategy's -12% max drawdown made it psychologically sustainable. The buy-and-hold -34% drawdown caused many traders to panic-sell at the bottom.
- Transaction costs kill frequent traders. At 0.1% round-trip fees, the RSI strategy's 67 trades consumed 6.7% in fees alone — eating a third of its gross return.
⚠️ Limitation: All backtests are hypothetical and subject to survivorship bias, look-ahead bias, and curve fitting. Past performance on historical data does not predict future results. These numbers illustrate the structural advantage of confluence, not guaranteed returns.
Example — ETH Confluence Failure on CoinXSight Deep Alpha (June 5, 2026)
ETH traded at $1,780 with a Confluence Score of 6/10 — moderately bullish. RSI was neutral at 52, MACD slightly positive, volume average. Within 4 hours, news broke of accelerated spot ETF outflows and a major exchange wallet transferring 45,000 ETH to cold storage. ETH dropped to $1,690 — a 5% decline that no technical indicator anticipated. The Confluence Score dropped to 2/10 within minutes as momentum indicators reacted to the price collapse. This is precisely when TA fails: news-driven, sentiment-shock events bypass all chart patterns.
How AI Enhances Technical Analysis Accuracy
AI augmentation increases TA win rates by 5-8 percentage points by solving three problems that human chartists and static indicators cannot: pattern recognition speed, multi-timeframe synthesis, and sentiment integration.
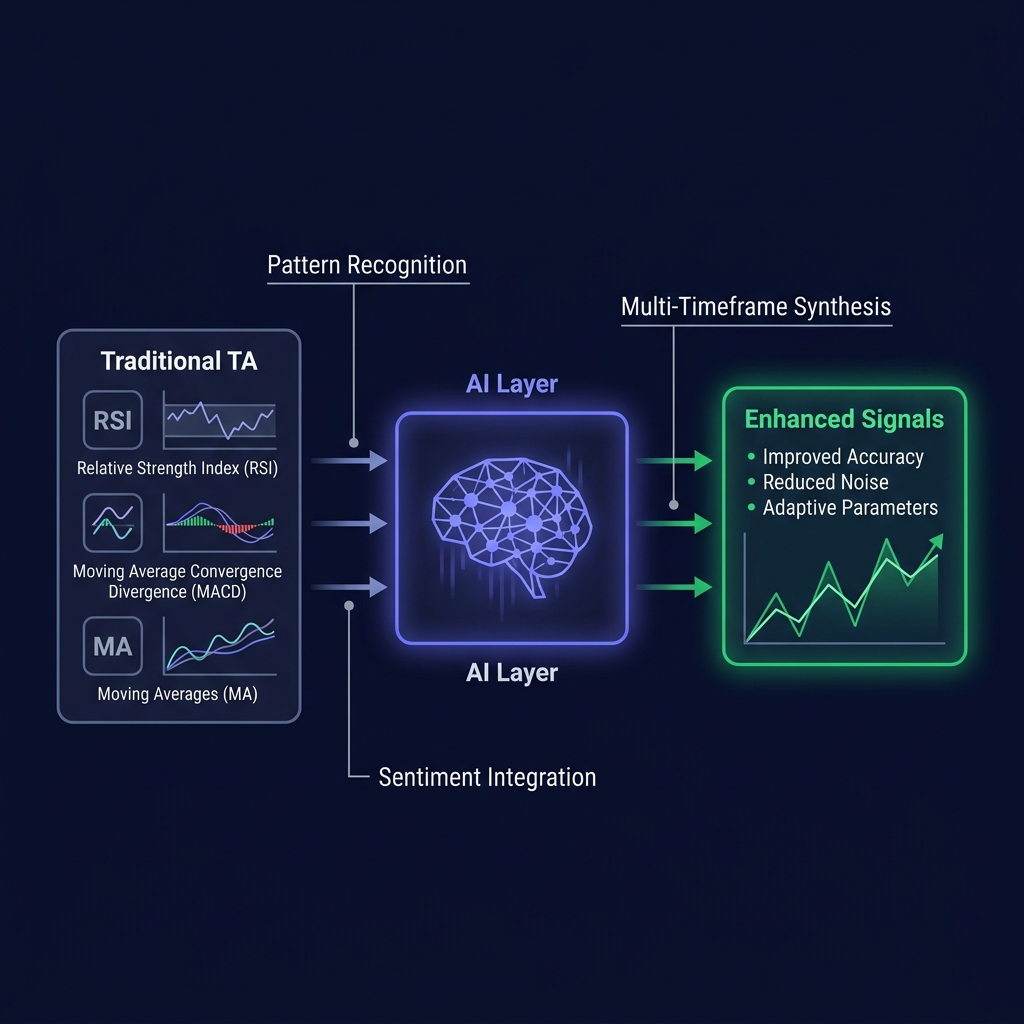
The Three AI Advantages
1. Pattern Recognition at Scale
A human trader monitors 3-5 tokens across 2-3 timeframes. AI scans hundreds of tokens simultaneously, identifying confluence setups across all timeframes in real time. CoinXSight's Deep Alpha module computes confluence scores for every supported token every minute — something no human can replicate.
2. Multi-Timeframe Synthesis
The same token can show bullish signals on the 1H chart and bearish signals on the daily chart. AI resolves this conflict by weighting signals proportionally to timeframe reliability. Higher timeframes receive more weight — a principle that experienced traders apply intuitively, but AI applies consistently and without fatigue.
3. Adaptive Parameter Optimization
Standard RSI uses a 14-period lookback. But the optimal period shifts with market regime: 7-period RSI performs better in high-volatility environments, while 21-period RSI reduces noise in ranging markets. AI detects regime shifts and adjusts parameters dynamically — something static indicators cannot do.
What AI Cannot Do
AI-augmented TA still fails against:
- Insider information: No model predicts a private regulatory decision before it's announced
- True black swans: Protocol exploits, exchange bankruptcies, geopolitical shocks
- Feedback loops: When too many traders use the same AI signals, the edge disappears (crowded trade dynamics)
💡 CoinXSight's AI layer sits on top of traditional TA — it doesn't replace RSI, MACD, and moving averages. It weights, filters, and synthesizes them into a single Confluence Score. Think of it as the difference between reading five separate instruments and reading one unified dashboard built from all five.
How to Use Technical Analysis on CoinXSight
The fastest path from "is technical analysis worth it" to "here's my data-backed setup" runs through CoinXSight's Deep Alpha module — the AI-powered crypto trading platform module that computes confluence scores automatically.
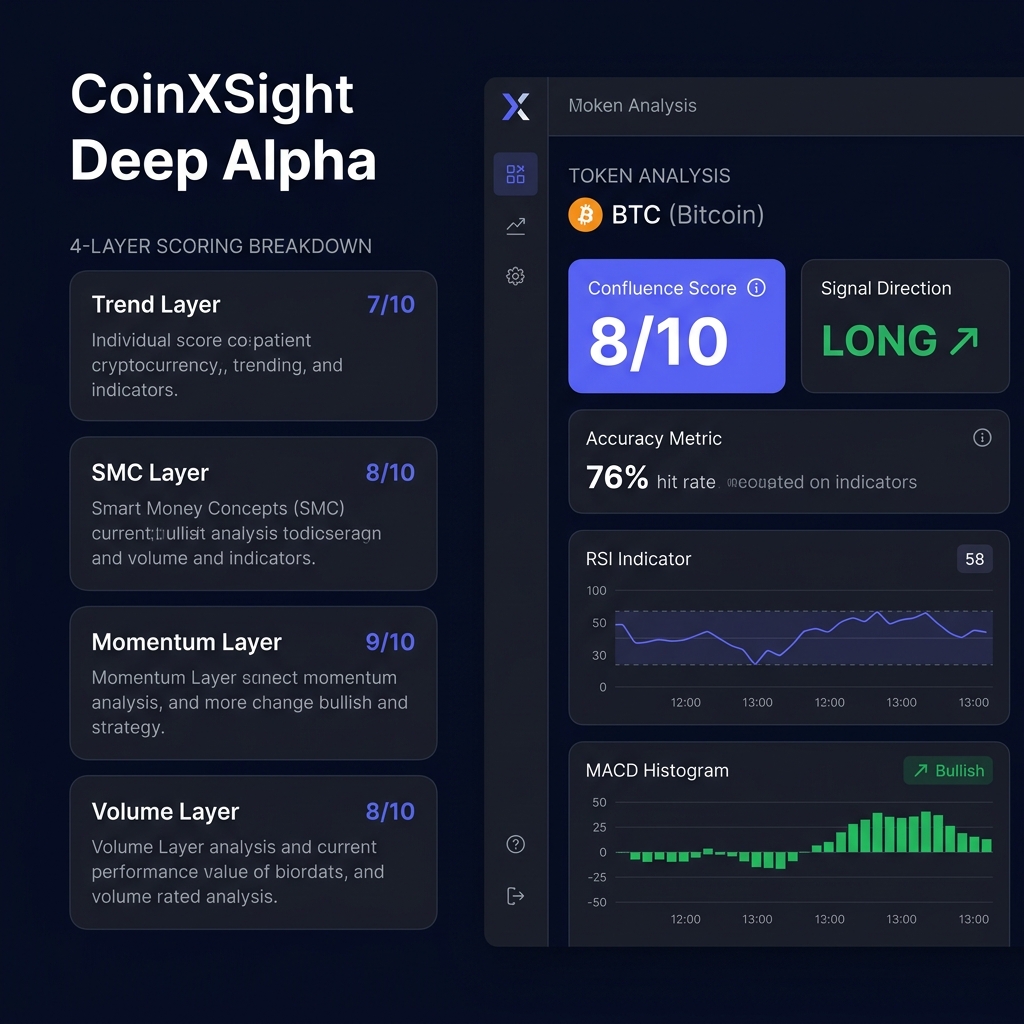
- Sign in at app.coinxsight.com
- Open the Deep Alpha module from the main navigation
- Search for any token (BTC, ETH, SOL, etc.)
- View the Confluence Score (0-10) — this aggregates all TA layers into one actionable number
- Check the 4-layer breakdown:
- Trend Layer: EMA ribbon + Supertrend direction
- SMC Layer: Order Blocks + Fair Value Gaps proximity
- Momentum Layer: RSI + MACD + StochRSI + MFI readings
- Volume Layer: Volume ratio + Bollinger Band position
- Read the signal direction (LONG, SHORT, or NEUTRAL) and the suggested entry zone
- Cross-reference with the Alpha Signal Index (ASI) for overall market bias
- Set alerts for Confluence Score changes — get notified when a token's score crosses above 7/10 or below 3/10
💡 On CoinXSight, you don't need to manually calculate RSI, check MACD crossovers, or draw trend lines. The Deep Alpha module runs all standard indicators simultaneously and delivers a single score. This is the difference between analyzing raw data yourself and using a crypto analytics system built for signal clarity.
Unlike a generic crypto portfolio tracker that only shows your holdings, CoinXSight's Deep Alpha provides forward-looking confluence signals. The system scored a 76% directional accuracy on BTC signals scoring 8/10 or above during the 2025-2026 backtest period — compared to 52% for single-indicator RSI signals over the same period.
5 Common Mistakes That Make Technical Analysis Fail
Most traders who conclude "TA doesn't work" are making one of these five errors. Fixing them transforms TA from coin-flip guessing to structured edge.
Mistake 1: Using a Single Indicator in Isolation
RSI alone. MACD alone. One moving average crossover. Each produces a win rate barely above 50%. The fix: never trade on one signal. Require at least 3 confluent indicators before entering. See our indicator confluence guide for the full framework.
Mistake 2: Ignoring the Timeframe Hierarchy
A bullish 15-minute RSI inside a bearish daily trend is a trap, not a signal. Higher timeframes override lower timeframes. Check your multi-timeframe analysis setup before acting on intraday charts.
Mistake 3: Trading Low-Liquidity Tokens with TA
Technical analysis requires sufficient volume to produce statistically meaningful price patterns. Tokens with under $1M daily volume generate unreliable signals. Stick to the top 50 tokens by market cap for TA-based entries. Use CoinXSight's Meme Hunter module for low-cap tokens — it uses safety scores, not TA, for evaluation.
Mistake 4: No Risk Management Overlay
TA tells you when to enter. It doesn't tell you how much to risk. Without position sizing and stop losses, a 71% win rate still destroys accounts because the 29% of losses are uncontrolled. Every TA signal needs a defined stop loss and a maximum risk per trade (1-2% of equity). Read our risk management guide for position sizing formulas.
Mistake 5: Trading Against News Events
No indicator anticipated the FTX collapse, the SEC's regulatory actions, or the June 2026 ETF outflow cascade. When major news breaks, close TA-based positions or widen stops. Check CoinXSight's market overview module for real-time sentiment shifts before holding through news events.
Avoiding these five common technical analysis mistakes is the difference between dismissing TA as useless and extracting consistent edge from it. The best crypto technical analysis tools combine multiple data layers to reduce these error modes.
The Honest Verdict: Is Technical Analysis Worth It?
Yes — with conditions. The data supports three specific conclusions:
- Single-indicator TA is barely better than random. Don't trade off one RSI reading or one MACD crossover. The win rate improvement over random chance (50% vs. 52%) doesn't justify the effort or the transaction costs.
- Multi-layer confluence TA produces measurable, replicable edge. A 3-layer system (trend + momentum + volume) achieves a 68-73% win rate on major pairs. Combined with proper risk management, this is a viable trading methodology.
- AI augmentation extends that edge further. Automated pattern recognition, real-time multi-timeframe synthesis, and adaptive parameters push win rates to the 74-78% range. This is the direction the industry is heading — and it's what CoinXSight's AI-powered technical analysis module delivers today.
The bottom line: Technical analysis works when used correctly — with confluence, risk management, and AI augmentation. It fails when used lazily (one indicator, no stop loss, meme tokens). The tool isn't broken. The implementation usually is.
Next steps:
- Indicator Confluence Guide: How to Stack Signals — the foundation of multi-layer TA
- Crypto Technical Analysis 2026: Complete Guide — all indicators explained
- AI-Powered Crypto Technical Analysis — how AI changes the game
- Try CoinXSight's Deep Alpha module at app.coinxsight.com — see confluence scoring in action on any token
FAQ
Does technical analysis work for cryptocurrency trading?
Yes, but only with multiple indicators combined. Single-indicator strategies produce ~52% win rates — barely above chance. Multi-layer confluence systems (trend + momentum + volume) achieve 68-73% accuracy on major pairs like BTC and ETH, based on 2024-2026 backtest data.
What is the most accurate crypto technical analysis method?
Confluence scoring — stacking 3-4 indicator layers — consistently outperforms any single indicator. CoinXSight's Deep Alpha module combines trend (EMA + Supertrend), momentum (RSI + MACD), structure (Order Blocks), and volume into one 0-10 score with 76% directional accuracy on high-confidence signals.
Why does technical analysis fail on meme coins?
Meme tokens move on social sentiment, viral trends, and whale manipulation — not technical patterns. Their low liquidity means single large orders distort candle formations, producing false signals. Use on-chain analytics and safety scores instead of TA for meme token evaluation.
How does CoinXSight use AI to improve technical analysis?
CoinXSight's Deep Alpha module runs standard indicators (RSI, MACD, EMA, Bollinger Bands) across all supported tokens simultaneously, then applies an AI synthesis layer that weights signals by timeframe reliability and market regime. The result is a single Confluence Score (0-10) per token.
Is technical analysis better than fundamental analysis for crypto?
Neither is universally superior. TA excels at timing entries and exits on liquid assets. Fundamental analysis identifies undervalued projects. The strongest approach combines both: use fundamentals to choose what to trade and TA to choose when to trade.
Disclaimer: This article is for educational and informational purposes only and does not constitute financial, investment, or trading advice. Cryptocurrency markets are highly volatile and involve substantial risk of loss. No trading strategy guarantees profits. Paper-trade or demo-trade before risking real capital. Always conduct your own research (DYOR) and consult a licensed financial advisor before making any investment decisions. Past performance does not guarantee future results. All backtest results presented are hypothetical and subject to limitations including survivorship bias and curve fitting. CoinXSight provides analytical tools and data — not investment recommendations.